
Being an investor in 2024 means having the liberty to choose a portfolio of assets such as mutual funds managed by professionals.
That said, it’s cumbersome to research each and every asset within a portfolio, especially when your hard-earned money is at stake.
Measures such as the Treynor Ratio exist to help you with your research.
It tells you whether an investment is worth the risk based on the returns generated by the portfolio of assets.
We’ll walk you through the practical implications of using the ratio and why investors, especially mutual fund investors, check it.
What is the Treynor Ratio?
Treynor Ratio is a reward versus risk measure that displays the excess returns generated by the portfolio per unit of risk taken to deliver those very returns.
Suppose a risk-free investment such as government bonds or bank fixed deposits generates X% returns.
Any returns generated over and above the X% by the portfolio of assets are known as excess returns.
Why should you care about excess returns? Well, ask yourself this. Why invest in the markets? Because you want better-than-average returns.
Specifically, you want to generate better returns than a bank fixed deposit or bonds.
To earn these excess returns, you’re taking a higher risk each time the return goes up over and above the risk-free rate.
Jack Treynor’s “Treynor Ratio” tells you whether taking that level of risk is worth the returns. Useful, isn’t it?
Formula to Calculate Treynor Ratio
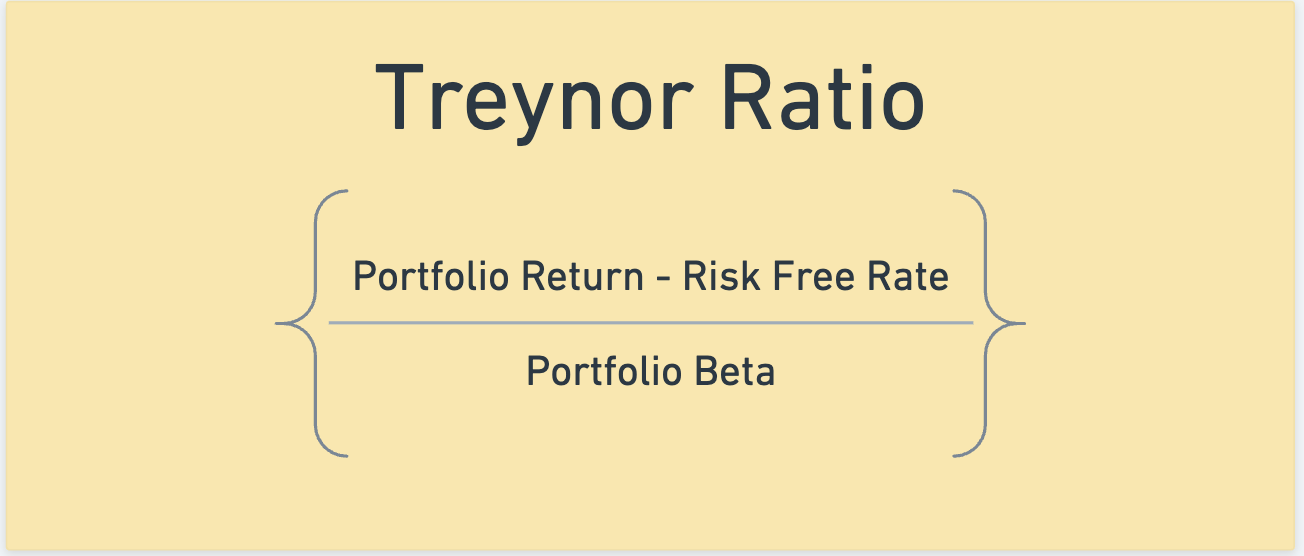
The three values you need to calculate the Treynor Ratio are:
- Returns generated by the portfolio of assets
- Risk-free return rate
- Beta of the portfolio
Beta itself is a measure of risk, more specifically, of how much risk a stock carries compared to the broader market.
How Does Treynor Ratio Work?
The Treynor Ratio measures risk-adjusted returns by factoring in the systematic risk of the portfolio, excess returns, and risk-free rate.
Systematic risks are beyond the control of a fund or portfolio. Think of events such as the pandemic affecting the market.
Thus, the Treynor Ratio pits an asset such as Mutual Funds with Fixed Deposits or Government Bonds to conclude whether the risk involved is worth the returns generated.
| Value | Inference |
| >1 | Excellent |
| 0.5 to 1 | Good |
| 0 to 0.5 | Moderate |
| 0 | Neutral |
| -0.5 to 0 | Poor |
| <-0.5 | Very poor |
As an example, let’s assume the following:
- Returns generated by portfolio: 12%
- Risk-free return rate: 6%
- Beta of the portfolio: 1.10
Then, your calculation would be as follows:
TR = (0.12-0.06)/1.10
= 0.06/1.10
= 0.0545
Or 5.45% of excess return per unit of risk taken (Moderate). The inference here is that the fund generated moderate returns for each unit of risk it took.
Accuracy & Limitations of Treynor Ratio
As a measure of risk-adjusted return, the Treynor Ratio works well under specific conditions, for specific funds, and with accurate Beta values.
However, the ratio loses its accuracy if the wrong benchmark is used for calculating Beta. Even minor deviations in Beta can disrupt the Treynor Ratio’s accuracy.
For example, you can’t measure a large-cap fund’s TR using a small-cap index as the benchmark. Besides requiring the correct Beta, the Treynor Ratio has other limitations.
It is a lagging indicator, meaning it assesses a fund’s past performance, not its present or future risk-adjusted returns.
Additionally, the Treynor Ratio assumes a linear relationship between portfolio returns and market returns, which may not always hold true.
Furthermore, it only considers systematic risk, ignoring unsystematic risk that could affect the portfolio.
Unsystematic risks are company-specific, such as improper management or declining earnings.
Conclusion
The Treynor Ratio helps you understand whether it’s worth taking a risk to earn returns on any given portfolio of assets.
You can understand the risk-adjusted return for Mutual Funds, ETFs, and other pool of assets using the ratio.
As with any tool such as economic, fundamental, or technical indicators, the Treynor Ratio must be used in conjunction, not in isolation.