

Oil and Natural Gas Corporation (ONGC), established in 1956, is India’s largest government-owned oil and gas producer. The company plays a crucial role in meeting the country’s energy needs.
ONGC recently announced its December quarter results for the fiscal year 2025. Here is what you need to know about the company’s quarterly performance.
ONGC Financials
Now, let’s take a look at ONGC’s financial performance. The table below presents key figures for Q3 FY25 and Q2 FY25, along with their Quarter-on-Quarter (Q-o-Q) growth. It also includes Q3 FY24 data to highlight Year-on-Year (Y-o-Y) growth trends.
| Metric | Q3 FY25 | Q2 FY25 | Q-o-Q Growth (%) | Q3 FY24 | Y-o-Y Growth (%) |
| Total Income | 33716.8 | 33880.88 | -0.48 | 34788.07 | -3.07 |
| Selling/General/Admin Expenses (Other Expenses) | 6,520.76 | 5,647.80 | 15.46 | 5,550.31 | 17.48 |
| Depreciation and Amortisation Expense | 6,778.76 | 5,597.89 | 21.09 | 5,101.82 | 32.87 |
| EBITDA | 17779.02 | 15868.24 | 12.04 | 17712.15 | 0.37 |
| EBITDA Margin (%) | 35.81 | 47.79 | -25.07 | 39.19 | -8.62 |
| Total Operating Expense | 24,527.54 | 23,610.52 | 3.88 | 25,578.43 | -4.10 |
| Operating Income | 11,000.26 | 15,036.00 | -26.84 | 12,610.33 | -12.76 |
| Net Income Before Taxes | 11,000.26 | 15,036.00 | -26.84 | 12,610.33 | -12.76 |
| Net Income | 8,239.92 | 11,984.02 | -31.24 | 9,891.71 | -16.69 |
| Diluted Normalized EPS | 6.55 | 9.53 | -31.26 | 7.86 | -16.66 |
* All figures are in INR Crore.
Highlights
- A Decline in Total Income: ONGC’s total income fell to ₹33,716.8 crore in Q3 FY25, a 0.48% decline Q-o-Q and 3.07% drop Y-o-Y, reflecting lower revenue generation.
- Rising Expenses Impact Profitability: Other expenses grew 15.46% Q-o-Q and 17.48% Y-o-Y, while depreciation surged 21.09% Q-o-Q, increasing cost burdens and affecting earnings.
- EBITDA Grows but Margin Shrinks: EBITDA improved by 12.04% Q-o-Q but EBITDA margin dropped by 25.07% Q-o-Q, indicating weaker cost efficiency despite higher absolute earnings.
- Sharp Decline in Net Income: Net income fell 31.24% Q-o-Q and 16.69% Y-o-Y, showing reduced profitability due to higher costs and lower operating efficiency.
- Announced Interim Dividend: It announced an interim dividend for the second time at ₹5 for each equity share having a face value of ₹5.
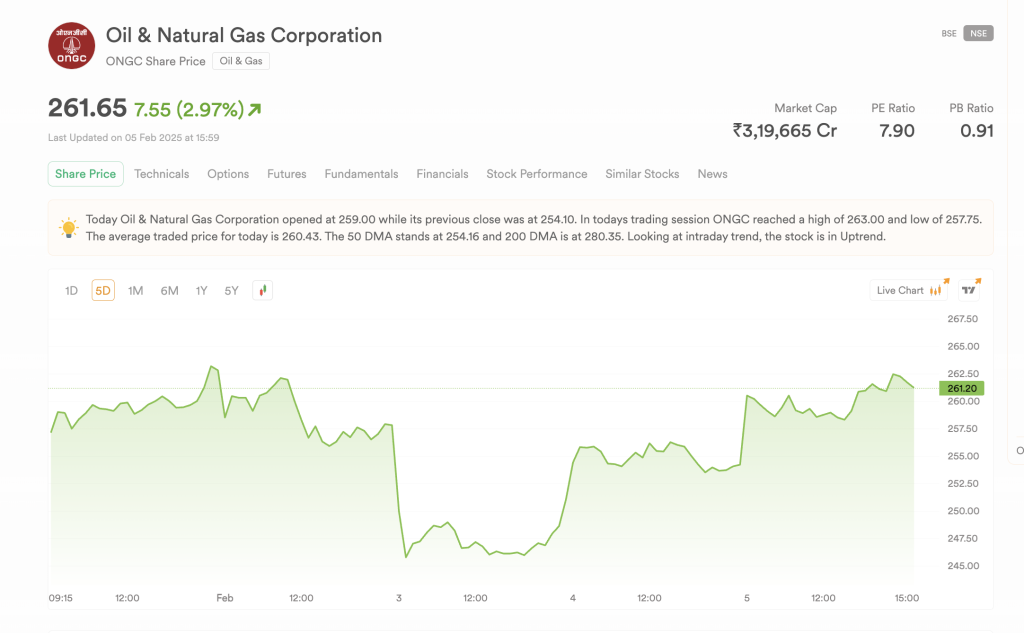
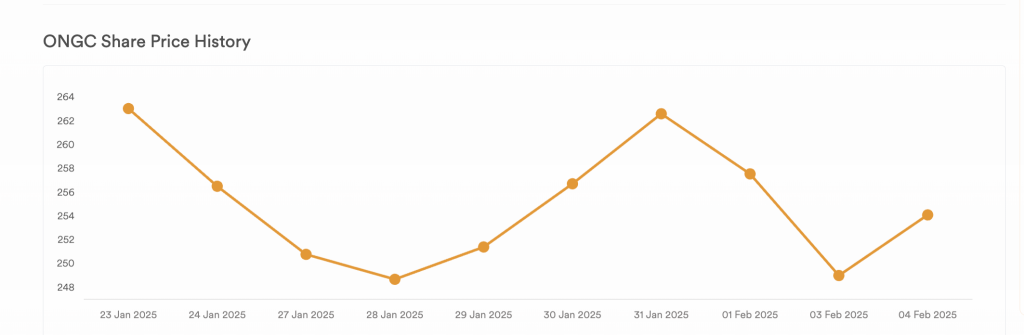
ONGC in the Markets
ONGC’s Q3 FY25 results highlight a challenging quarter, with declining total income and net income despite an increase in EBITDA. Rising operational costs and depreciation impacted profitability, leading to a lower EBITDA margin.
While the company announced an interim dividend of ₹5 per share, the overall financials reflect the pressure of cost escalation on earnings. Investors should closely monitor future performance and industry trends to gauge ONGC’s growth trajectory.