



Gold vs Nifty 50 on Dhanteras: Last 10 years' trend





Key takeaways:
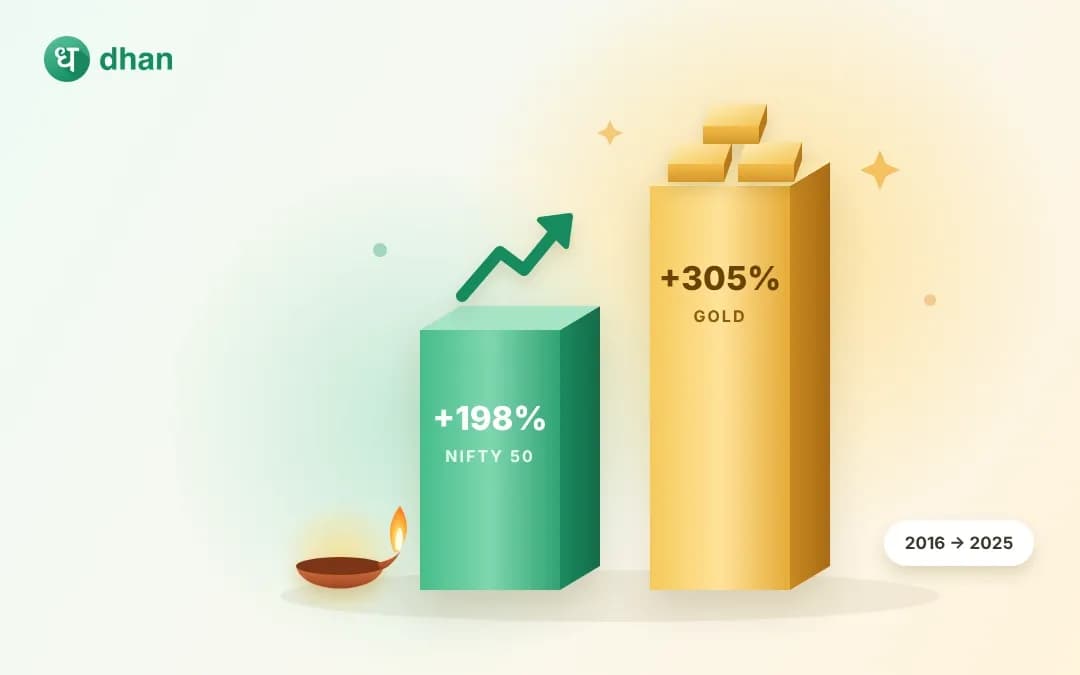
- Between October 2016 and October 2025, gold prices rose 305.4%, compared with a 198.2% increase in Nifty 50.
- The average gold price in Mumbai rose from ₹30,071.37 to ₹1,21,907.67 per 10 grams during the period.
- The index climbed from 8,625.70 in October 2016 to 25,722.10 in October 2025, despite fluctuations along the way.
- Strong investment demand, central-bank purchases, geopolitical uncertainty and inflows into gold-backed ETFs supported the global gold market.
- Gold delivered higher price appreciation over this period, but investors should compare costs, risks, dividends and diversification benefits before choosing between gold and equities.
Gold and NIFTY 50 have both delivered notable gains over the past decade. In this blog, we’ll compare their performance around Dhanteras over the last 10 years and explore how gold prices have moved against the stock market.
What does the 10-year comparison show?
Here are the key findings:
How did gold and Nifty 50 perform in each Dhanteras month?
The table below compares gold’s average monthly price in Mumbai with NIFTY 50 levels around Dhanteras over the years.
Data note: The dates are reproduced as provided. The price figures are monthly observations, not prices recorded on the exact Dhanteras dates. The gold series begins in October 2016, so 2015 is excluded from the comparable performance calculations.
The table shows that the gold series experienced a decline in its monthly average between the 2016 and 2017 observations, before entering a sustained upward trend. The price also declined between the 2020 and 2021 observations, showing that gold does not move in a straight line.
Nifty 50, meanwhile, rose from 8,625.70 in the October 2016 observation to 25,722.10 in October 2025. However, the index's long-term advance did not match gold's cumulative price appreciation over the same endpoint period.
Why did gold pull ahead in 2025?
The sharp increase in gold during the latest comparison coincided with an exceptionally strong global gold market. According to the World Gold Council’s Gold Demand Trends report, published on 29 January 2026:
- Global gold demand, including over-the-counter demand, exceeded 5,000 tonnes in 2025 for the first time.
- Global gold-backed ETF holdings increased by 801 tonnes.
- Central-bank gold purchases reached approximately 863 tonnes.
- The global gold price recorded 53 new all-time highs during 2025.
The World Gold Council identifies safe-haven demand, diversification, geopolitical and economic uncertainty, and investment activity as key factors supporting gold demand. These factors help explain the strong rally in gold prices, although they do not fully explain price movements in India.
Domestic gold prices are also influenced by international bullion prices, the rupee-dollar exchange rate, import costs and applicable taxes. For investors, the comparison with equities is important: gold can benefit from uncertainty and investment demand, while stock performance also depends on corporate earnings, profitability and economic growth.
Does gold’s outperformance mean it is a better investment than equities?
Not necessarily. Gold delivered a higher price gain than the Nifty 50 between October 2016 and October 2025, but this alone does not mean it is the better investment. Both assets have different benefits and risks.
- Gold can benefit from uncertainty. Investors may buy gold during economic or geopolitical uncertainty, increasing demand and prices.
- Equities can benefit from business growth. Stock prices can rise when companies grow their earnings and profits. Investors may also earn dividends.
- Returns are not directly comparable. Nifty 50 figures used here exclude dividends. Gold prices exclude jewellery-making charges and GST, which can increase the actual purchase cost.
- Monthly data has limitations. The figures show monthly observations, not the exact gold or index levels on Dhanteras itself.
Gold recorded stronger price growth over this period, but choosing between gold and equities also depends on investment costs, potential returns, risk and financial goals. Past performance does not guarantee future results.
Conclusion
Gold’s monthly average price increased 305.4% between October 2016 and October 2025, compared with a 198.2% rise in the Nifty 50 level for the same months. The result favours gold on price appreciation over this period, but it does not guarantee future outperformance. Investors should consider their investment horizon, risk tolerance, diversification needs and the appropriate total-return benchmarks before choosing between the two asset classes.