The Vortex Indicator is used to determine trend directions and strengths in financial markets.
By analyzing the Vortex Indicator, traders can realize turning points of trends, validate their directions, and create buy and sell signals for positions.
In this article, we shall look at the underlying concepts behind the Vortex indicator, its importance in trading, and how traders may use it to boost their trading strategies to meet their objectives for making money.
What is a Vortex Indicator?
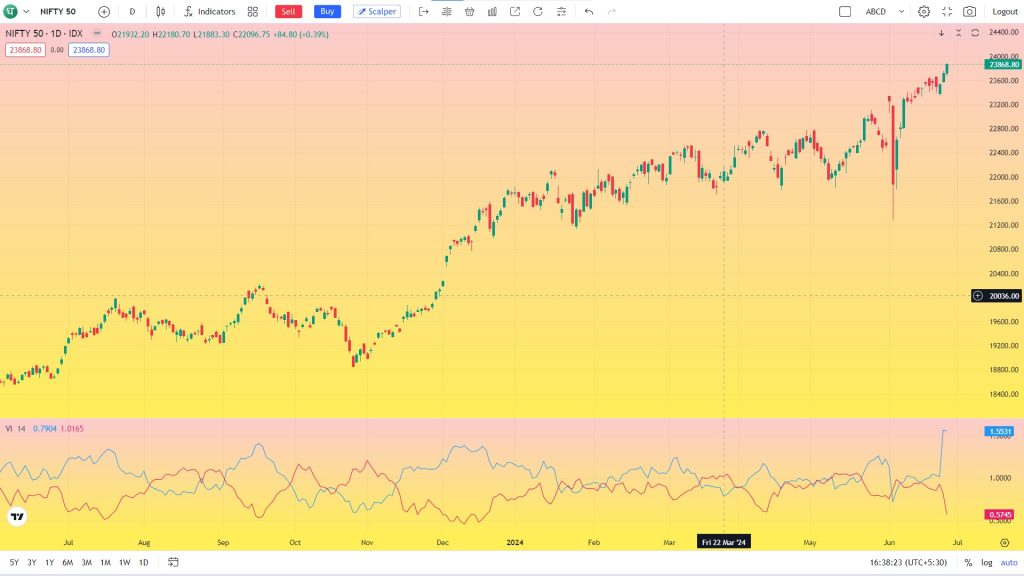
Vortex Indicator is a technical analysis tool that gauges the direction and strength of trends in financial markets. It comprises two lines: VI- (negative vortex line) and VI+ (positive vortex line).
The technical indicator estimates the power of upward and downward price movements by contrasting today’s high to yesterday’s low (for VI+) and today’s low to yesterday’s high (for VI-).
Traders apply the Vortex Indicator for purposes of trend reversals, confirming existing trends as well as producing entry and exit signals for trades.
How to Calculate Vortex Indicator
The Vortex Indicator consists of two lines: the Positive Vortex Line (VI+) and the Negative Vortex Line (VI-). The calculation is as follows:
1. True Range (TR): True range can be calculated by comparing three different values:
- Current high minus current low
- The absolute value of the current high minus the previous close
- The absolute value of the current low minus the previous close
2. Positive Vortex Movement (VM+): Compute the positive Vortex movement (VM+) by getting the absolute difference between the current high and the previous low.
3. Negative Vortex Movement (VM-): Calculate the negative Vortex movement by taking the absolute value of the difference between the present day’s low and the previous day’s high.
4. Smooth the values: Use a smoothing length (normally 14 periods) to obtain smoothed VM+ and VM-.
5. Calculate VI+ and VI-: Divide smoothed VM+ by smoothed TR to get VI+, while divide smoothed VM- by smoothed TR to get VI-.
Afterward, plotting VI+ and VI-on a chart can help you visualize the trend direction and strength, which is shown by the Vortex Indicator.
Uses of the Vortex Indicator
Here are some of its uses:
- Trend Identification: The VI is used to confirm current trends using a pair of oscillating lines.
It plots two oscillating lines: one to identify positive trend movement and the other to identify negative price movement. - Trend Reversals: The VI is used to spot trend reversals. Crosses between the lines trigger purchase and sell signals that are designed to capture the most dynamic trending action, higher or lower.
- Signal Generation: Traders can use the VI as a standalone signal generator. However, it’s important to note that it can be vulnerable to significant whipsaws and false signals in congested or mixed markets.
- Synergy with Other Indicators: When used with other indicators, the VI may assist in identifying patterns and trends and provide confidence to reversal signs.
While extending the VI’s duration would reduce the frequency of whipsaws, it will also result in delayed positive or negative crossovers.
The Vortex Indicator works well when combined with other technical analysis tools such as moving averages, RSI, or MACD.
Remember, like all technical indicators, the VI uses historical price data to predict trends in the prices of stocks, commodities, or currencies.
It’s always a good idea to use it as part of a larger trading system.
A Vortex Indicator Trading Strategy
In the 2010 article introducing the Vortex indicator, Botes and Siepman outlined a Vortex indicator strategy aimed at minimizing false signals.
This strategy involves using the extreme high or low of the day during a bullish or bearish crossover as the target entry price for long or short positions.
If these levels aren’t reached on the signal day, a buy or sell order is placed with a “good-until-canceled” status, remaining active across multiple sessions if necessary.
When placed at the crossover point, the highest or lowest point becomes the level at which the stop and reverse action occurs.
Following this strategy, a short sale will be covered and reversed into a long position when the price revisits the highest point after a positive crossover.
Conversely, a long position will be sold and reversed into a short position once the price revisits the lowest point after a negative crossover.
They also suggest using entry filters alongside other risk management methods like trailing stops and profit protection stops.
These protective measures help reduce false signals and maximize profits even when the trend doesn’t gain much momentum.
However, this strategy doesn’t address the issue of period length, which can lead to frequent false signals until it is adjusted to fit the predetermined holding period and thoroughly tested.
By using this vortex indicator, also you can use unlimited indicators on our TradingView platfrom which is tv.dhan.co!
Conclusion
Learning about the Vortex Indicator can help you make better trading decisions. It gives you insights into trends and how strong they are, which is super helpful.
Keep practicing with it and adjust your strategies as needed based on market conditions.