What is the Average True Range Indicator (ATR)?
The Average True Range Indicator is a measure of volatility that was developed by J. Welles Wilder. The ATR indicator can be used for position sizing, profit targets, and set trailing stop loss orders.
Volatility is often associated with an active or inactive market. But this may be a thin definition according to Wilder.
Instead, he suggested that the concept of volatility stretches beyond market activity or inactivity into “range”, where the range is the difference between a set of prices across a specific period of time.
Even then there may be gaps or limit moves between the previous close and the opening price.
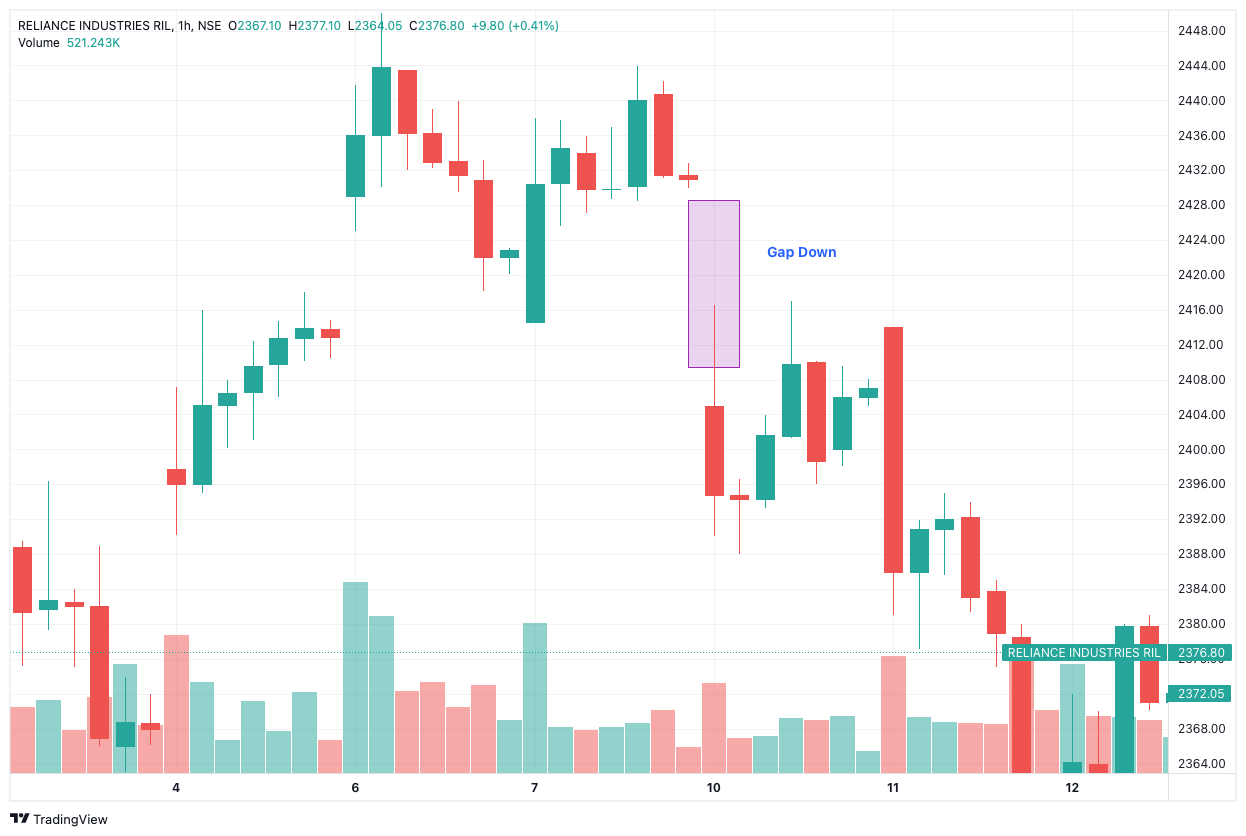
Gaps occur when there’s a difference between the two prices even though there’s little to no trading activity in between. There are two types of gaps:
- Gap Up: The previous day’s closing price is lower than the next day’s opening price
- Gap Down: The previous day’s closing price is higher than the next day’s opening price

Thus, there’s a need to observe the True Range of a set of prices. That’s the problem Wilder solved with the ATR.
The Average True Range is generally calculated for 14 days (periods), but shorter or longer periods can be taken as well.
There are 1-minute, 5-minute, 30-minute, and more ATR charts as well. Overall, the ATR indicator is used to make better trading decisions like position sizing, profit targets, or stop-loss orders.
By the way, identifying these two gaps form a strategy known as Gap Trading
How to Calculate Average True Range Formula?
We’ve spoken about how the True Range is important to calculate the ATR. That’s why we’ll start with the TR calculation first.
True Range Formula
The True Range is calculated as the difference between the previous close and the limit price. More specifically, it is the greatest of the following ranges:
- TR Method #1: Current High – Current Low
- TR Method #2: Current High – Previous Close
- TR Method #3: Current Low – Previous Close
You’ll need to calculate the absolute values of 2 and 3 so that you don’t get any negative numbers. Why?
ATR is not a directional indicator like the Average Directional Index. Instead, it’s used to calculate the distance between two prices, which won’t be optimal with negative values. Here’s the interesting part.
The three ranges mentioned above are observed during an “outside” or “inside” day.
An outside day is when the current high is greater than the previous high while the current low is lesser than the previous low. During an outside day, you’ll use TR Method #1.
When the previous day’s closing price is higher than the current high but lower than the current low, you’ll use TR Methods #2 and #3.
These methods are used to calculate ATR because of gaps, which we spoke about earlier.
Now that you know all of this, you’re ready to calculate the ATR!
Average True Range Formula
In order to find the first ATR, you can start by calculating the TR for a set of time periods. Generally, you would take 14 periods but this is not set in stone.
There are ways to calculate the ATR with minutes, days, and weeks as the time periods. But remember:
- Shorter time periods = more trading signals
- Longer periods = fewer trading signals
The formula for ATR won’t change, just the “n” which is the number of time periods. Once you’ve chosen the periods, subtract the low from the high to get the first set of TR values.
The first ATR will be the average of these TR values. For every ATR value that follows, follow this method:
ATR Formula = {[First ATR x (n-1)] + Current TR} / n
There’s one more thing you should know. Past values have a bearing on future ATRs. That’s why traders generally take more time periods, sometimes in hundreds, to obtain more accurate ATRs.
How Does Average True Range Indicator Strategy Work?
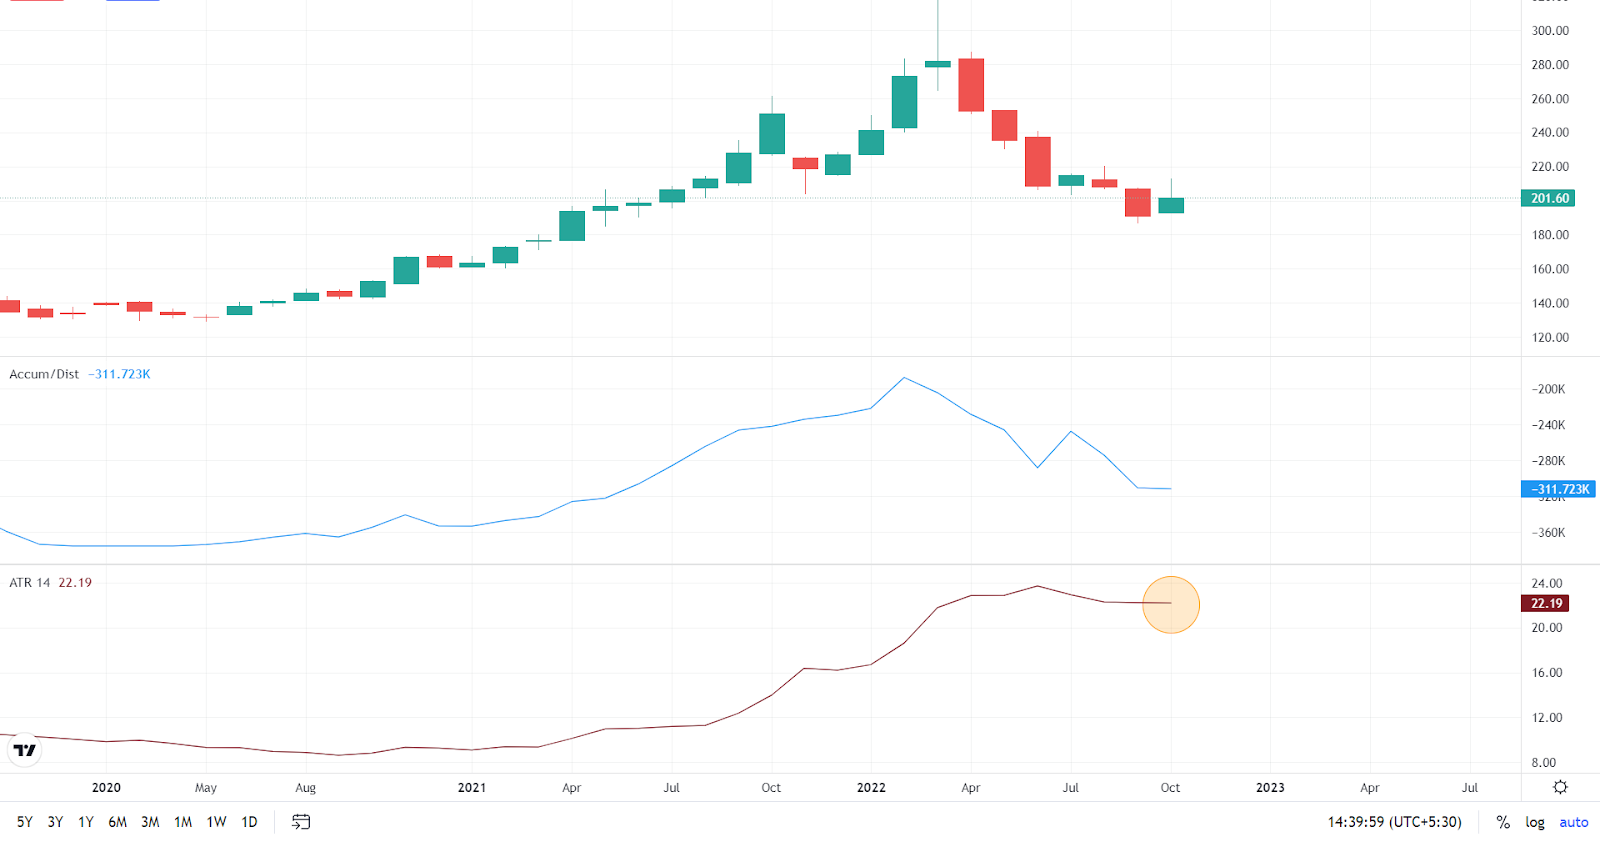
The ATR indicator will give you a value that can be high or low. On a chart, the ATR value would look like this.
The general consensus is to read the ATR values in two ways:
- Higher values = Higher volatility
- Lower values = Lower volatility
You may be wondering why there’s a “general consensus” and not a complete agreement on the method of reading ATR values. That’s because the inferences drawn from ATR will be subjective.
The ATR indicator measures the degree of volatility and price difference between two points. But it cannot tell you where the trend is heading or whether there’ll be a trend reversal.
Furthermore, different securities or scrips will have varying ATR values. This factor may tempt you to compare the ATR of two or more securities. However, that may not be optimal.
For starters, ATR is expressed in absolute terms and not as a percentage. Moreover, a stock with a lower price is known to have a lower ATR compared to a stock that’s priced higher.
Example of Average True Range Indicator Strategy
Meet Mr. Av Raj. He’s a budding trader who’s going to use the Average True Range indicator to accomplish two goals:
- Calculate position size
- Plan a stop loss
In this example, Mr. Av Raj is going to trade stocks, which is another beauty of ATR – it can be used to trade stocks, f&o, commodities, currency derivatives, and other assets as well.
Mr. Av Raj believes that there may be a potential trading opportunity in a stock that costs Rs. 500. He has a starting capital of Rs. 1,00,000 and can handle a loss (risk) of Rs. 5,000.
He wants to use a 2-3 ATR multiple in order to calculate his position size. What this means is simple – if the ATR is 4, he is ready to lose Rs. 8 to Rs. 12 per share.
To be on the safer side, Mr. Av Raj is willing to lose Rs. 8 per share. He will divide 5000 by 8 to find out how many shares he can purchase. Position Size: 5000 / 8 = 625 shares
The share price is Rs. 500, meaning Mr. Av Raj will buy 625 shares for Rs. 31,250 (Rs. 50 per share). As per the Average True Range indicator strategy, he will set a stop loss at Rs. 8 below the purchase price, which will be Rs. 492 in this case.
Pros & Cons of Average True Range Indicator
| Pros of ATR | Cons of ATR |
| Measures volatility | Doesn’t measure direction |
| Indicates high or low volatility | Values are open to interpretation |
| Can help in position sizing | Can result in mixed signals |
| Can help set stop loss | Must be used with other indicators |
Conclusion
The Average True Range is an indicator that’s used to measure the volatility that arises due to gaps between two price points. ATR can be used in the context of stocks, commodities, currencies, and others.
There are benefits to using the ATR indicator. It can be used for position sizing. The Average True Range stop loss, which is another benefit, can help you determine exit strategies for every trade.
What you should also know is that ATR is not a directional indicator and will not help you figure out trend reversals. You may have to use it with other indicators in order to plan broader trading strategies.
P.S: The Average True Range is a pre-built indicator that you can get for FREE on Dhan!