In trading, the Williams Alligator indicator is named after the legendary trader Bill Williams.
This indicator helps traders navigate the market “jungle” by recognizing trends and potential reversals as its name suggests.
Understanding what this indicator entails and how it is applied is crucial for any trader who wishes to make well-informed decisions and stay a step ahead.
This article will focus on explaining what the Williams Alligator stands for as well as why it matters and how it can be properly used to improve trading strategies with an eye towards success in today’s rapidly changing financial environment.
What is the Williams Alligator Indicator?
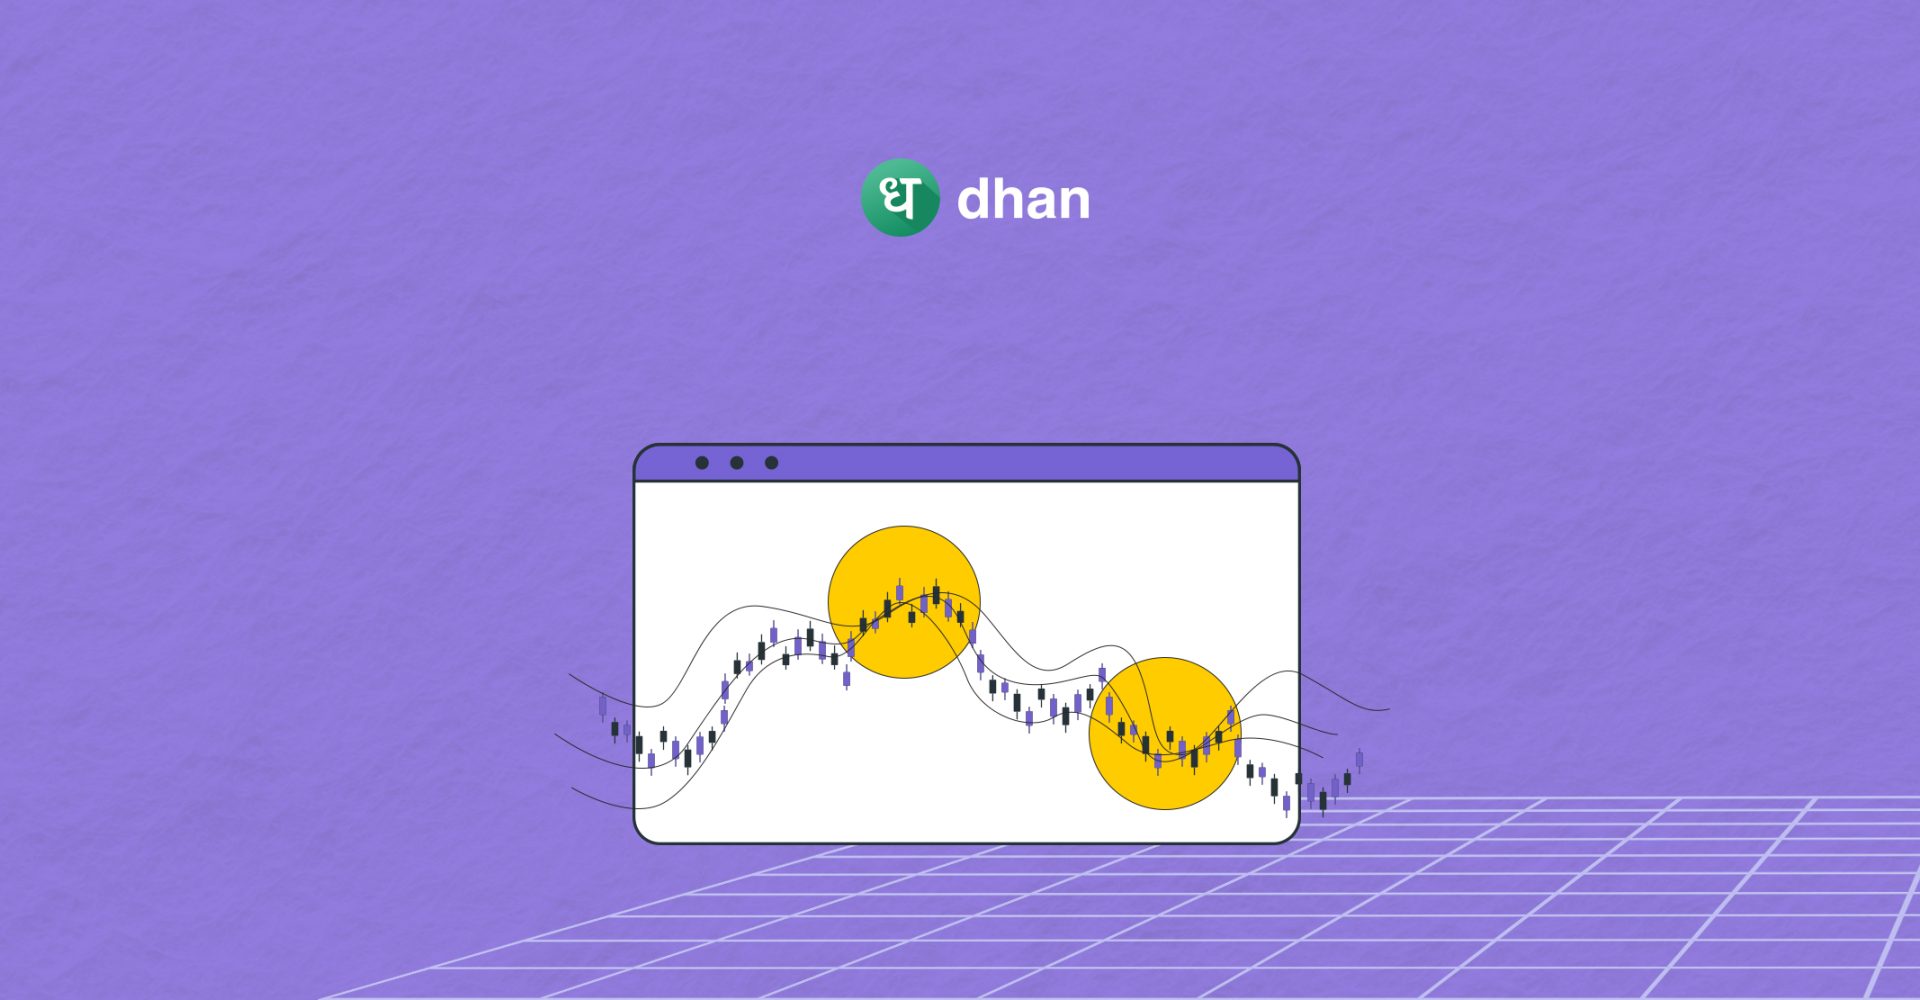
The Williams’ Alligator Indicator is a technical analysis tool created by a famous trader Bill Williams. It consists of three Smoothed Moving Averages (SMAs) plotted on the price chart, which resemble an alligator’s jaws, teeth, and lips.
It helps the traders identify trends, reversals, and potential entry or exit points in the market.
If the three SMAs merge and move in a certain order, it means the alligator is waking up and indicates that there could be potential trades.
The indicator confirms trends for traders and helps them to make informed decisions about various financial markets such as equities, options, futures, commodities, etc.
How the Williams Alligator Indicator Works
The Alligator indicator by Williams uses three moving averages each representing a different aspect of the market behavior: the Jaw, Teeth, and Lips.
The moving averages vary in time frames and are created to detect market trends and changes that could lead to reversals in such trends.
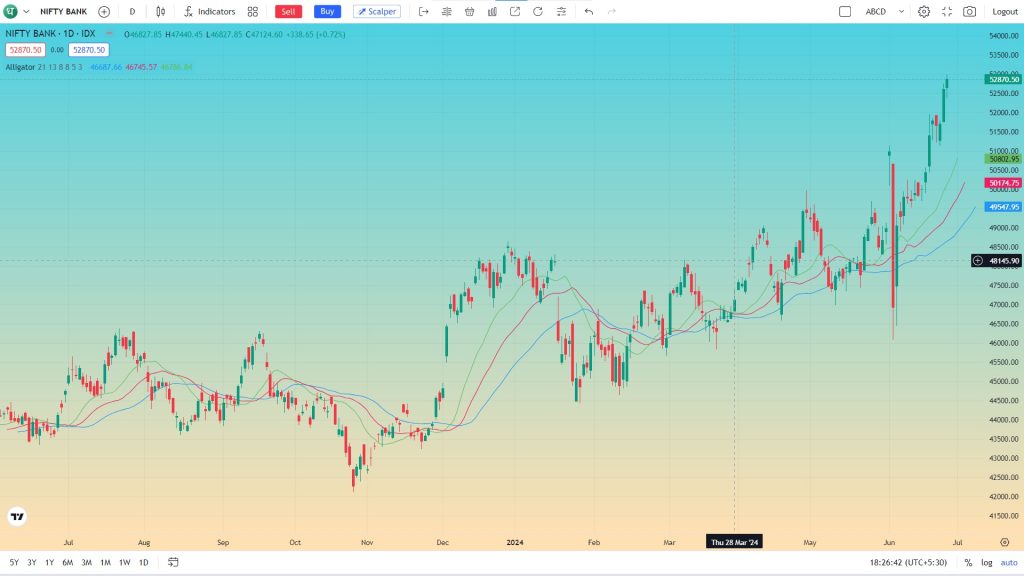
- The Jaw (Blue line): This is a 13-period SMA, which is plotted with a shift of 8 bars into the future. It represents the slowest-moving average and helps identify the long-term trend.
- The Teeth (Red line): This is an 8-period SMA, plotted with a shift of 5 bars into the future. It represents the medium-term trend and helps confirm the direction of the market.
- The Lips (Green line): This is a 5-period SMA, plotted with a shift of 3 bars into the future. It represents the fastest-moving average and helps identify short-term trends.
The calculation of the Alligator Indicator involves a Simple Moving Average (SMA) and subsequent smoothed moving averages that slow down indicator turns.
However, the calculation is not required in practice as the Alligator indicator can be added to your charts from the indicator list in your charting or trading platform.
Williams believed that financial markets and individual securities trend just 15% to 30% of the time while grinding through sideways ranges the other 70% to 85% of the time.
He also believed that individuals and institutions tend to collect most of their profits during strongly trending periods.
Uses of the Williams Alligator Indicator
The Williams Alligator Indicator is primarily used to:
- Identify the Absence of a Trend: When the lines of the Alligator (Jaw, Teeth, and Lips) intertwine, it indicates that the market is ‘sleeping’, and there is no significant trend.
- Detect the Formation of Trends: As the lines start to diverge, it signifies that the ‘Alligator’ is ‘Awake’, and a trend is beginning to form.
- Recognize Existing Trends: When the lines are far apart, it indicates that the trend is strong.
- Determine Entry and Exit Points: Traders often use the crossover of the lines as potential trade entry and exit points.
- Confirm Buy or Sell Signals: The indicator can be used in conjunction with other indicators like the Moving Average Convergence Divergence (MACD) to confirm buy or sell signals.
Remember, the indicator’s signals are more reliable when the alligator is awake than when it is asleep.
Using Williams Alligator in Trading Strategies
The Williams Alligator Strategy is based on the Williams Alligator indicator, which consists of three moving averages: the Jaw, Teeth, and Lips lines.
The indicator can be used in a variety of trading strategies to identify trends, confirm price movements, and generate buy or sell signals.
Here are some common ways traders incorporate the Williams Alligator into their strategies:
1. Trend Following
Traders use the Williams Alligator to confirm the presence of a trend by observing the alignment of its three moving averages (Jaw, Teeth, and Lips).
A bullish trend is signaled when the lips (short-term moving average) cross above the teeth (medium-term moving average), while a bearish trend is indicated when the lips cross below the teeth.
2. Reversal Trading
Traders look for divergences between the Williams Alligator and price action to identify potential trend reversals.
For instance, if the price keeps rising while the Williams Alligator shows lower highs, it might suggest the uptrend is weakening, hinting at a possible trend reversal.
3. Entry and Exit Signals
Traders use the crossing of the Williams Alligator’s moving averages as entry and exit signals.
A bullish signal occurs when the lips cross above the teeth, indicating a potential uptrend and a buy signal.
Conversely, a bearish signal occurs when the lips cross below the teeth, signaling a potential downtrend and a sell signal which means it is your signal to close your position.
4. Confirmation Tool
Traders use the Williams Alligator with other technical indicators or chart patterns to confirm trading signals.
For example, if a bullish candlestick pattern forms near a bullish cross of the Williams Alligator’s moving averages, it could strengthen the buy signal.
Dhan recently became the first broker in the world to allow Options Trading from TradingView's Trading Panel! Go check it out here!
Conclusion
As you finish learning about the Williams Alligator indicator, remember its role in spotting market trends and guiding your trading choices.
Using its signals in your strategy can boost your confidence and improve your trading outcomes.