Candlesticks are one of the oldest types of charts used for analyzing the market. They allow you to understand the high and low points of a stock at a glance. But the thing is, you need to know what is candlestick to make the best use of it while trading in any security. Read on to learn more.
What is Candlestick?
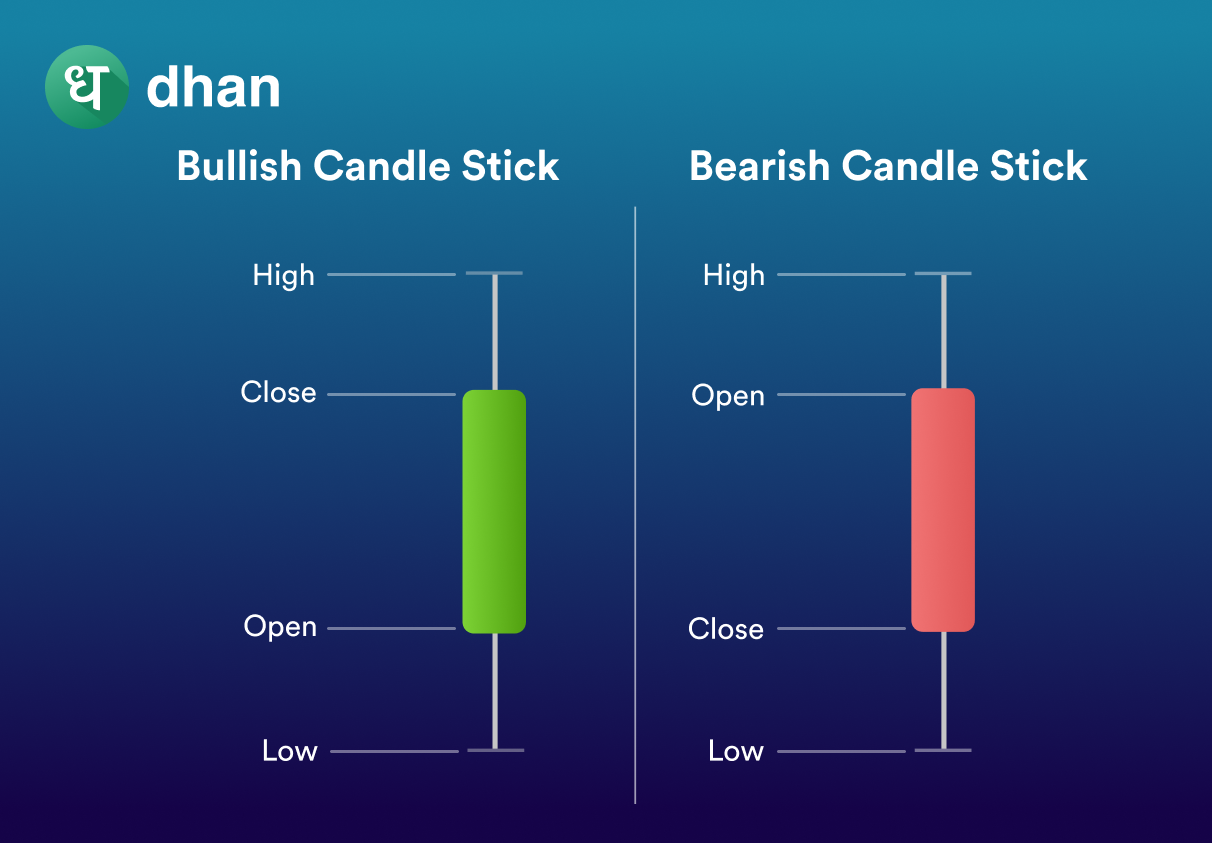
A candlestick is a visual representation of the price movement of a financial instrument over a specific period.
It is composed of four parts that depict the high, low, opening, and closing price of a financial instrument.
The body of the candlestick represents the difference between the open and close prices, while the wicks tell you the highest and lowest price of the security during that trading timeframe.
When someone says wick, they mean the thin straight lines that emerge out of the body of the candlestick. Check the image below to see the components of a candlestick.
How Does Candlestick Work?
Candlestick works by visually representing the price movements of a stock over a specified time period. Each candlestick provides information about the opening, closing, and high and low prices for that period.
Candlestick patterns are formed when a stock price goes up or down. The resulting pattern can help you analyze a bullish or bearish pattern. Bullish simply means positive while Bearish is used for negative.
Candlesticks come in different colors. The Green-Red combination from the image above is the most common type followed by White-Black.
Green (or White) denotes a positive change (Bullish) in the security’s price whereas Red (or Black) is used to represent a negative price change (Bearish).
When you combine a bunch of candlesticks on charts, you’ll be able to analyze the current price trend to determine where it is headed in the future.
The beauty of candlesticks is that they can be used for any timeframe. You can study the candlestick pattern for any time frame be it hourly, daily, weekly, etc.
<Custom Timeframe on Charts: Set your timeframes on tv.dhan.co to chart and trade as you want>
Structure of a Candlestick
The four parts of a candlestick are:
Body
If the candle’s real body is red or black, you can notice that the closing price of a stock is less than its opening price. If it is green or white, then it shows the opposite trend which is a bullish one.
Wick or Shadow
The wick or shadow in the candlestick is of two types: upper and lower. The upper shadow (or upper wick in candlestick) shows the highest price in a trading day or session. The lower shadow shows the lowest price of a stock.
High/Low
At the top of the upper shadow, the high price of a stock is indicated. The low price of a stock is shown at the bottom of the lower wick.
Open/Close
Open in candlestick means the opening price of a stock in a specified time frame. Close shows the closing price of a stock.
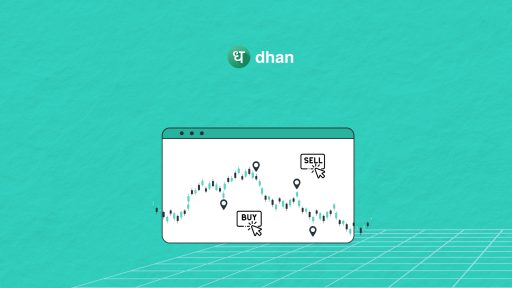
How to Read a Candlestick?
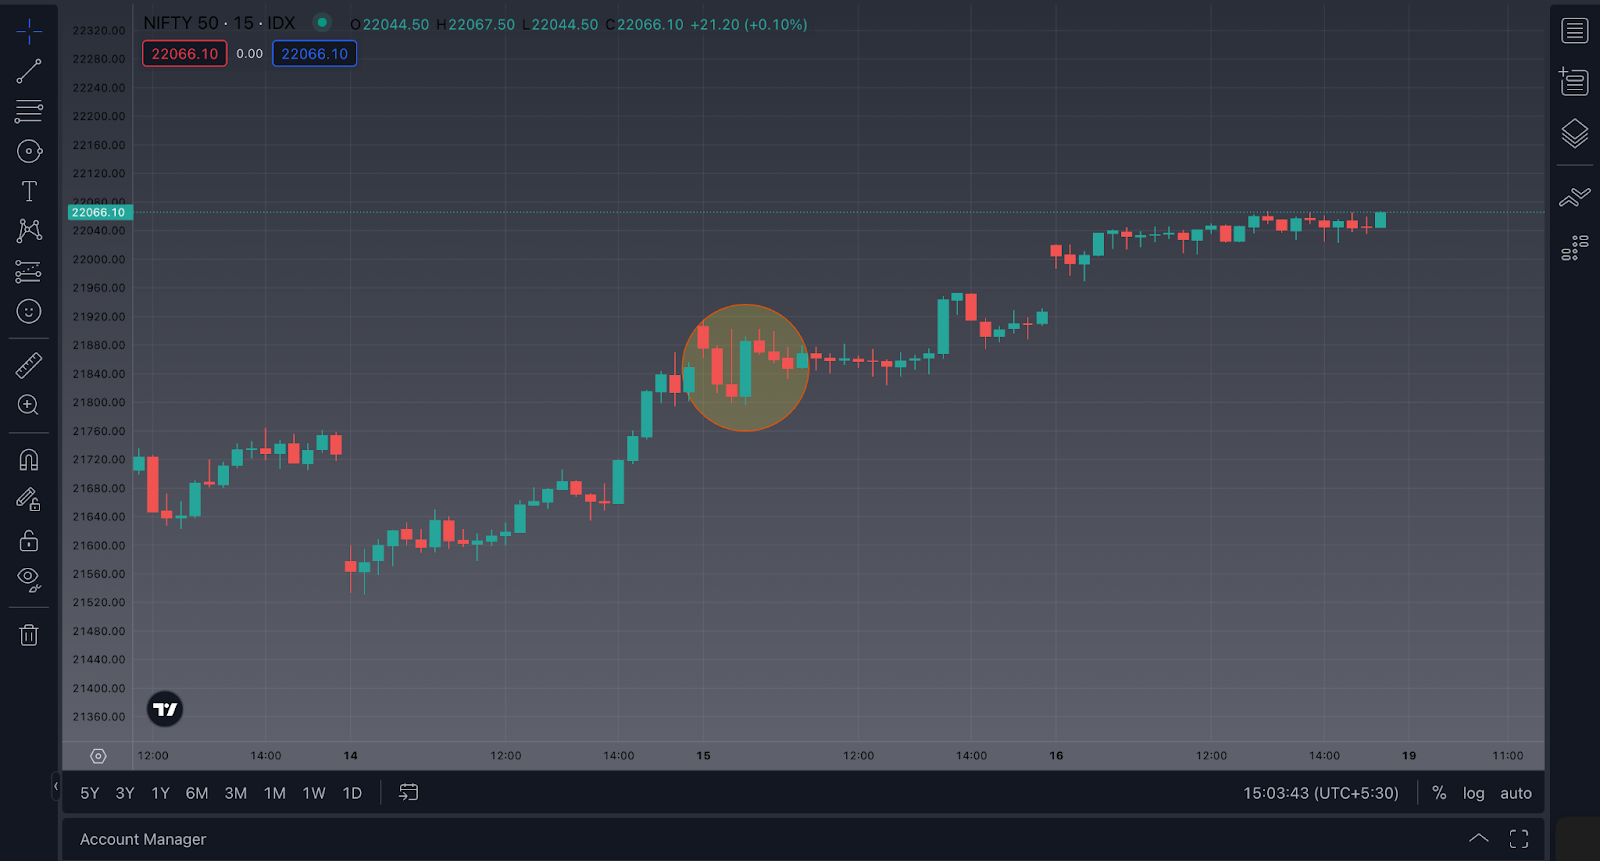
The image above shows you a candlestick chart for Nifty 50 on tv.dhan.co, with the timeframe set to 15 Minutes.
Each candlestick represents the movement of the index over a 15-minute time period. The large green candle in the middle of the highlighted circle indicates that Nifty 50 has gone up:
- Touching a high of 21,893
- Hitting a low of 21795
- Opening at 21,809
- Settling at 21,883
Are you a day trader? Then check out this awesome blog on How to Read Candlestick Charts for Day Trading!
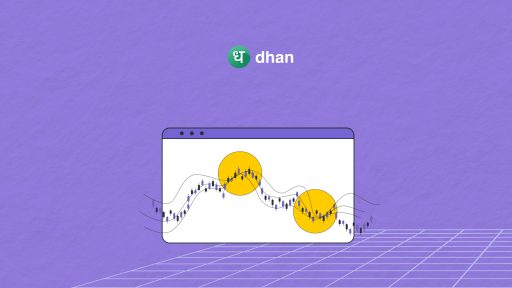
Types of Candlestick Patterns
There are two types of candlestick patterns – bullish patterns and bearish patterns. Here are some of the popular bullish and bearish candlestick patterns.
A. Bullish Patterns
- Bullish Harami: In Bullish Harami, the candle is red on the first day (large bearish trend) and it turns green (small bullish trend) on the second day with a small body. You can predict that on the third day, the bullish trend might appear.
- Bullish Engulfing Pattern: In this pattern, firstly a red candle is formed followed by a slightly bigger green candle. You can buy a stock when a green candle is formed and the price is at its lowest end.
- Hammer: It is a single candlestick created when the stock price is low and indicates a price rise. The green body is small but the lower shadow is long. You can buy a stock when the bullish candle is formed.
Bearish Patterns
- Bearish Harami: Bearish Harami arises when on the first day a large bullish candle (green) is created and on the second day, a smaller bearish candle (red) is created. You can take the short position after this pattern is over.
- Bearish Engulfing Pattern: In this candlestick, a green candle on the first day and a bigger red candle on the second day are created. You can sell a stock when the price is at the highest.
- Hanging Man: It is formed as a small red candle with a lower shadow and indicates a bearish trend. You can take the short position if a bearish pattern is created on the next day.
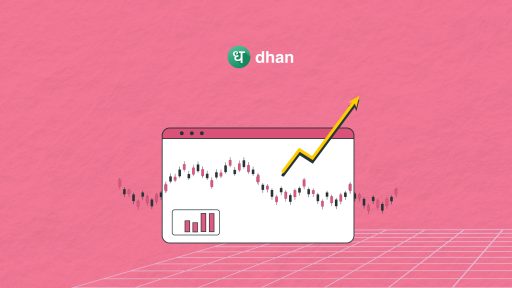
Importance of Candlesticks
Charting is the default go-to tool for many traders, and because candlesticks play a vital role in charting, it’s not a stretch to exclaim that they are pretty important.
Candlesticks provide valuable insights into market sentiment, depicting whether buyers or sellers are in control.
Understanding candlestick patterns can help you anticipate potential price reversals or continuations.
This is what helps you determine your entry-exit points. Couple candlesticks with technical indicators and you have a recipe for trading like a pro.
Finally, the versatility of candlesticks allows for analysis across various timeframes, from scalping to long-term charts.
Should You Rely on Candlesticks?
After understanding what is candlestick in trading, it is clear that you can depend on candlesticks to understand past price trends.
You can analyze the sentiments of buyers and sellers on a specific stock through which you can take the best position.
However, it is wise to use candlestick patterns along with other indicators to increase the accuracy of your trades.
Conclusion
Candlesticks show the high, low, opening and closing price of a stock and you can predict the future price movement based on the data points.
The green body means a bullish trend in stock and the red-colored body shows a bearish or a falling price trend.
Based on your risk tolerance levels and understanding, you can use candlestick chart patterns in your trading.
FAQs
Q. What is candlestick in trading?
Candlesticks include green or red candle-like formations on charts that show a stock’s price for a specific time period. It shows the current trend and helps you identify profitable opportunities.
Q. How to read a candlestick?
You can read the high, low, opening and closing prices of a stock using a candlestick. You can check the body of the candle to analyze the stock price trend whether it is bullish or bearish.
Q. What was the candlestick used for?
Candlestick was used in the 18th century in Japan to analyze how the prices of rice were moving in the market.
Q. What are the 4 parts of a candlestick?
The parts of a candlestick are: body, shadow (upper or lower), high/low price and open/close price.