



5-minute Gold Trading Strategy






Key takeaways
- The 5-minute gold trading strategy is an intraday trading strategy. It incorporates a variety of indicators such as EMA, MACD, and RSI.
- The Gold Mini (GOLDM) contract is a 100-gram lot size contract, which is popular among retail traders who prefer to trade in the short term and do not have a large capital base.
- The gold price is dependent on both domestic and global factors. It is also influenced by the USD/INR exchange rate.
- The evening session witnesses high trading activity in gold with a 5-minute trading strategy as the global market is open.
- A long trade signal occurs when EMA 9 crosses above EMA 21, the MACD line moves above the signal line, and RSI is above 50 and trending upward. The reverse combination produces a short signal.
Gold is one of the most traded commodities on the Multi Commodity Exchange (MCX) and holds a unique place in the Indian trading landscape. Unlike other commodities, the price of gold is not only influenced by domestic factors but also by global factors. It experiences frequent short-term price fluctuations that can be capitalised on by employing a 5-minute strategy.
The 5-minute gold trading strategy uses multiple technical indicators in combination to identify potential entry and exit points within short timeframes. In this blog, we explore this strategy and how to apply it to MCX gold contracts.
What is the 5-minute Gold Trading Strategy?
The 5-minute gold trading strategy is a type of intraday scalping strategy in which each candle on the chart represents five minutes of price action in gold prices. The strategy combines several indicators, such as the Exponential Moving Average (EMA), Moving Average Convergence Divergence (MACD), and Relative Strength Index (RSI), to determine momentum direction, confirm its strength, and filter out weak or false signals before entering a trade.
Here, each indicator measures a different aspect of price behaviour. When used together, they offer a more comprehensive picture of the market condition than any one indicator alone.
Gold contracts specifications on MCX
Before applying any strategy, it is important to understand the instrument you are trading. Gold is mostly traded on the Multi Commodity Exchange of India (MCX), through standardised futures contracts. MCX offers five gold contracts:
The Gold Mini (GOLDM) contract is a popular choice among retail traders employing a 5-minute gold trading strategy. It has a lot size of 100 grams, and its margin requirements are a minimum of 6% or based on SPAN, whichever is higher, providing traders significant gold exposure with relatively low initial capital requirements. On MCX, traders can trade gold from 9:00 AM to 11:30 PM IST on weekdays (11:55 PM IST when US daylight saving time is not in effect).
How does each indicator work?
Here is what each indicator measures and how they are set up:
Exponential Moving Average (EMA)
The Exponential Moving Average gives more weight to recent price data compared to a simple moving average, making it more responsive to current price movements. In the 5-minute gold trading strategy, two commonly used EMAs are:
- EMA 9 (fast-moving average): It provides entry signals and tracks recent short-term price action.
- EMA 21 (slow- moving average): It tracks the broader trend and serves as the confirmation baseline.
If EMA 9 crosses above EMA 21, it means that the short-term momentum has turned bullish. The bias is bearish when EMA 9 crosses below EMA 21.
MACD (Moving Average Convergence Divergence)
MACD is a trend-following momentum indicator that shows the relationship between two EMAs. The default parameters for this strategy are 12, 26, and 9.
- The MACD line is the difference between the 12-period EMA and the 26-period EMA.
- The signal line is the 9-period EMA of the MACD line.
- When the MACD line crosses above the signal line, momentum is turning positive. When it crosses below, momentum is turning negative.
MACD provides the momentum confirmation that the EMA crossover alone cannot offer. Sometimes an EMA crossover occurs during a short consolidation period, and there may be no momentum behind it. Thus, MACD helps determine whether there is genuine strength behind the momentum or not.
RSI (Relative Strength Index)
The RSI, developed by J. Welles Wilder Jr. and published in his book New Concepts in Technical Trading Systems in 1978, measures the speed and magnitude of price changes on a scale of 0 to 100. For a 5-minute strategy, a common RSI setting is 14 periods.
If the RSI is above 50 and continues to climb, it signals dominant buying momentum. Conversely, a reading below 50 with a continuous decline indicates dominant selling pressure.
The RSI indicator helps traders avoid false EMA crossovers as well as avoid getting into a long trade when the overall momentum is still net negative, and vice versa.
When to enter buy and sell signals
In this strategy framework, a trade is considered only when the EMA crossover, MACD direction and RSI momentum support the same market bias. Entering on partial confirmation is one of the most common mistakes in 5-minute trading.
When all three conditions align on the same 5-minute candle or within one to two candles of each other, the signal is considered actionable. If one of the three indicators is not confirmed, then traders often skip the trade and wait for the next opportunity.
How to set up stop-loss and target rules
Here is how traders can set stop-loss and target rules:
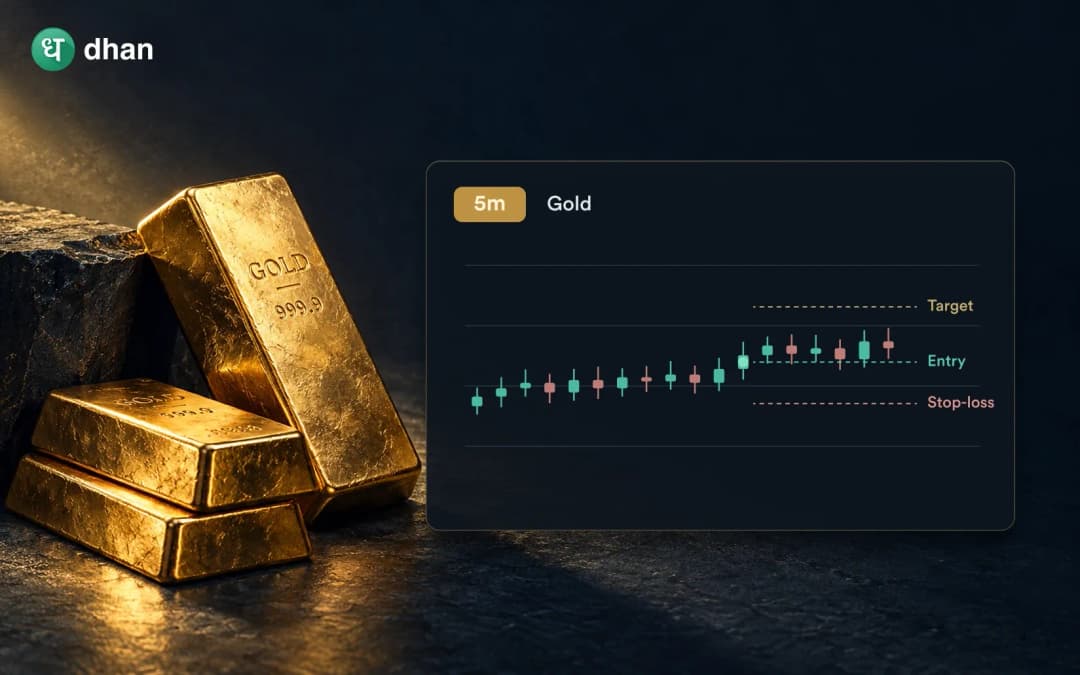
- In a long trade, set the stop loss below the most recent swing low before entering the trade.
- For a short trade, set it above the most recent swing high.
- A trader may use a minimum risk-to-reward ratio of 1:2, where their potential gain is at least 2 times the amount they are risking.
Common mistakes in 5-minute Gold Trading
These are the mistakes that most traders make while using 5-minute gold trading strategies:
- Trading on partial signals: Entering trades based on one or two indicators without waiting for all three often leads to losses.
- Ignoring the higher time frame: Before trading the smaller time frame, traders should always check the bigger time frame. If the 15-minute or 30-minute chart shows a strong downtrend, traders should avoid the bullish signals on the 5-minute chart.
- Overtrading: Gold trading on MCX runs for over 14 hours a day. The long trading session can provide many opportunities, but it can also encourage excessive trading. It is better to place a limited number of trades per session, especially during the active evening hours, rather than chasing every signal.
- Trading during major economic events: Major economic events such as US CPI releases, FOMC decisions and Non-Farm Payroll data can cause rapid price movements and higher volatility. In such conditions, stop-loss orders may be executed at prices different from the intended level because of slippage.
- Widening stop-losses after entry: Once a trade is live, don't move the stop-loss further away from the entry to give the position more room. That defeats the purpose of having a defined risk. If the trade isn't performing, exit it.
The bottom line
The 5-minute gold trading strategy is based on a simple concept: trade only when trend, momentum, and relative strength point in the same direction. The EMA crossover is used to spot the trend, MACD is used to confirm the momentum, and RSI is used to ensure that the trader is not entering a move when it is already stretched.
However, success in 5-minute gold trading doesn't come from trying to predict every move; it comes from staying disciplined, following a plan, managing risk, and avoiding emotional decisions.
FAQs
Should I hold a 5-minute strategy trade overnight?
The 5-minute gold trading strategy is often used for intraday trading/scalping. Overnight positions carry sharp price gaps, volatility and slippage risk, as the market may open much higher or lower the next day based on overnight international news, which can cause significant losses in existing positions.
How much capital do I need to trade this strategy on Gold Mini?
It depends on the gold price and your broker's margin. MCX sets a minimum margin of 6% of the contract value or the SPAN-based margin, whichever is higher. If Gold Mini trades at ₹1,50,000 per 10 grams, one 100-gram lot is worth ₹15 lakh and needs at least ₹90,000 as margin. Traders with less capital can start with Gold Ten or Gold Petal.
What is a Whipsaw in a 5-minute trading strategy?
A whipsaw is a rapid reversal in price that causes a trading signal to fail. For example, an EMA crossover may initially trigger a bullish signal, but price can quickly reverse and invalidate the setup. Whipsaws are particularly common when the market lacks a clear trend.
What is the best time to trade gold on MCX?
There is no universally best time to trade gold contracts on MCX. However, the gold market often sees higher activity in the evening session, which overlaps with the opening of the US markets and major economic data releases.
Does the USD/INR exchange rate affect 5-minute gold trading on MCX?
Yes, and it's a crucial factor to take into account. The underlying global gold benchmark prices gold in US Dollars, while MCX gold prices are quoted in Rupees, making them directly vulnerable to the USD/INR exchange rate. When the Rupee moves sharply against the Dollar, it affects the MCX gold prices even if there is no change in global gold spot prices.