



Introducing At-The-Money IV Charts on Options Trader





Key takeaways:
- The ATM IV Chart automatically tracks the ATM strike as the underlying moves; you do not need to switch strikes manually.
- You can analyse ATM IV across 1-minute, 5-minute, 15-minute, 30-minute, 60-minute and 1 Day timeframes.
- You see ATM IV plotted alongside the underlying spot price in the same view.
- You have access to up to 45 days of historical ATM IV data to study past volatility behaviour.
- The chart refreshes live throughout the session with no need to manually reload the page.
When you track implied volatility during an options trade, the strike you are monitoring can stop being at-the-money as soon as the underlying price moves. You then need to find the new ATM strike, check its IV and compare it with the previous reading.
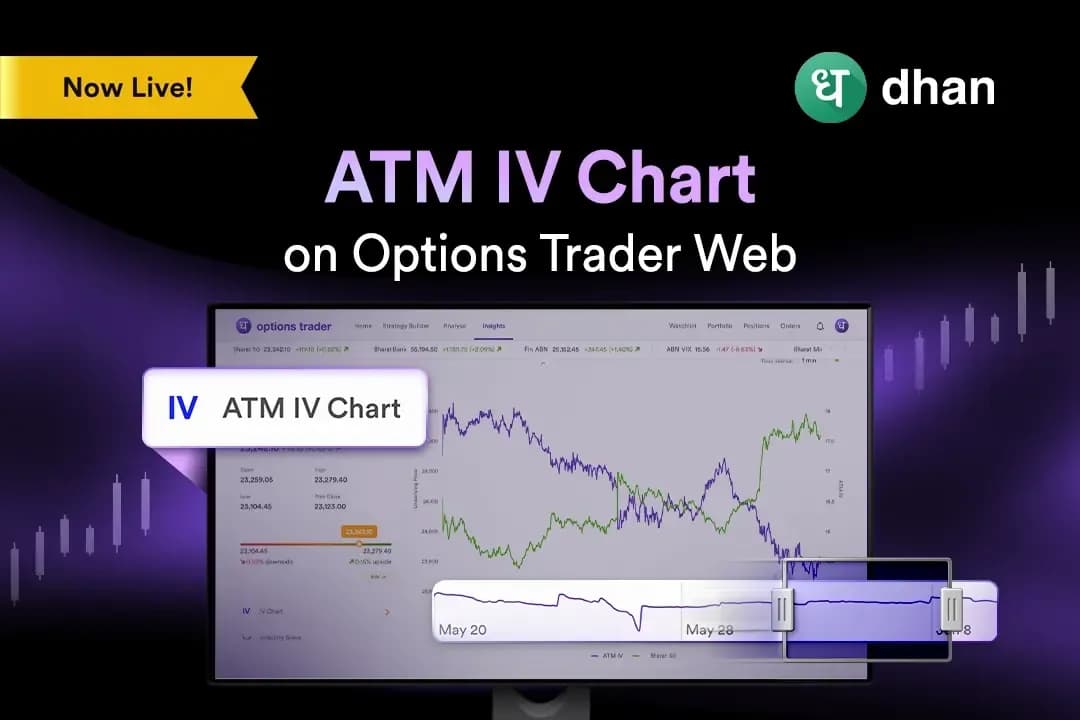
We built the At-The-Money IV Chart on Options Trader to solve this problem. It automatically tracks the current ATM strike and displays its implied volatility alongside the underlying spot price, giving you a continuous view of volatility as the market moves.
What is the At-The-Money IV Chart?
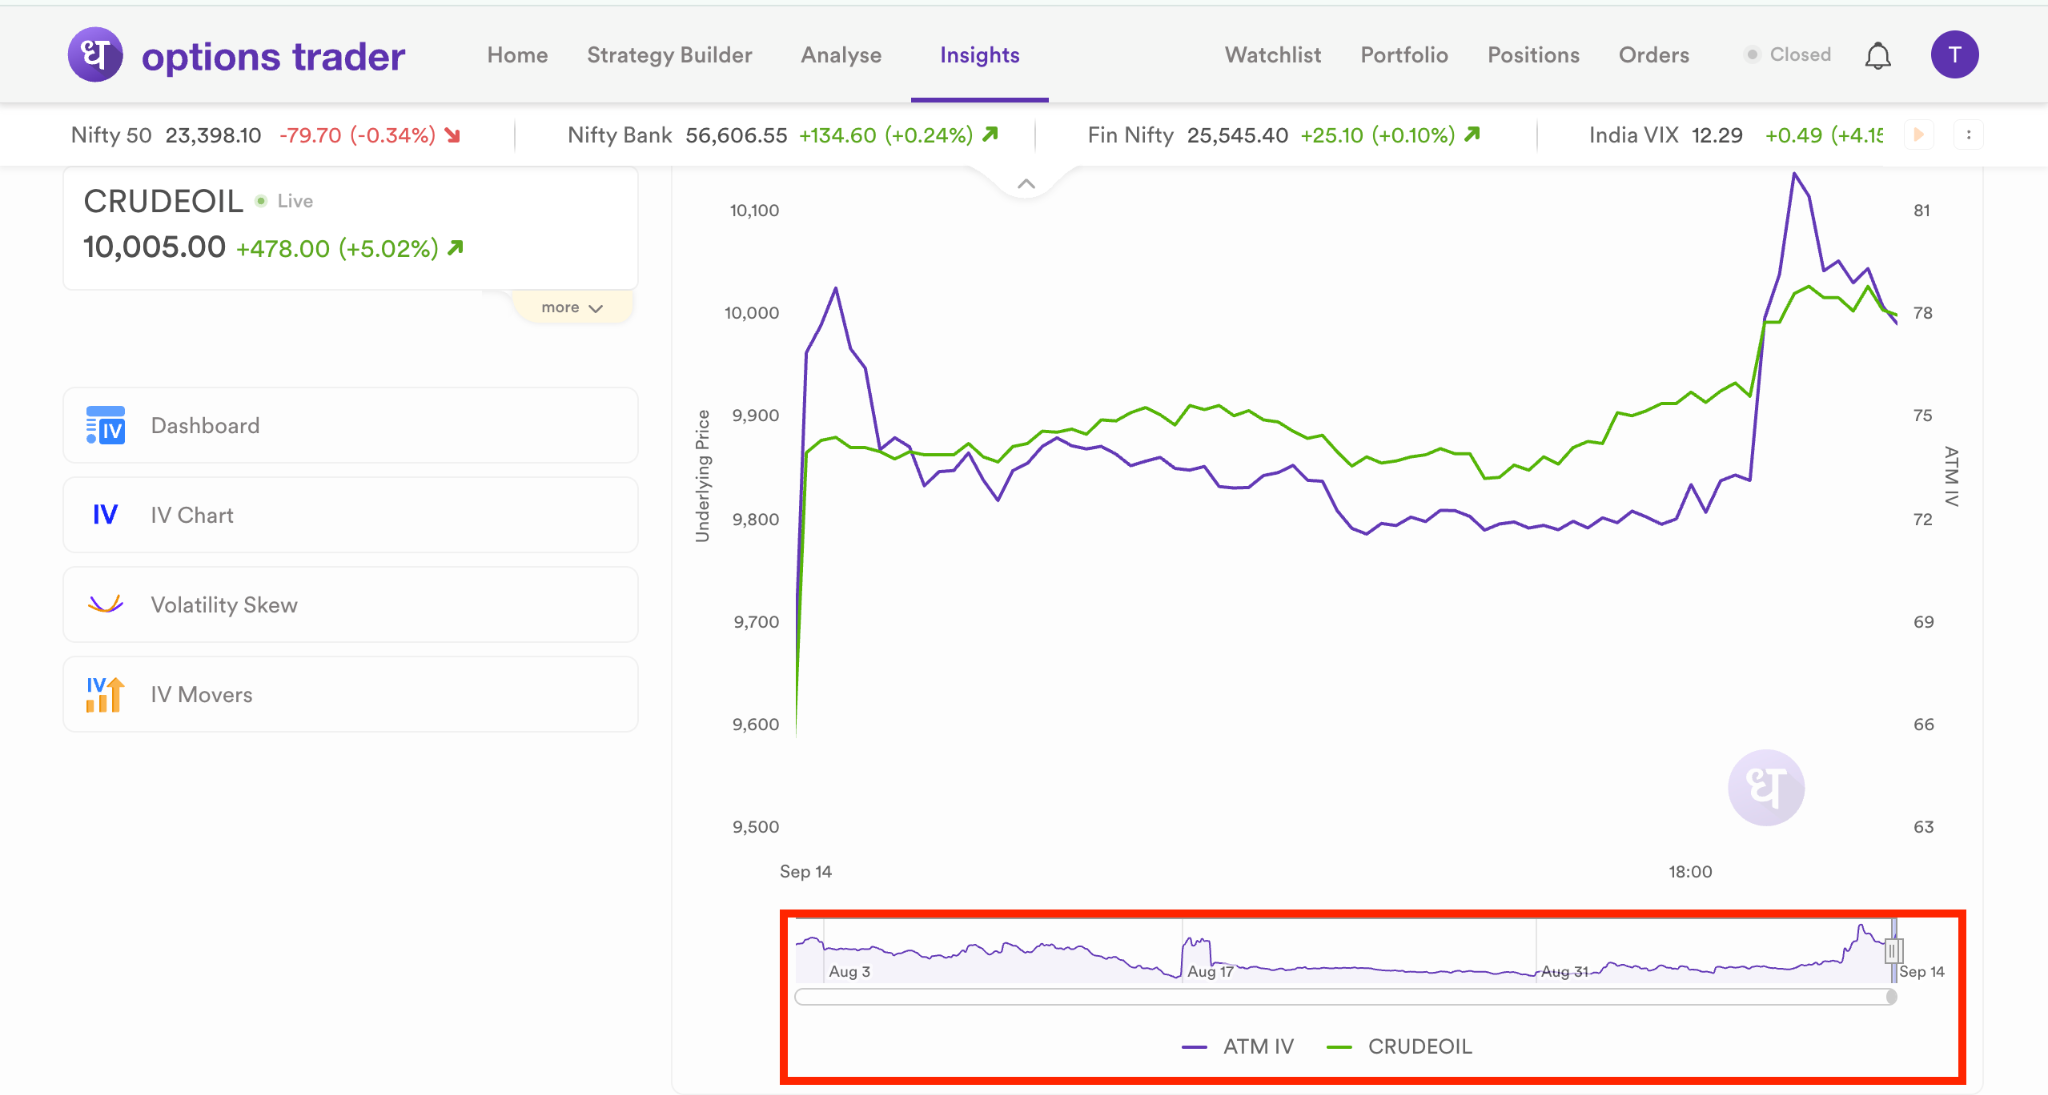
It plots ATM IV alongside the underlying spot price, helping you view price and volatility together without manually switching between strikes.
Implied volatility reflects the movement that the options market is pricing in. It does not indicate whether the underlying will rise or fall. Instead, it reflects the expected magnitude of future movement based on current option prices. The feature exists to give you a continuous view of ATM IV without requiring you to move manually between different strikes on the option chain.
Why does it matter?
Tracking implied volatility is an important part of options analysis. When the underlying moves through several strike levels, the ATM strike can change frequently, making manual monitoring cumbersome. We built the ATM IV Chart to solve three specific problems.
To keep your ATM IV view continuous
When the spot price moves, the ATM IV chart automatically identifies the relevant ATM strike and updates the chart. You do not need to search for each new strike separately. This helps you study the volatility trend across the session instead of collecting separate IV readings from different strikes.
Offers recent history
The ATM IV chart provides up to 45 days of backdated data. You can use it to review earlier expiry sessions, event-driven moves and periods of changing market activity. This lets you compare the current ATM IV trend with recent market behaviour instead of viewing the live reading in isolation.
Show implied volatility with price context
An IV reading becomes more meaningful when you view it alongside the movement of the underlying. IV may rise while the spot price moves sharply, fall as the market settles or change while the underlying remains within a range. The ATM IV chart displays ATM IV and the underlying spot price together. This allows you to observe how the options market is pricing movement as the spot price changes.
How does it work?
Using the ATM IV Chart involves the following steps.
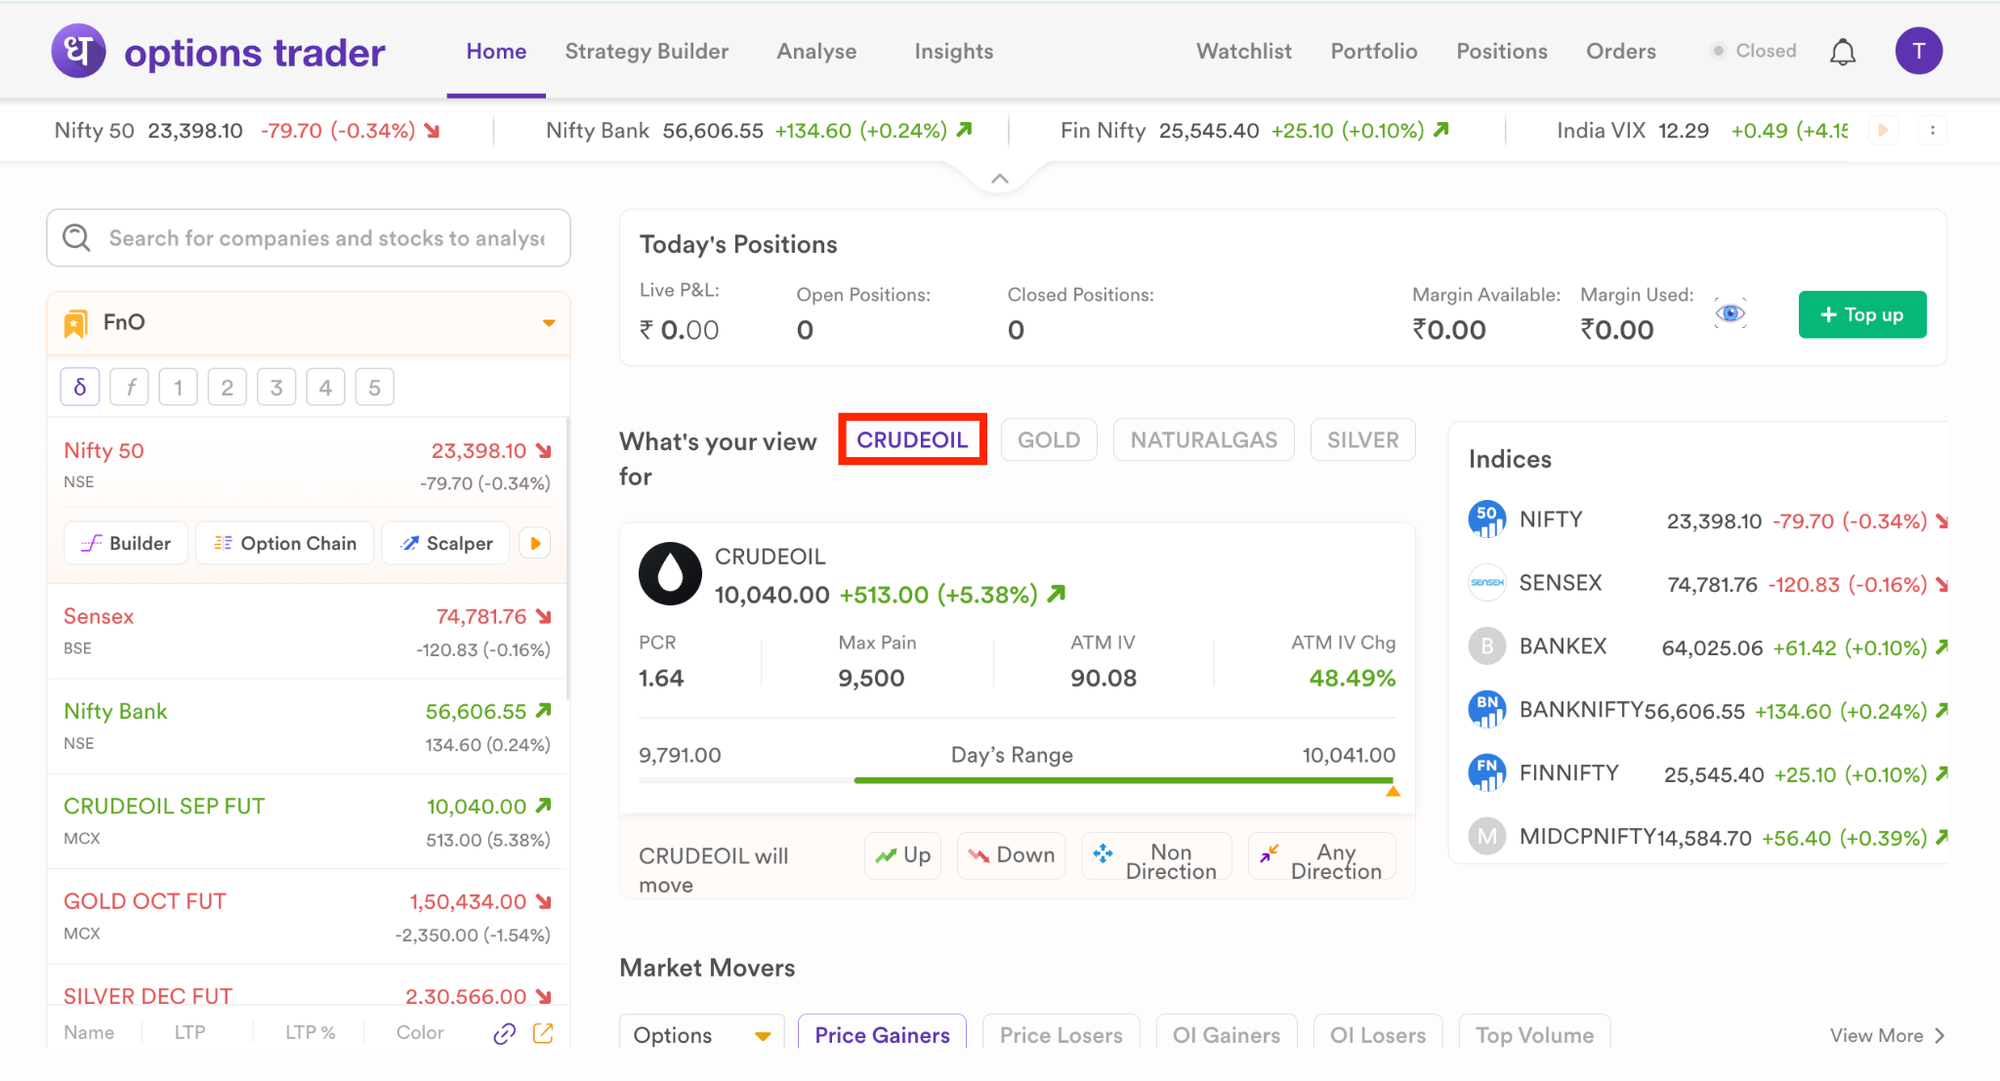
Step 1: Open Options Trader Web at options-trader.dhan.co and select the underlying you want to track.
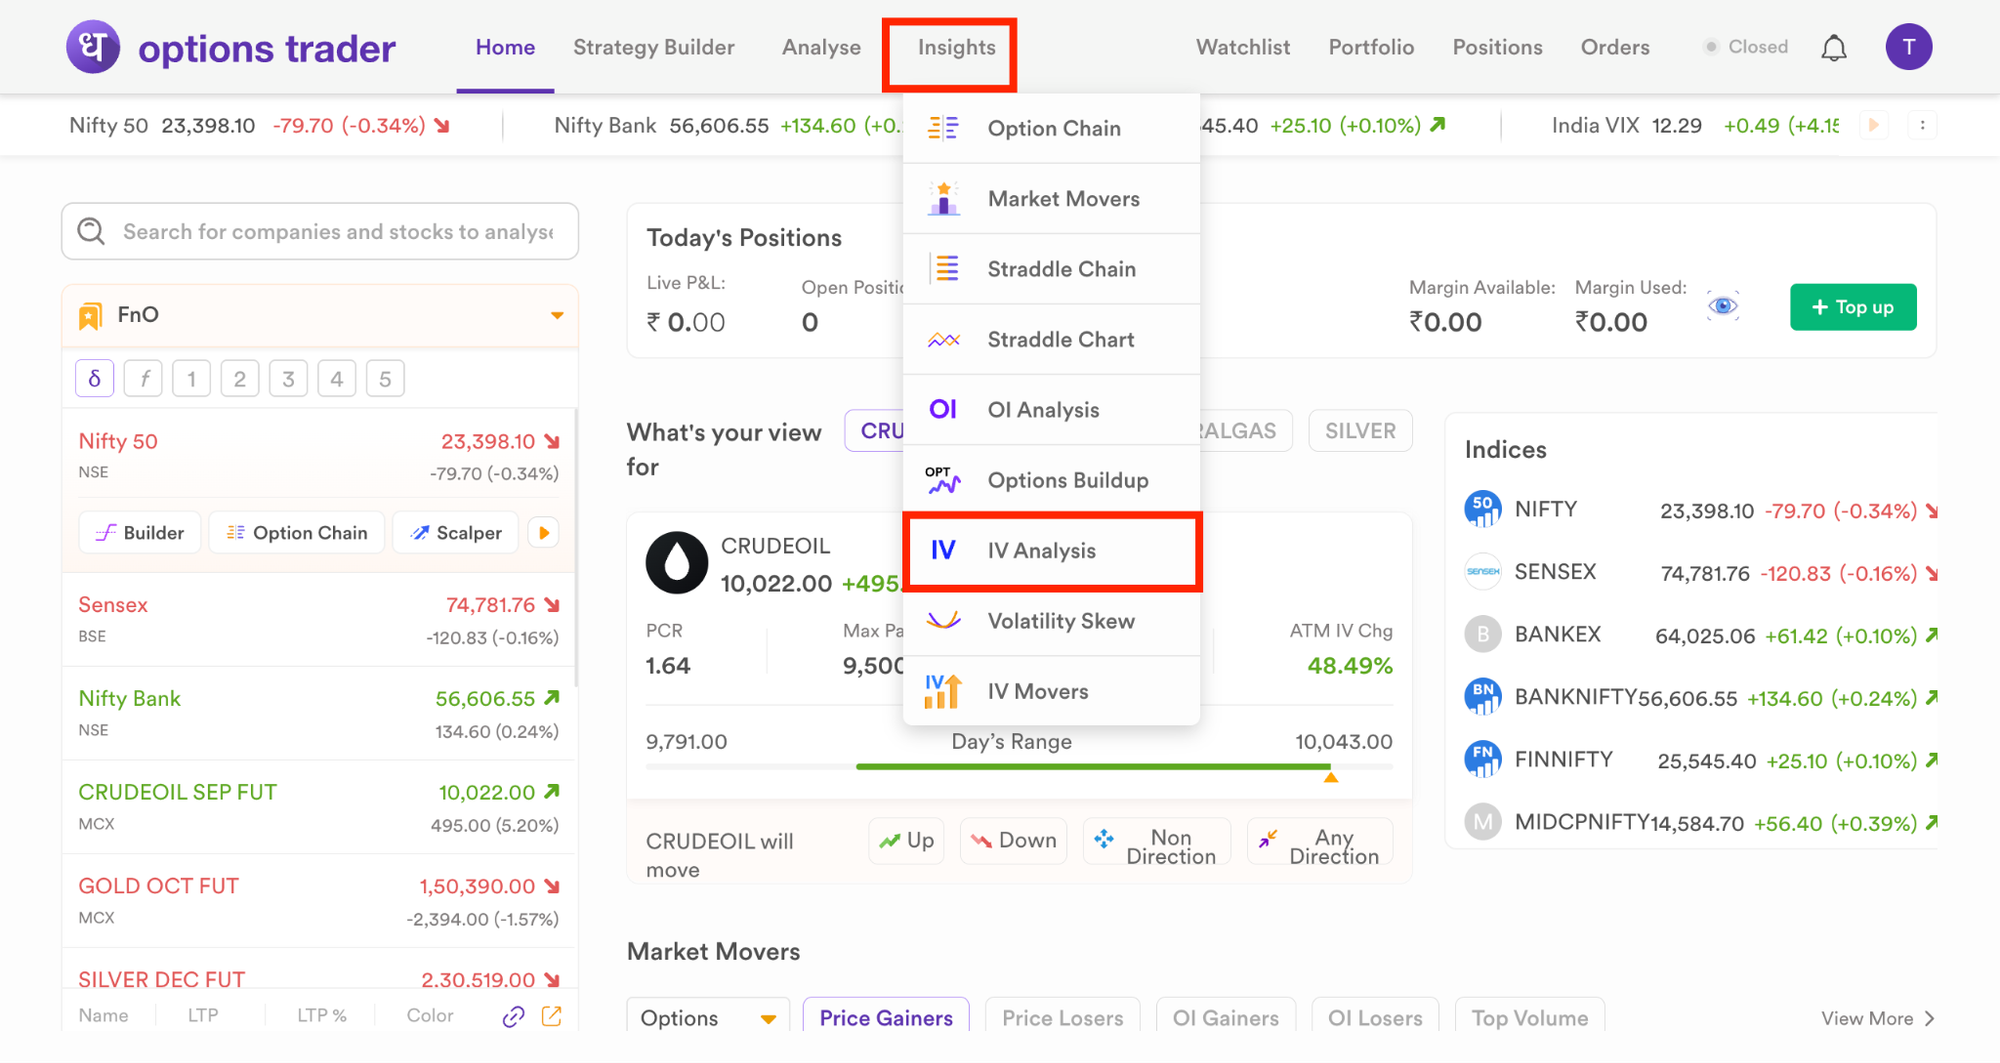
Step 2: Go to Insights and select the IV Analysis.
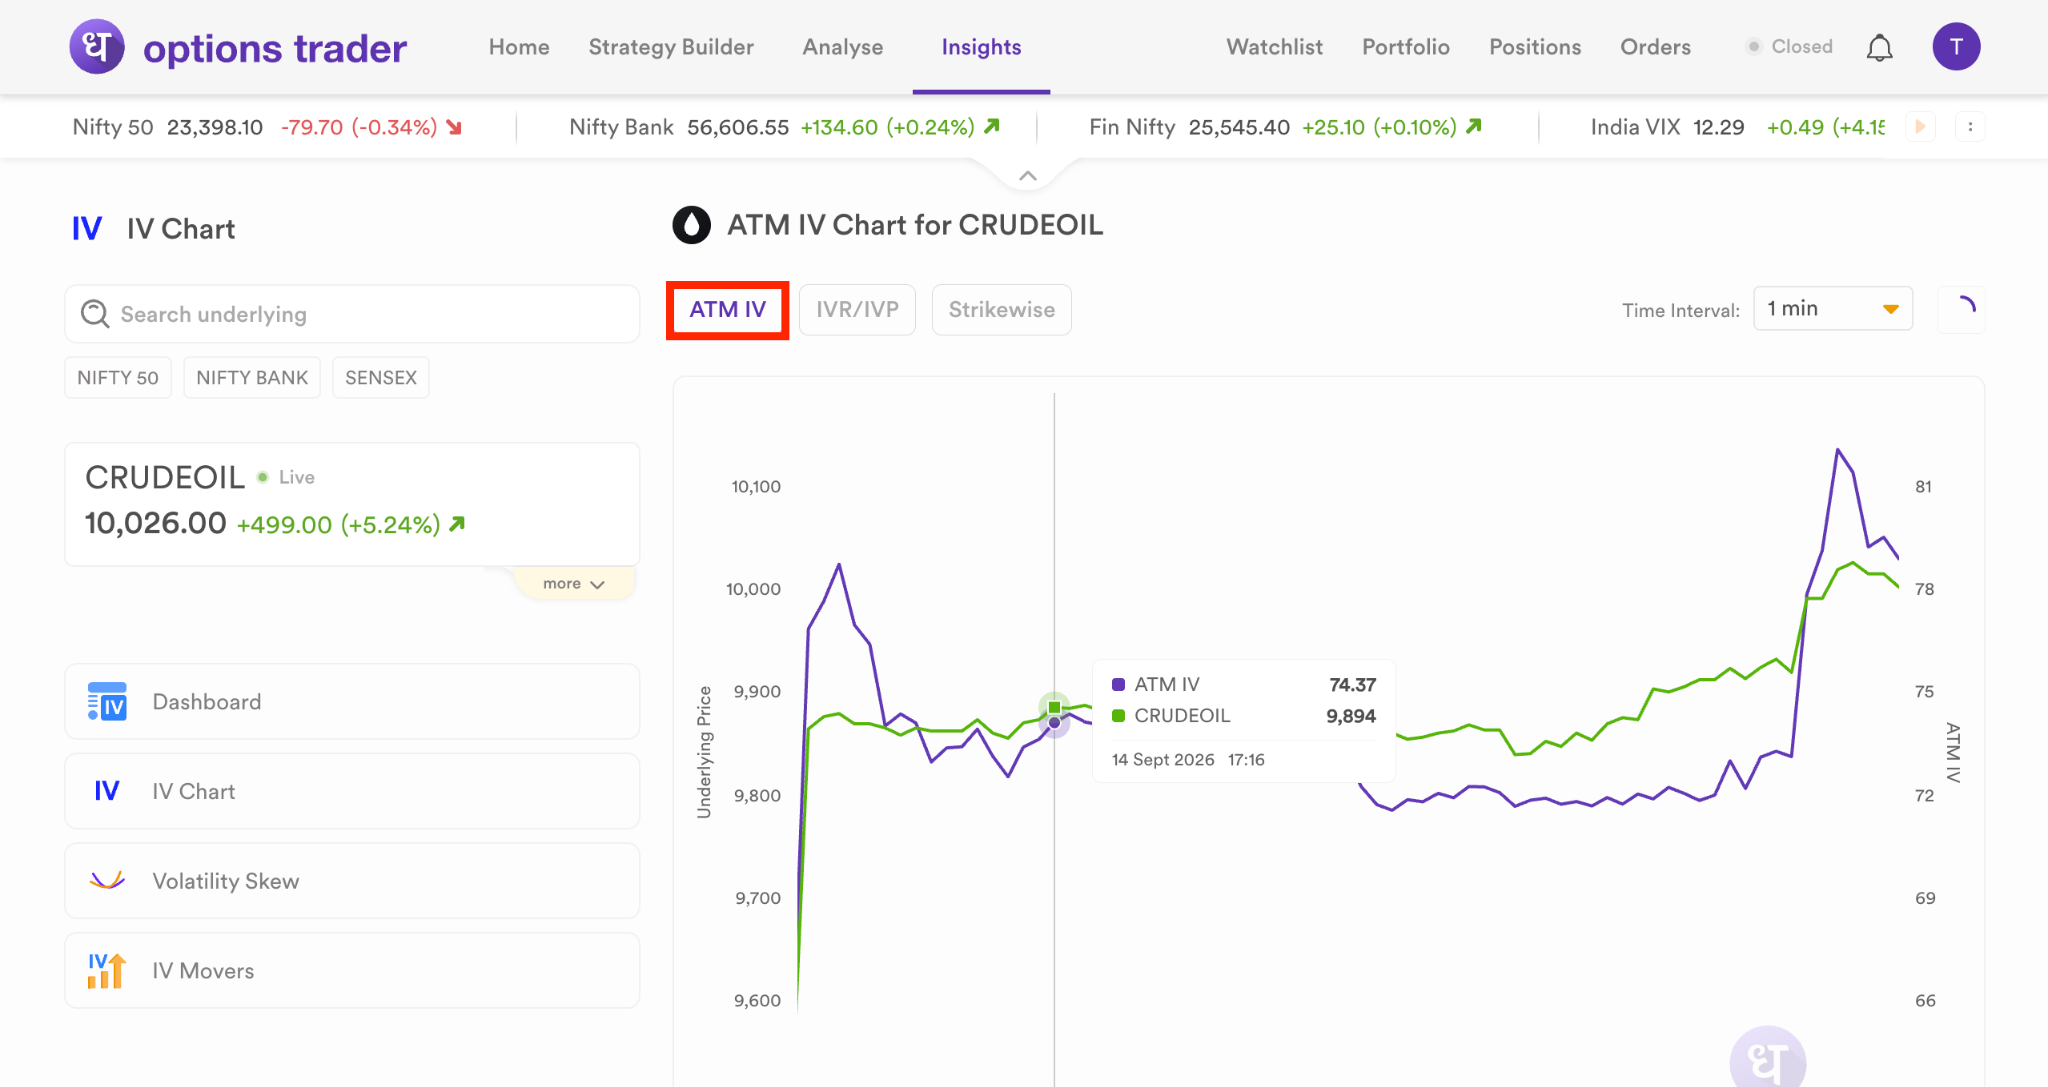
Step 3: Then select the ATM IV Chart from the three available tabs.
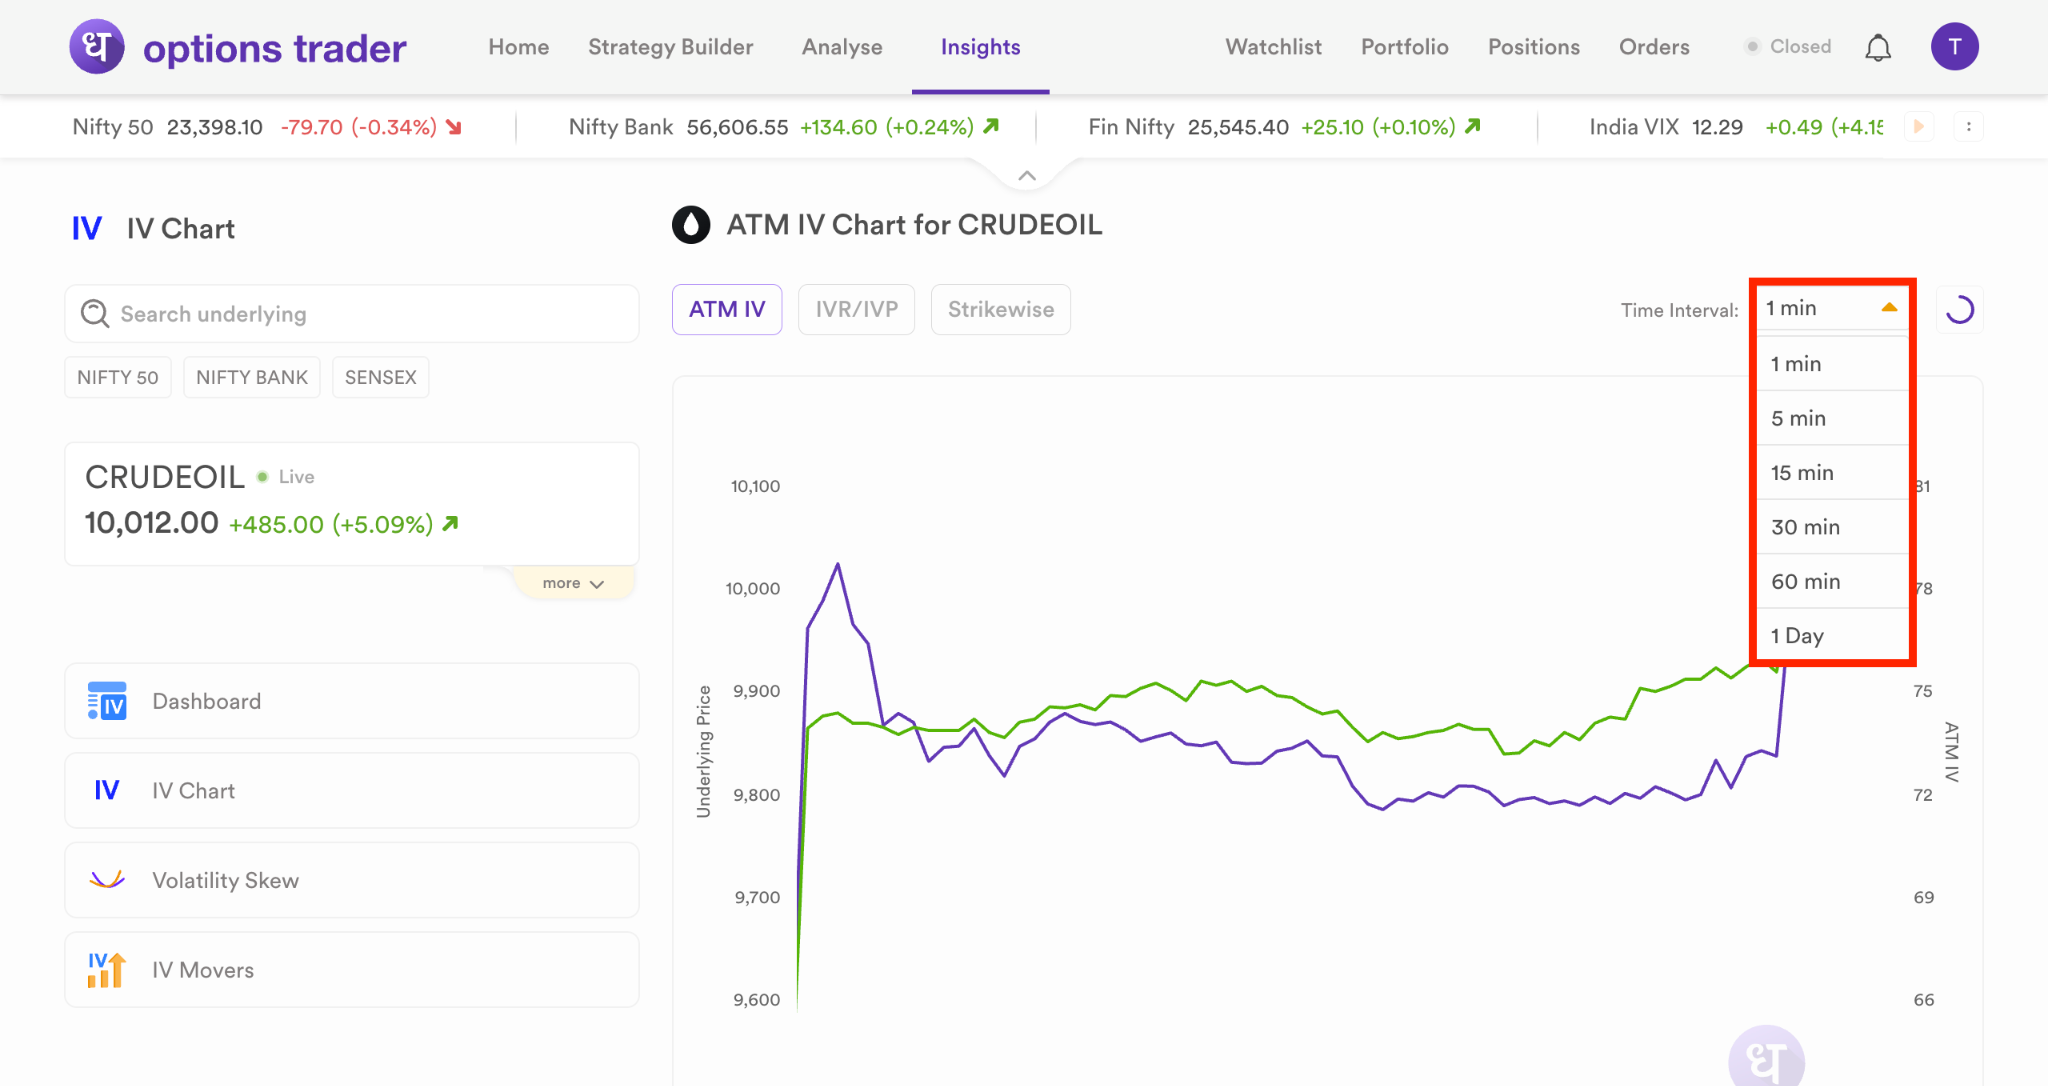
Step 4: Choose the timeframe from 1-minute, 5-minute, 15-minute, 30-minute, 60-minute and 1 Day to view how volatility has shaped up through the session.
Step 5: Now you can read ATM IV against the underlying spot price in the same frame. You can also switch to the historical view to study up to 45 days of past ATM IV data across any of the available timeframes through the slider available below the chart.
Key benefits of the ATM IV Chart
By translating raw volatility data into a visual format, this feature delivers several benefits like:
- Automatic tracking: The ATM IV chart follows the ATM strike as the underlying moves, so your IV view stays continuous through the session without any manual effort from you.
- Live and historical in one place: You get today's live ATM IV alongside up to 45 days of history, so you can benchmark what you are seeing against past sessions.
- Price-volatility overlay: You see spot price and ATM IV together in the same chart frame, so you can read the relationship between the two as it develops.
- Flexible timeframes: You can use shorter timeframes to study intraday changes and longer timeframes to review the broader volatility movement during the session.
Use cases
Here is how you can deploy the ATM IV Chart in your trading scenarios:
The expiry-day trader
On expiry day, the underlying can move through multiple strikes within a short period. The ATM strike may change several times during the session. With the ATM IV Chart, you can follow the relevant IV movement without manually opening each new strike. This helps you observe whether volatility is expanding or contracting as the expiry session develops.
The event-based trader
Before a major economic announcement or policy event, you may want to understand how the options market is pricing expected movement. You can monitor the live ATM IV and compare it with historical readings from recent sessions. This gives you a reference point for gauging current volatility against previous ones.
The strategy-review trader
After using a spread, straddle or another multi-leg strategy, you can review the ATM IV Chart alongside the underlying price. This can help you examine whether the position was affected mainly by movement in the underlying, a change in implied volatility or a combination of both.
Conclusion
We built the At-The-Money IV Chart on Options Trader Web to give you a continuous view of implied volatility as the underlying spot price moves. It automatically tracks the relevant ATM strike, displays IV alongside price, refreshes live, supports multiple timeframes and provides up to 45 days of historical data.
You can access it through Options Trader Web → Insights → IV Chart. The feature brings live and historical volatility information into one view, solving the challenge of manually switching between strikes to follow ATM IV throughout the trading session.