



Introducing Relative Cycle Graph on DEXT T3







Key takeaways:
- The Relative Cycle Graph maps multiple stocks or sectors against a selected benchmark.
- It shows the relative strength trend on the X-axis and the relative strength momentum on the Y-axis.
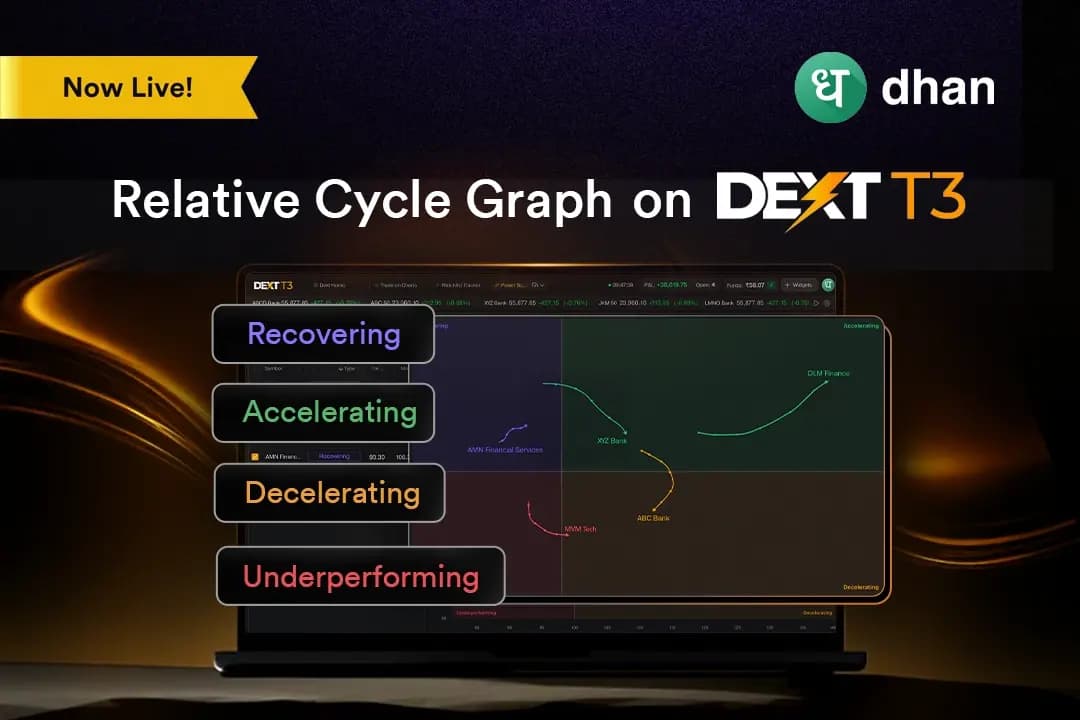
- The graph uses four quadrants: Accelerating, Decelerating, Recovering, and Underperforming, to show the current relative rotation phase of each symbol.
Tracking sector or stock rotation often requires opening several charts and comparing them individually. The challenge is not always reading the market incorrectly. Often, it is seeing relative strength and momentum only after they become visible on separate charts.
For this, we have introduced the Relative Cycle Graph on DEXT T3. This feature addresses the visibility problem by putting the symbols being tracked on a single canvas. Instead of viewing each chart separately, you can see where symbols stand relative to a chosen benchmark and the direction in which their relative strength is moving.
What is the Relative Cycle Graph?
The Relative Cycle Graph is a relative-performance analysis widget on DEXT T3. It maps each selected symbol against a benchmark using two measures: Strength Trend and Strength Momentum.
Strength Trend forms the X-axis and indicates whether a symbol is stronger or weaker than the benchmark on a sustained basis. Strength Momentum forms the Y-axis and shows whether that relative strength is accelerating or decelerating.
Thus, instead of opening separate charts for each stock or sector, you can plot them together on one canvas. The graph also leaves a visible trail, or tail, for each symbol. This shows where the symbol has been and the direction of its recent rotation.
The graph is divided into four quadrants that describe the current phase of relative rotation, including accelerating, decelerating, recovering, and underperforming quadrants.
Why this feature matters
The importance of this feature can be understood with the following points:
See relative strength on one canvas
Every selected symbol appears on the same graph against the chosen benchmark. For example, if a stock has risen 2% while the benchmark has risen by 5%, it’s termed as underperforming, despite having its own price going up.
Follow the direction, not just the position
The tail shows the recent path of each symbol. A symbol in Recovering can have a different context depending on whether its tail is moving toward Accelerating or toward Underperforming.
It adapts to the market environment
Market conditions do not remain constant. The Relative Cycle Graph on DEXT T3 uses a Weighted Moving Average for Strength Trend, giving greater importance to recent data while maintaining a smoother view. So, you do not need to adjust these calculations manually. The graph adapts to the prevailing environment.
How the Relative Cycle Graph works
To use the Relative Cycle Graph feature, follow the procedure below:
- Log in with your Dhan login ID on the Dext platform (https://dext.dhan.co/login).
- Include the Relative Cycle Graph widget in your workplace.
- Select the symbols and the benchmark you want to analyse. The Relative Cycle Graph can be used with sector indices, individual stocks, or combinations of both.
- Read the position of each symbol using the Strength Trend and Strength Momentum axis. Check which quadrant it occupies and how its tail is moving.
- Adjust the tail length and timeframe according to the analysis. A benchmark strip chart at the top of the widget includes a draggable window that controls the period used to calculate the Relative Cycle Graph tail.
Key benefits of this feature
Relative Cycle Graph offers the following key benefits:
- Symbols can be compared against a selected benchmark rather than being viewed only through their individual price movements.
- The four quadrants provide a structured way to identify whether symbols are accelerating, decelerating, recovering, or underperforming.
- The tail shows the recent path of a symbol, adding direction and movement context to its current quadrant.
- You can select sector indices, individual stocks, or combinations and adjust the timeframe and tail length.
Practical use cases
The following are some practical use cases of the Relative Cycle Graph on Dext T3.
Sector rotation analysis
You can select sector indices and compare their relative strength and momentum against a chosen benchmark to identify different stages of sector rotation. The Accelerating quadrant may show sectors with improving relative strength, while the Decelerating quadrant may show sectors that remain strong but are losing momentum. Recovering sectors can then be further evaluated for early signs of improvement.
Stock-selection
You have identified a sector that has moved into the Accelerating quadrant and want to examine the stocks within that sector. Add the sector index as the benchmark and plot its constituent stocks. The graph helps you compare which stocks are outperforming their own sector and which are lagging despite broader sector strength.
The swing or positional trader
You want to study how a group of stocks has rotated over several weeks. For this, you can select a weekly timeframe and use a longer tail to review the broader path. The graph helps you identify whether a stock has moved from Recovering to Accelerating, remained in Decelerating or continued towards Underperforming, and provides a structured starting point for further technical and fundamental analysis.
Conclusion
The Relative Cycle Graph on DEXT T3 provides a single view of how selected stocks or sectors are performing relative to a chosen benchmark. Earlier, this type of comparison required traders to examine individual charts and build the relative picture manually.
The Relative Cycle Graph fills the workflow gap of tracking relative strength and rotation across symbols through the integration of Strength Trend, Strength Momentum, four rotation quadrants, and a visible tail all on one canvas without relying on separate price charts.