



William Fractal Indicator





Key takeaways:
- The William Fractal indicator is a price-action tool developed by Bill Williams to identify potential swing highs and swing lows on a chart.
- A bullish fractal forms when a candle has two lower highs on either side, while a bearish fractal forms when a candle has two higher lows on either side.
- Fractals can help traders identify support, resistance and potential breakout levels, but they work best when combined with trend, volume and other technical analysis tools.
- A fractal is confirmed only after the required candles have formed, so it should not be treated as an instant entry signal.
- The indicator can be used across different markets and time frames, but its signals can become frequent and less reliable in choppy markets.
Technical traders often look for ways to identify important turning points without trying to predict every small price movement. The William Fractal indicator is one such tool. It focuses on the structure of price candles to highlight potential swing highs and lows.
Developed by trader and author Bill Williams, the fractal indicator is based on a simple idea: certain candle formations can show where price temporarily changed direction. These points can then be used to identify potential support and resistance or to monitor possible breakouts.
What is the William Fractal indicator?
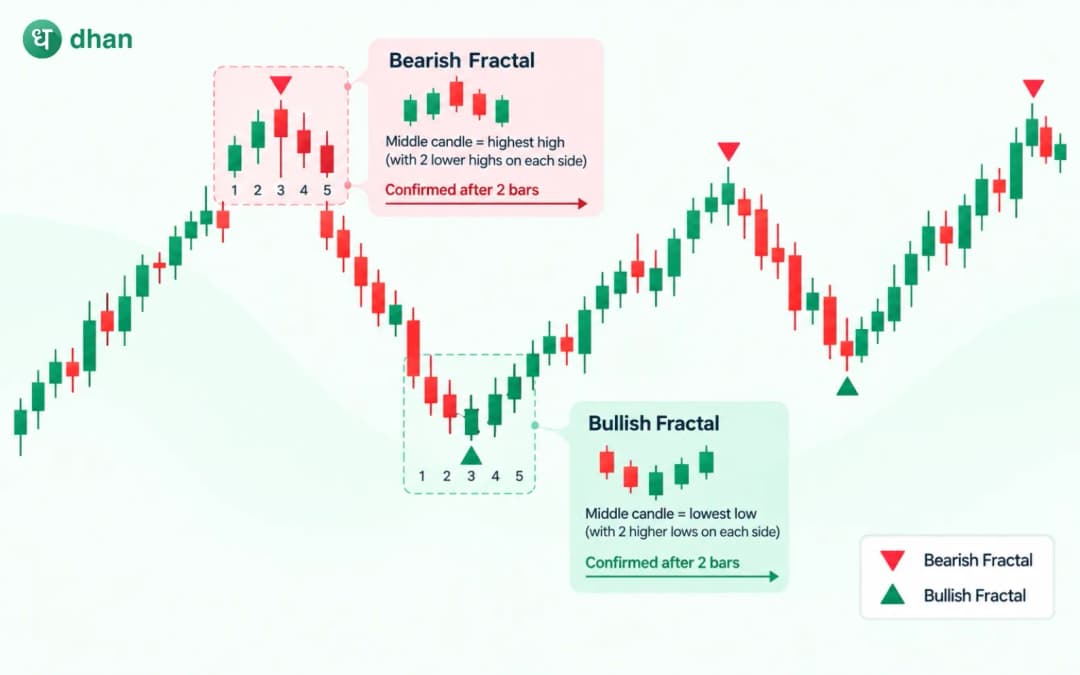
The William Fractal indicator identifies local highs and lows using a five-candle formation. A fractal is formed around a central candle, with two candles on either side used to compare the surrounding highs and lows.
There are two basic types: up fractals and down fractals.
An up fractal, sometimes called a bearish fractal, forms when the high of the middle candle is higher than the highs of the two candles immediately before and after it. It highlights a local swing high.
A down fractal, sometimes called a bearish fractal, forms when the low of the middle candle is lower than the lows of the two candles on either side. It highlights a local swing low.
How does the William Fractal indicator work?
The basic calculation is straightforward.
For an up fractal:
The middle candle has a higher high than the two candles before and after it.
For a down fractal:
The middle candle has a lower low than the two candles before it and after it.
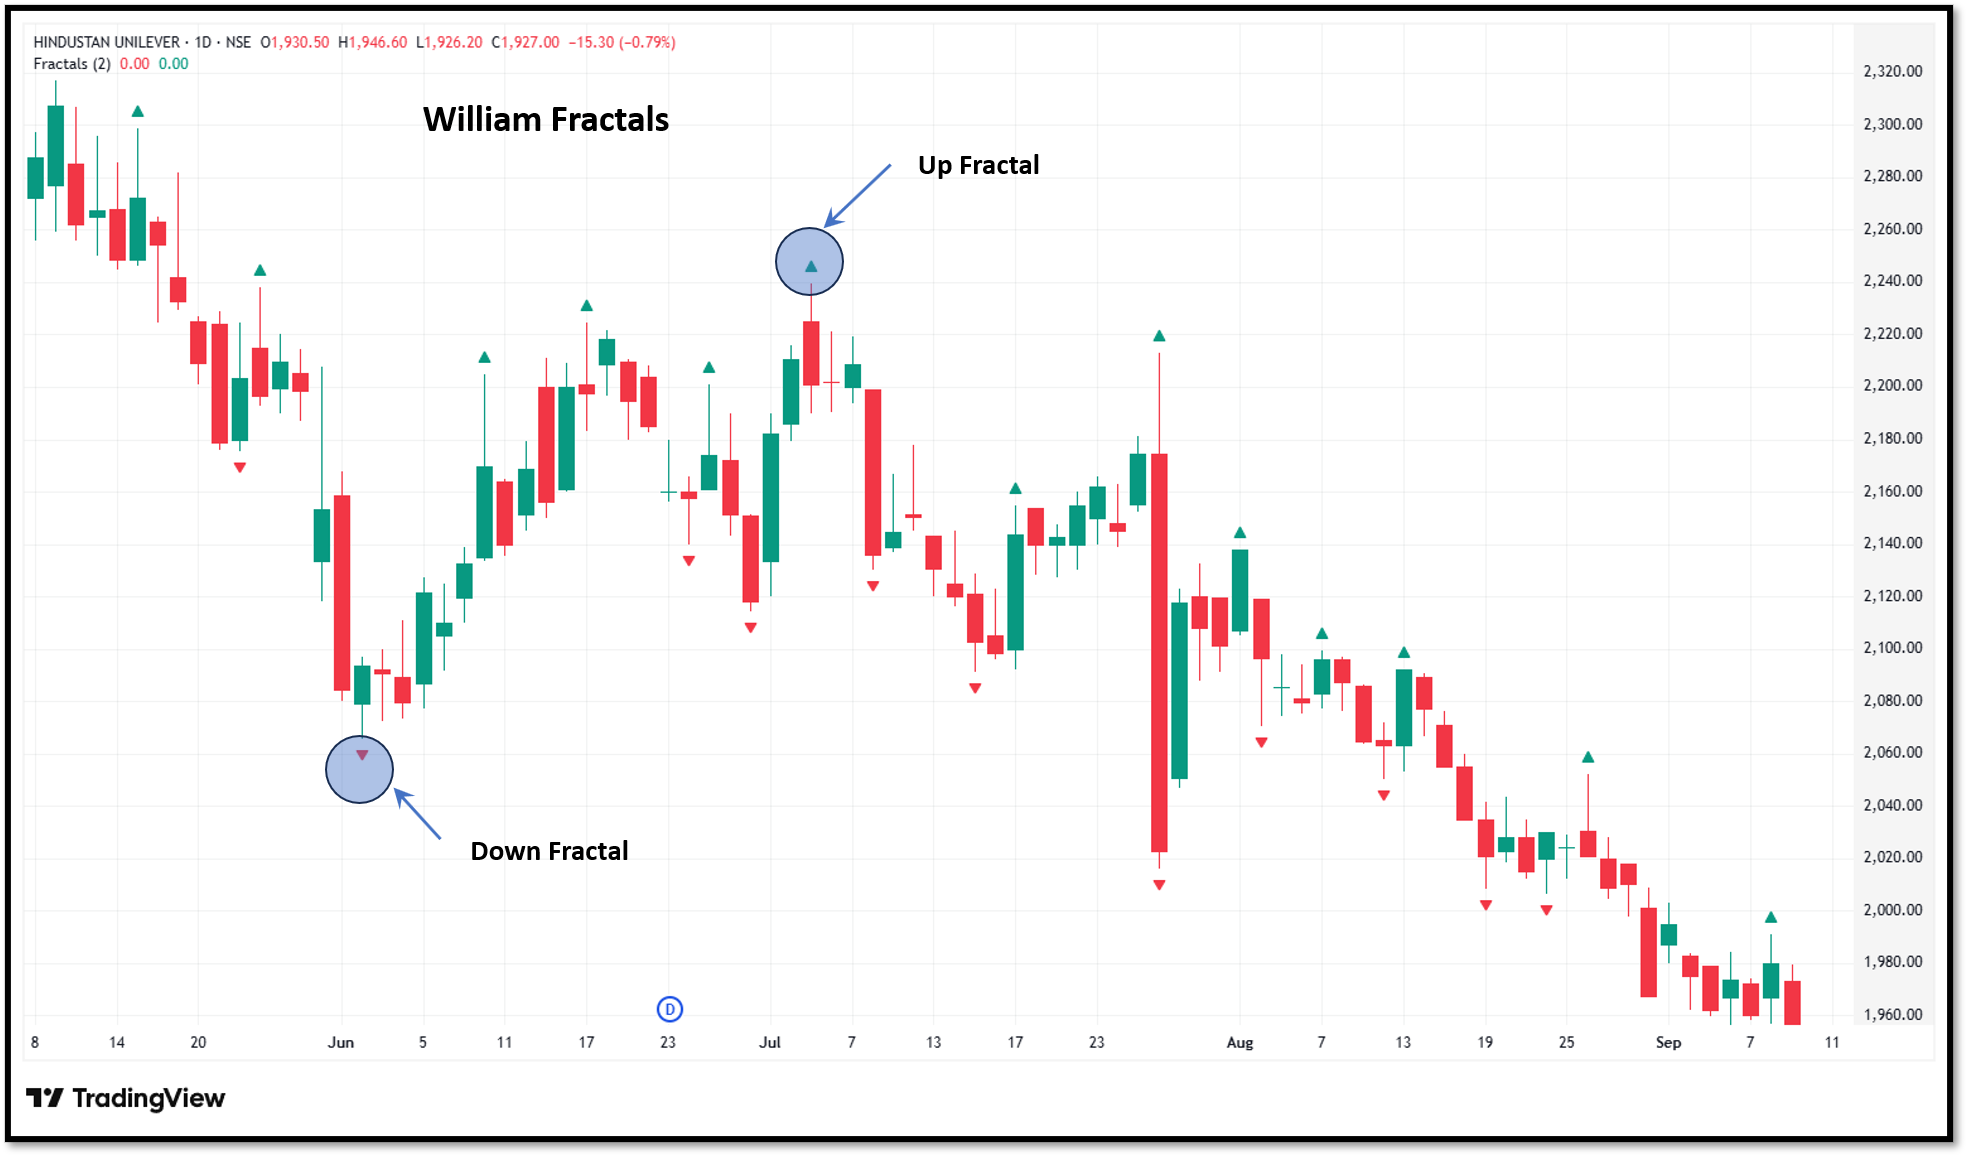
Consider five candles with the following high prices:
₹105, ₹108, ₹115, ₹110, ₹107
The middle candle has a high of ₹115, which is greater than the highs of the two candles on either side. This creates an up fractal around ₹115.
Now consider the lows:
₹98, ₹95, ₹90, ₹94, ₹96
The middle candle has the lowest low at ₹90. This creates a down fractal.
Why does a fractal need five candles?
The five-candle structure is important because the indicator needs information from both sides of the central candle.
This also creates an important limitation: a fractal cannot be confirmed immediately when the middle candle forms. Traders need the subsequent candles to complete the pattern.
For example, if a candle creates what appears to be a swing high, the indicator needs the next two candles to confirm that their highs remain below the central candle's high.
This confirmation delay means traders should be careful when using newly appearing fractals for real-time entries.
What do William Fractals tell traders?
Interpretations of William Fractals are as follows:
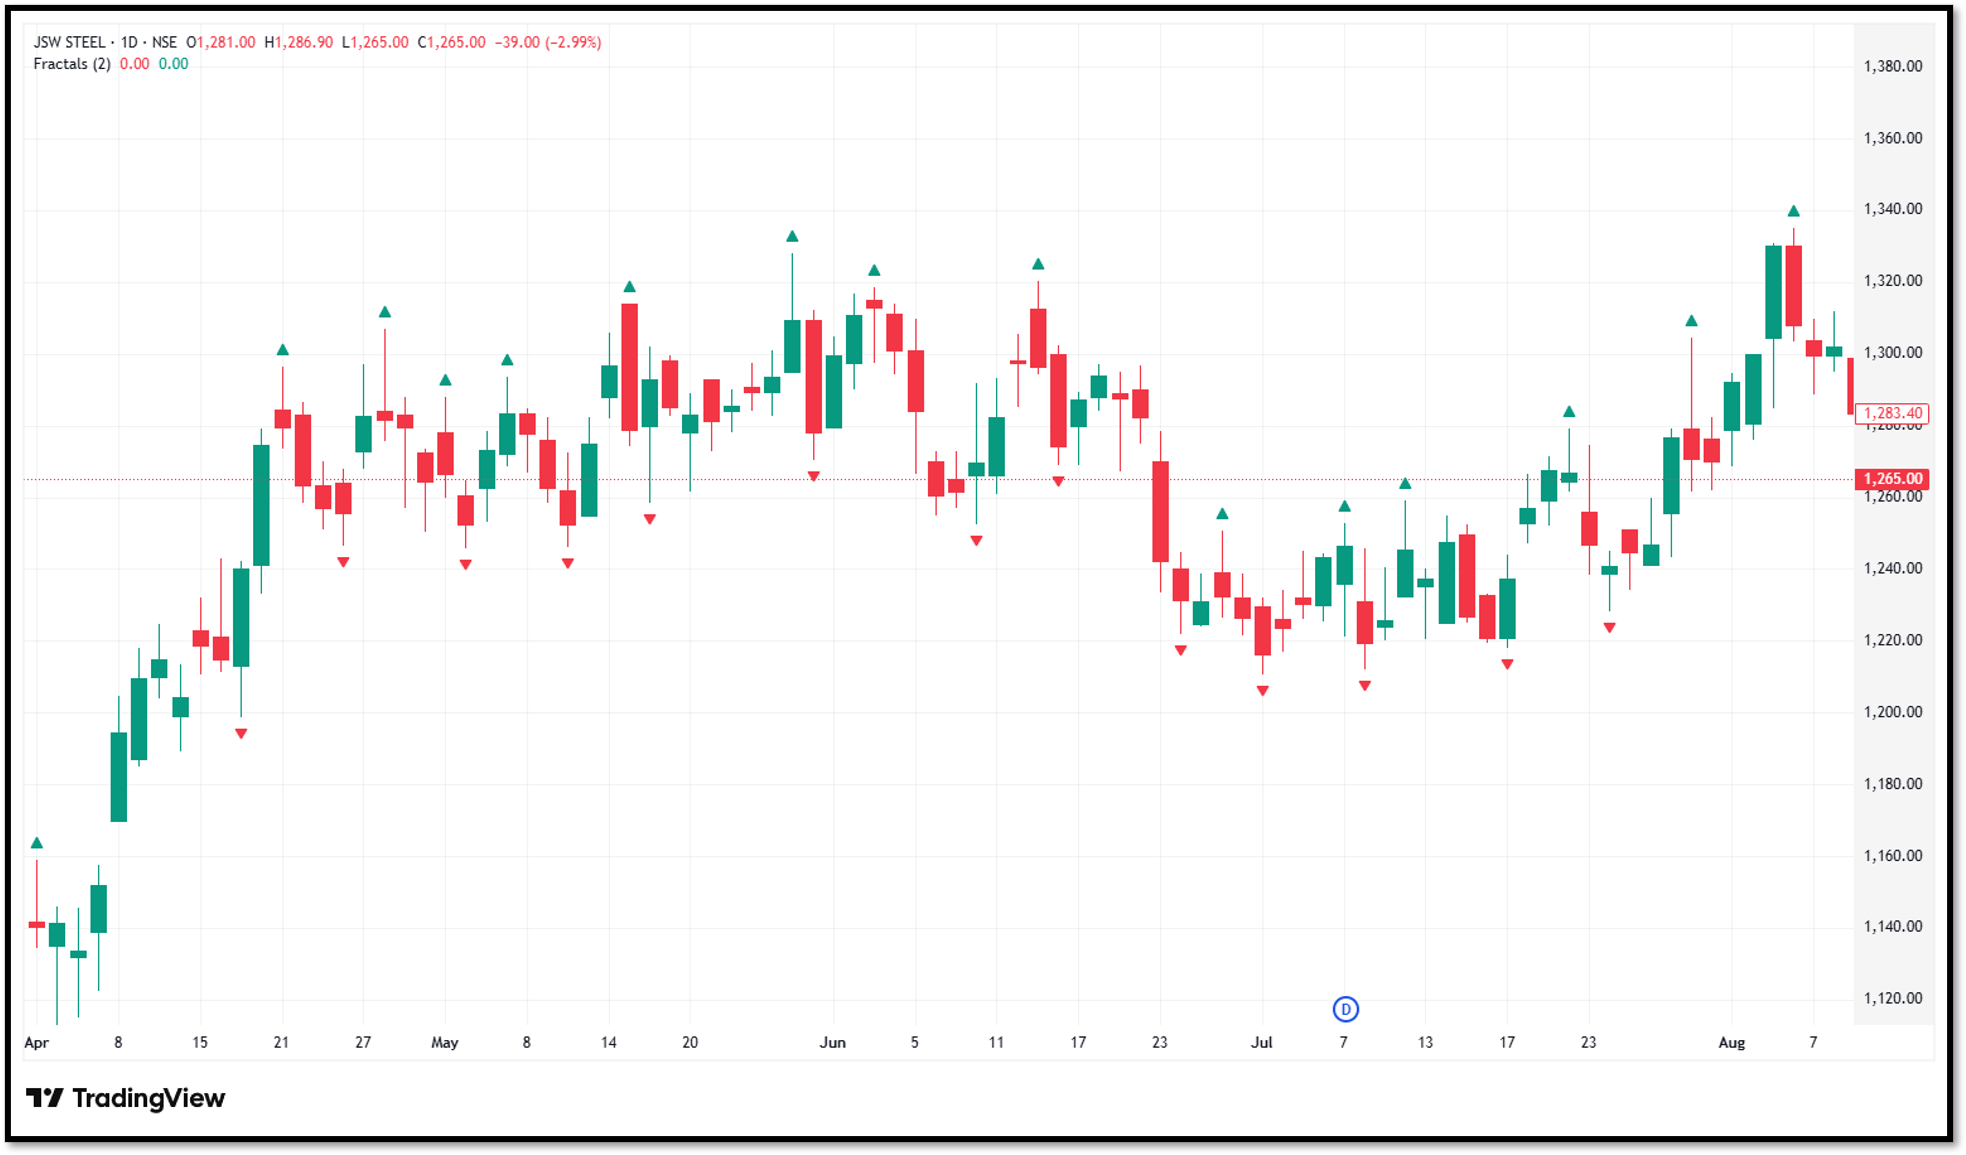
Identifying swing points
The main goal of fractals is to identify local turning points. This can be supported by a series of higher fractal lows to form an upward structure, while lower fractal highs can suggest weakening price structure.
Finding potential support and resistance
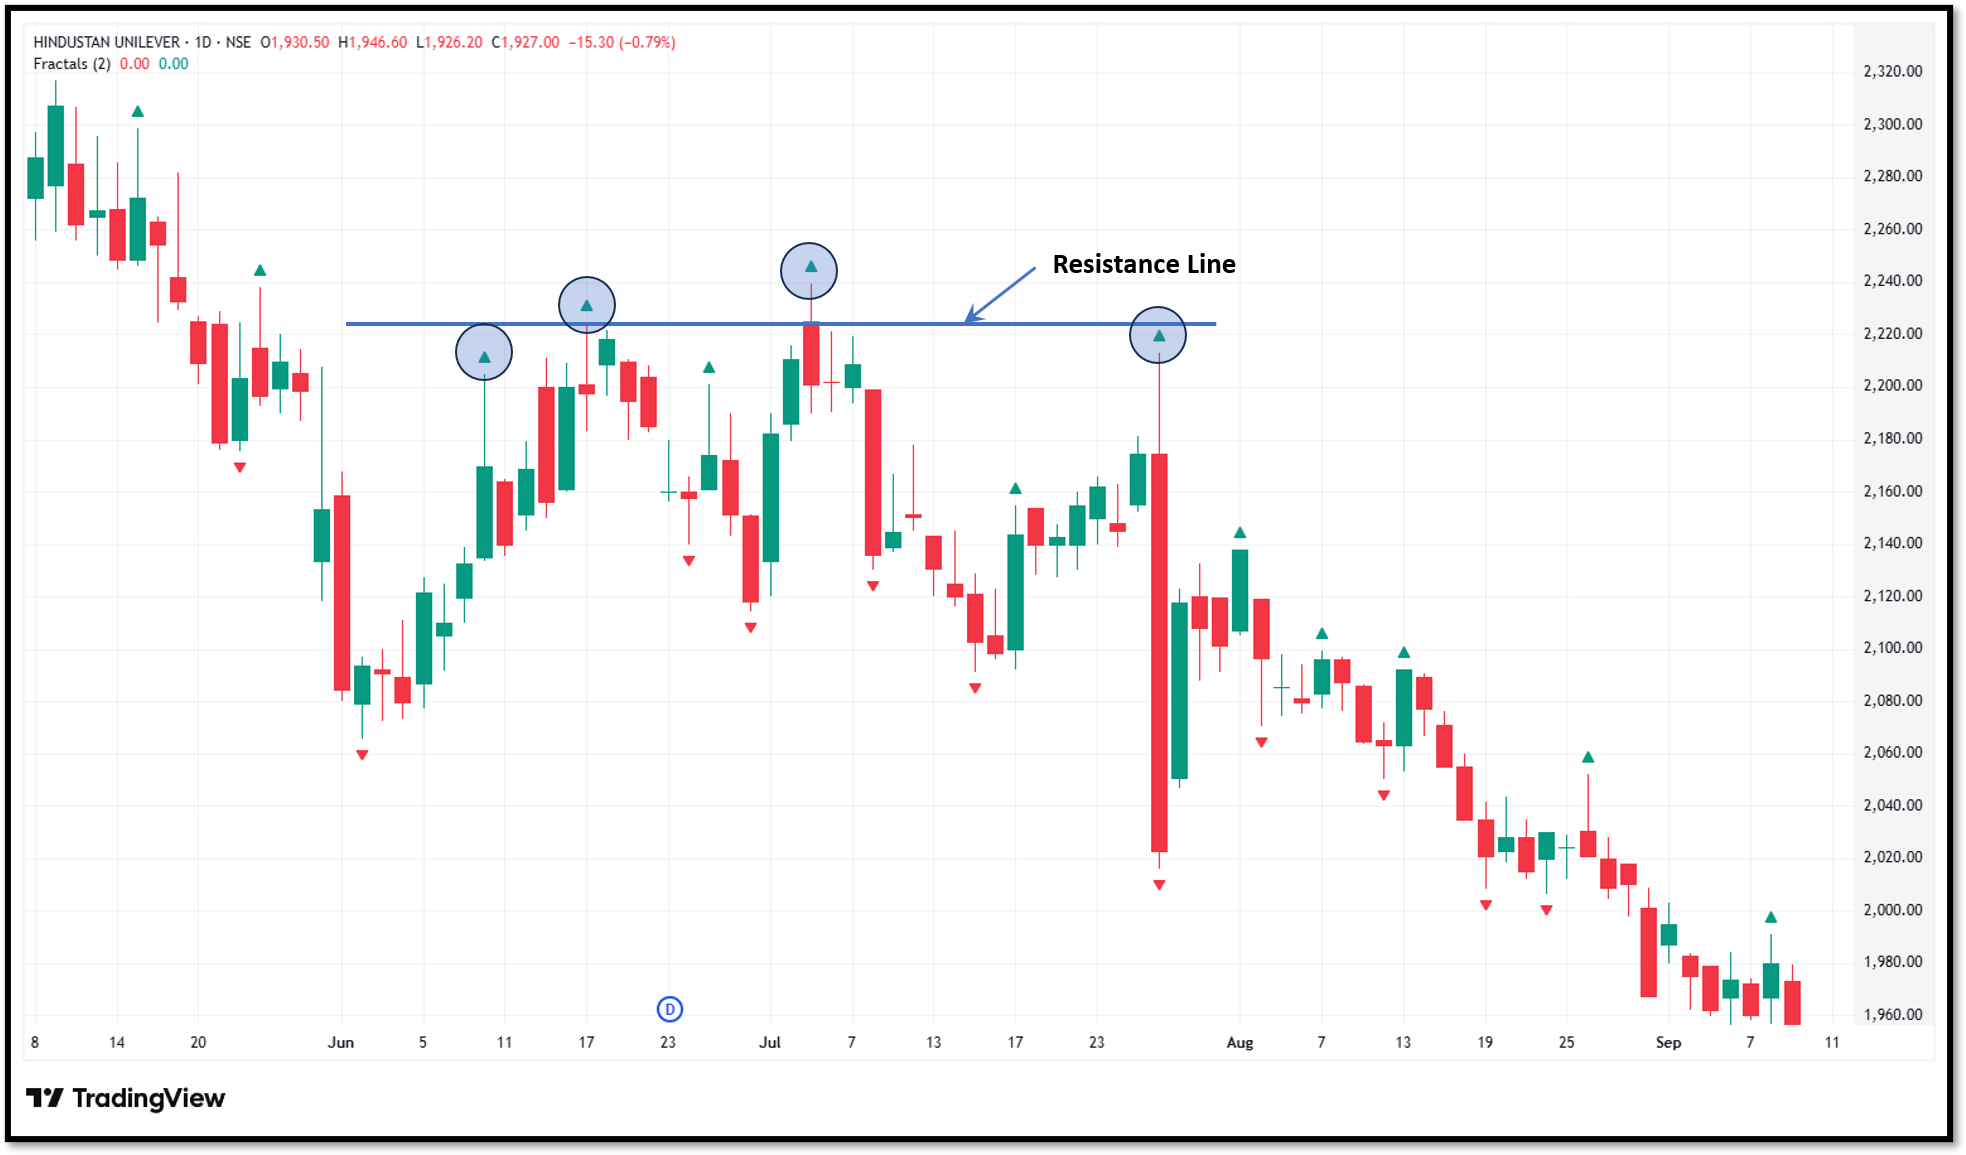
Previous fractal highs and lows can act as reference levels.
For example, if several up fractals form around a similar price zone, that area may become a resistance level worth watching. Similarly, repeated down fractals around a particular price can help identify a potential support zone.
Watching potential breakouts
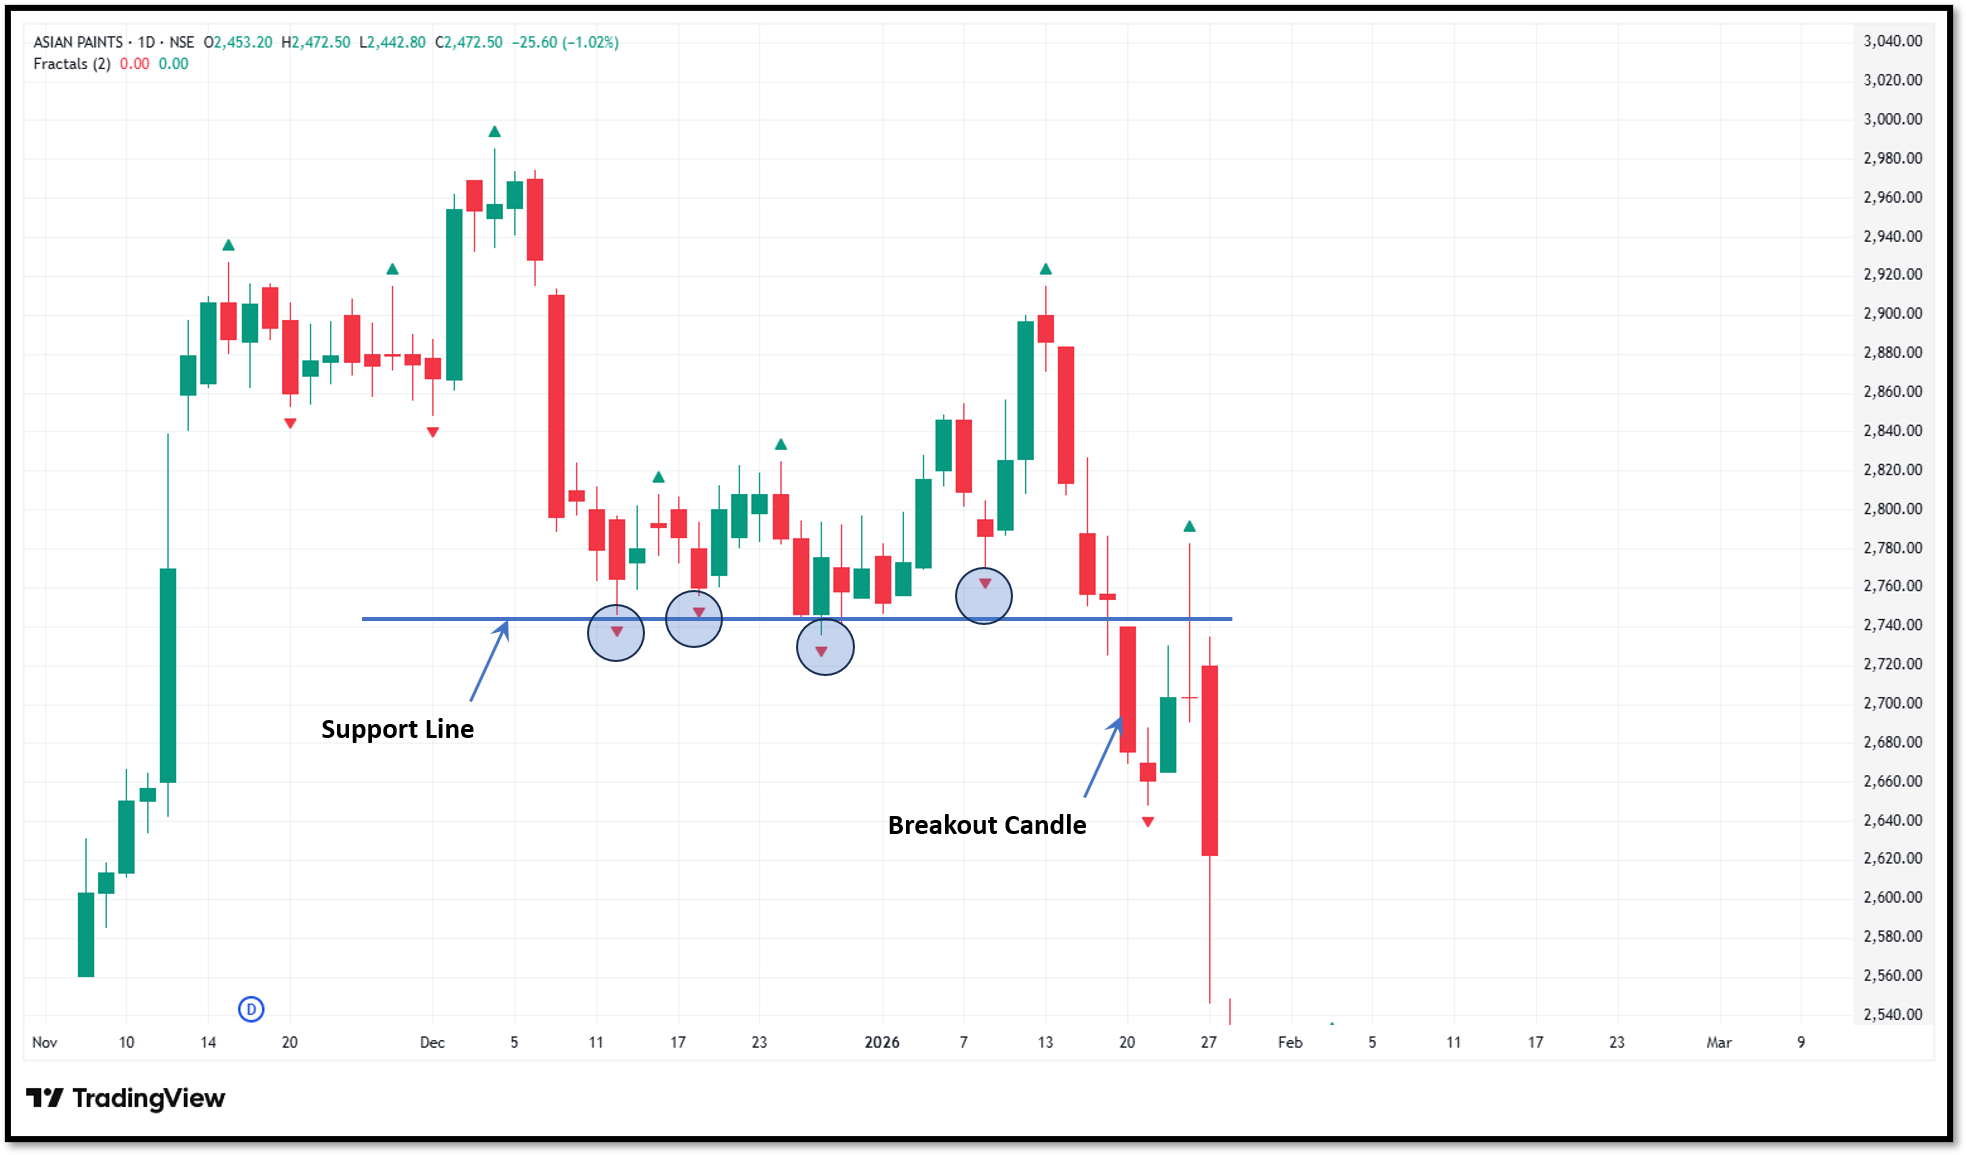
A trader can also use a previous fractal high as a breakout reference.
Suppose a stock forms an up fractal at ₹750 and later moves back toward that level. A sustained move above ₹750 could indicate that buyers have overcome the previous swing high.
William Fractal indicator with trend analysis
Fractals become more useful when interpreted alongside the broader trend.
In an uptrend, traders may pay greater attention to down fractals, because they can highlight potential swing lows where the market pauses before continuing higher. In a downtrend, up fractals can help identify potential swing highs within the broader decline.
For example, imagine a stock is making higher highs and higher lows. A down fractal appears after a short correction. If the price subsequently resumes its upward movement, the fractal low can become a useful reference for analysing the trend.
William Fractal indicator with the Alligator
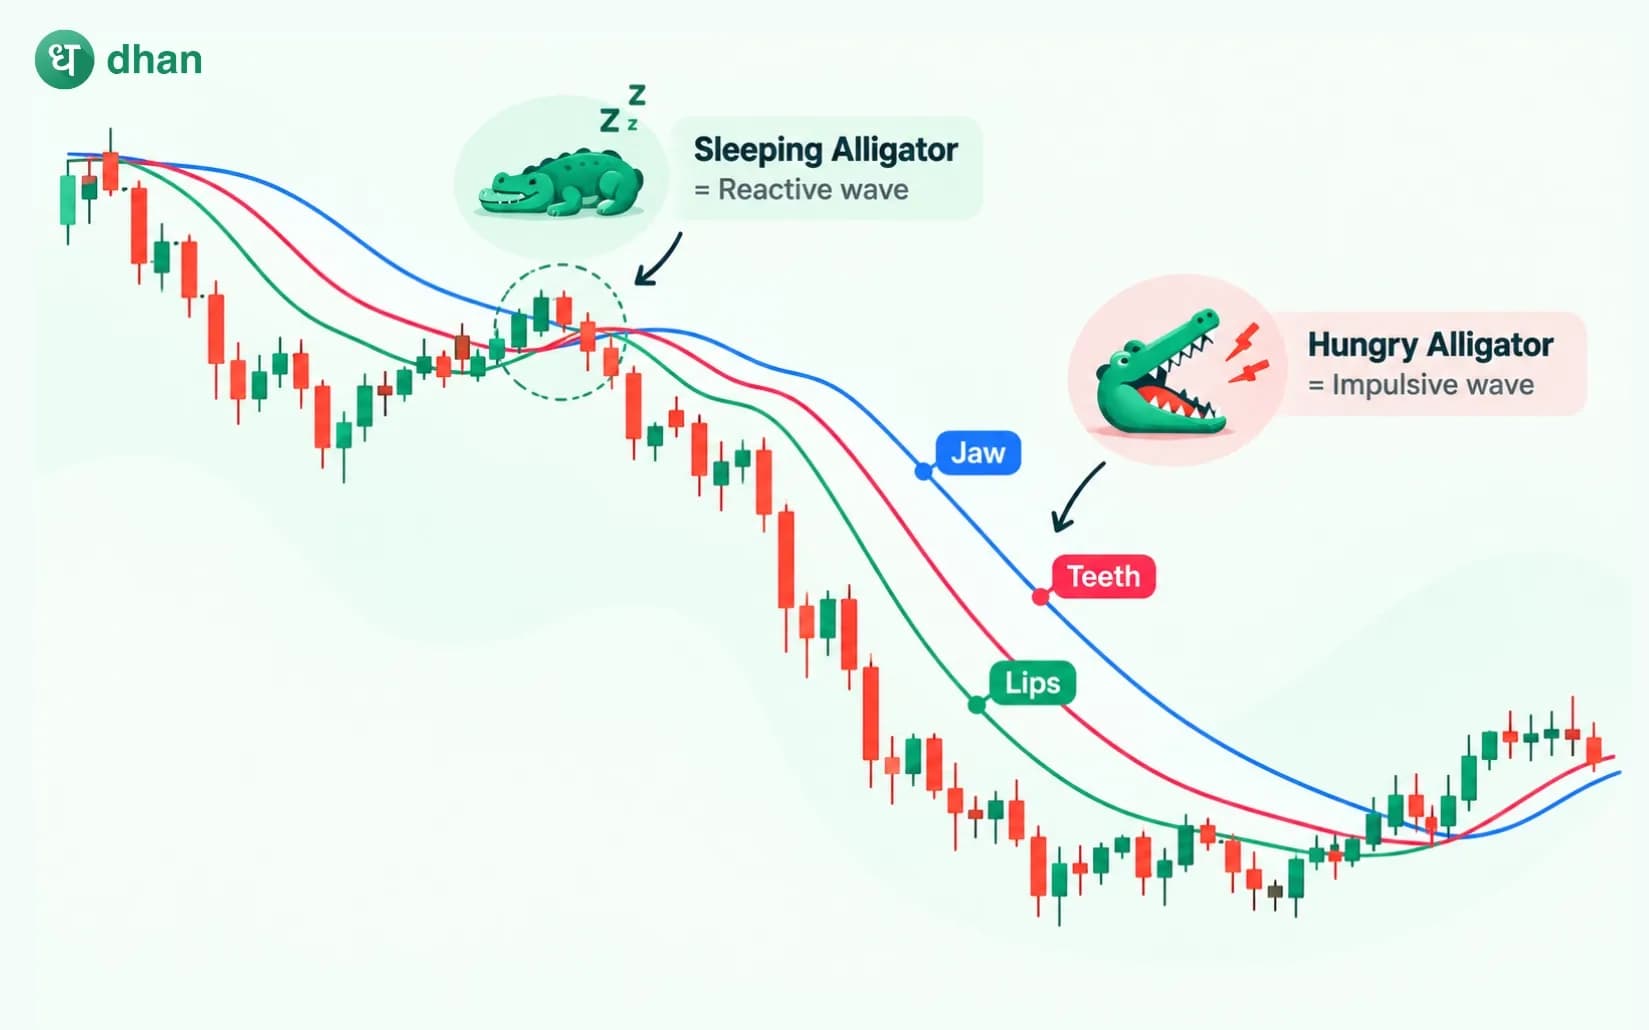
Bill Williams designed the fractal indicator to be used alongside his Alligator indicator. The Alligator uses moving averages to help traders identify whether the market is trending or consolidating.
One commonly discussed approach is to look for a fractal breakout in the direction suggested by the Alligator's trend structure.
For example, if the Alligator indicates an upward trend and price moves above a relevant up fractal, the breakout may receive more attention than a similar move occurring while the market is directionless.
Advantages of the William Fractal indicator
The advantages of the William Fractal indicator are as follows:
- Fractals make turning points easier to spot without requiring complicated calculations. This can help traders mark important price levels when analysing a busy chart.
- A confirmed fractal high or low gives traders a clearly defined level to monitor. A move beyond that level can be studied as a potential breakout within the broader market structure.
- A sequence of fractal highs and lows can help traders observe whether price is forming higher highs, higher lows, lower highs or lower lows.
- The underlying five-candle structure does not depend on a particular asset class. Traders can therefore use the concept for stocks, indices, currencies, commodities and other charted instruments.
Limitations of the William Fractal indicator
Along with advantages, the William Fractal indicator has the following limitations:
- A fractal requires two candles after the central candle, so traders cannot know with certainty that a fractal has formed at the moment of the potential turning point.
- When price moves back and forth within a narrow range, numerous fractals may appear. Many of these points have little significance and can create unnecessary trading signals.
- A fractal identifies a local swing, not necessarily a long-term market top or bottom. Treating every marker as a reversal signal can result in premature trades.
- Fractals describe price structure but do not independently show whether a move has strong participation or unusual volatility.
- Shorter charts tend to produce more frequent price fluctuations and fractal formations.
How to use the William Fractal indicator effectively
Traders usually start with the higher-time-frame trend and then use fractals to identify relevant swing points.
For a bullish setup, a trader might look for an established upward structure, identify a meaningful down fractal during a pullback, and then monitor whether price resumes higher.
For a bearish setup, the process can be reversed. The trader can identify a downward trend, monitor an up fractal formed during a temporary recovery, and then watch whether price falls below an important support level.
Fractals can also be combined with volume, moving averages, trend indicators or momentum indicators.
William Fractal vs regular swing highs and lows
A regular swing high or low is a general concept used in price-action analysis. Traders can identify one visually based on the surrounding market structure.
The William Fractal provides a specific rule for identifying these points using five candles. This makes the process more consistent and easier to automate or reproduce across charts.
In other words, every William fractal represents a particular type of local swing structure, but not every swing point a trader identifies visually needs to follow the exact William Fractal rules.
Conclusion
The William Fractal indicator is used to identify local swing highs and lows using a five-candle price structure. Its main value comes from helping traders map market structure, identify potential support and resistance, and monitor possible breakouts.
However, fractals should not be treated as standalone buy or sell signals. They are confirmed with a delay and can appear frequently when markets are moving sideways.
FAQs
What is the William Fractal indicator?
The William Fractal indicator is a technical analysis tool developed by Bill Williams. It identifies potential local highs and lows using a five-candle formation.
What is an up fractal?
An up fractal forms when the middle candle has a higher high than the two candles immediately before and after it. It identifies a potential local swing high.
What is a down fractal?
A down fractal forms when the middle candle has a lower low than the two candles on either side. It identifies a potential local swing low.
Can fractals be used for intraday trading?
Yes. Fractals can be applied to intraday charts, but shorter time frames may produce more frequent signals and market noise.
Can the William Fractal indicator be used for stocks?
Yes. The indicator can be applied to stock charts as well as other instruments that display price data.