The stock market is the most important component of a free-market economy, as it facilitates democratised capital trade and exchange. Online stock trading is the act of purchasing and selling stock in a corporation. As the stock market is highly volatile, there are analysts to determine the ongoing trends.
There are two types of analysts – Fundamental and Technical.
Fundamental analysis determines a company’s underlying worth and potential for future growth by looking at its revenues, profits, future growth, return on equity, profit margins, and other statistics. Whereas, Technical Analyst examines the past trading activity and price variations of an asset as it determines the future price moments. Most traders and even investors use technical analysis to determine when to enter and exit trades. The Analysts take the help of the technical charts to determine the trends.
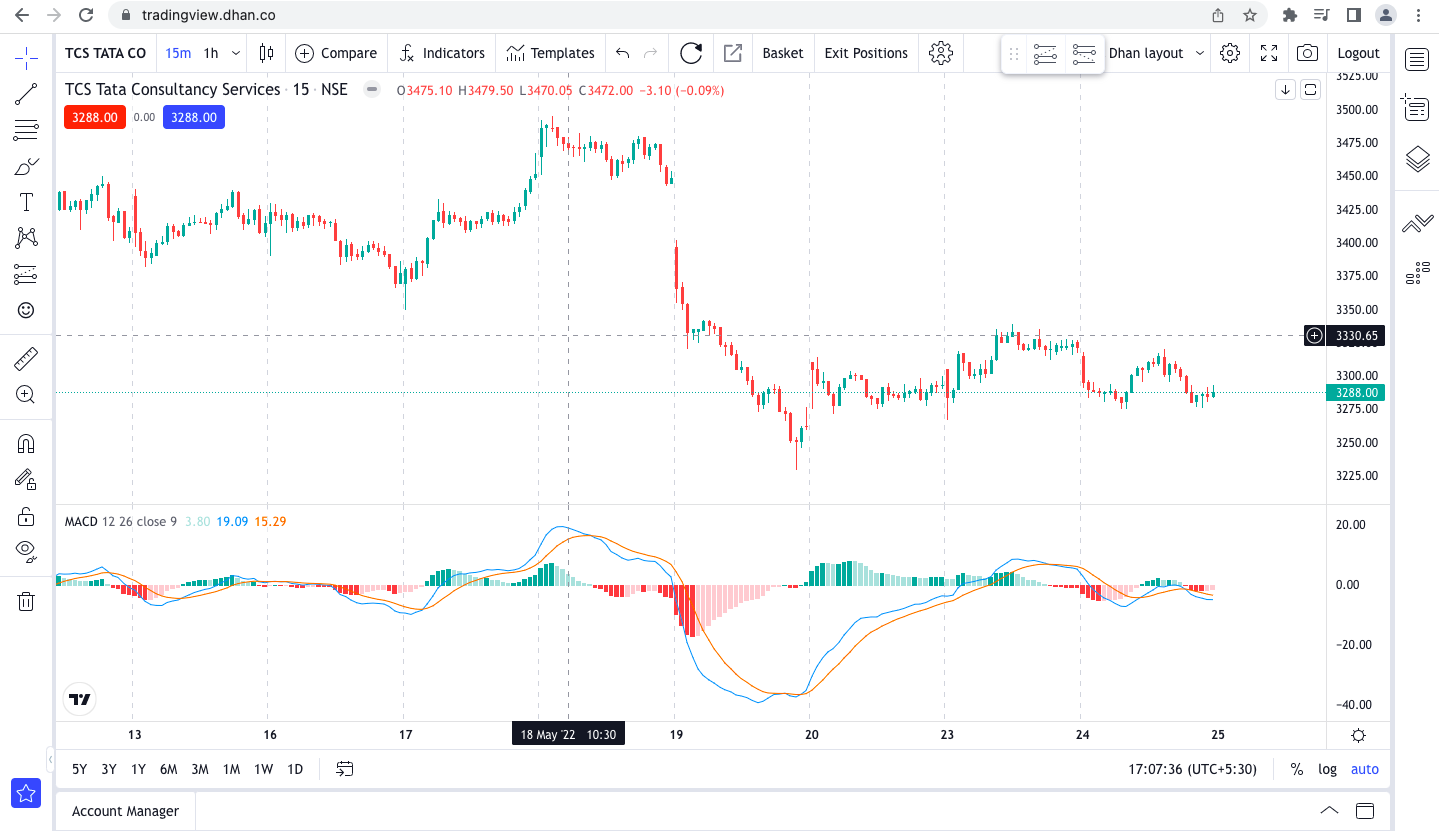
Technical charts are simple and attractive graphics that encapsulate mountains of information about equities. The graphs are then diced further to reveal crucial patterns and turnaround signs. Trading is thrilling and significant because of this. The charts are based on a few indicators that determine the rise or fall of the market.
Here are some of the important and most referred indicators that can help you trade directly from charts effectively:
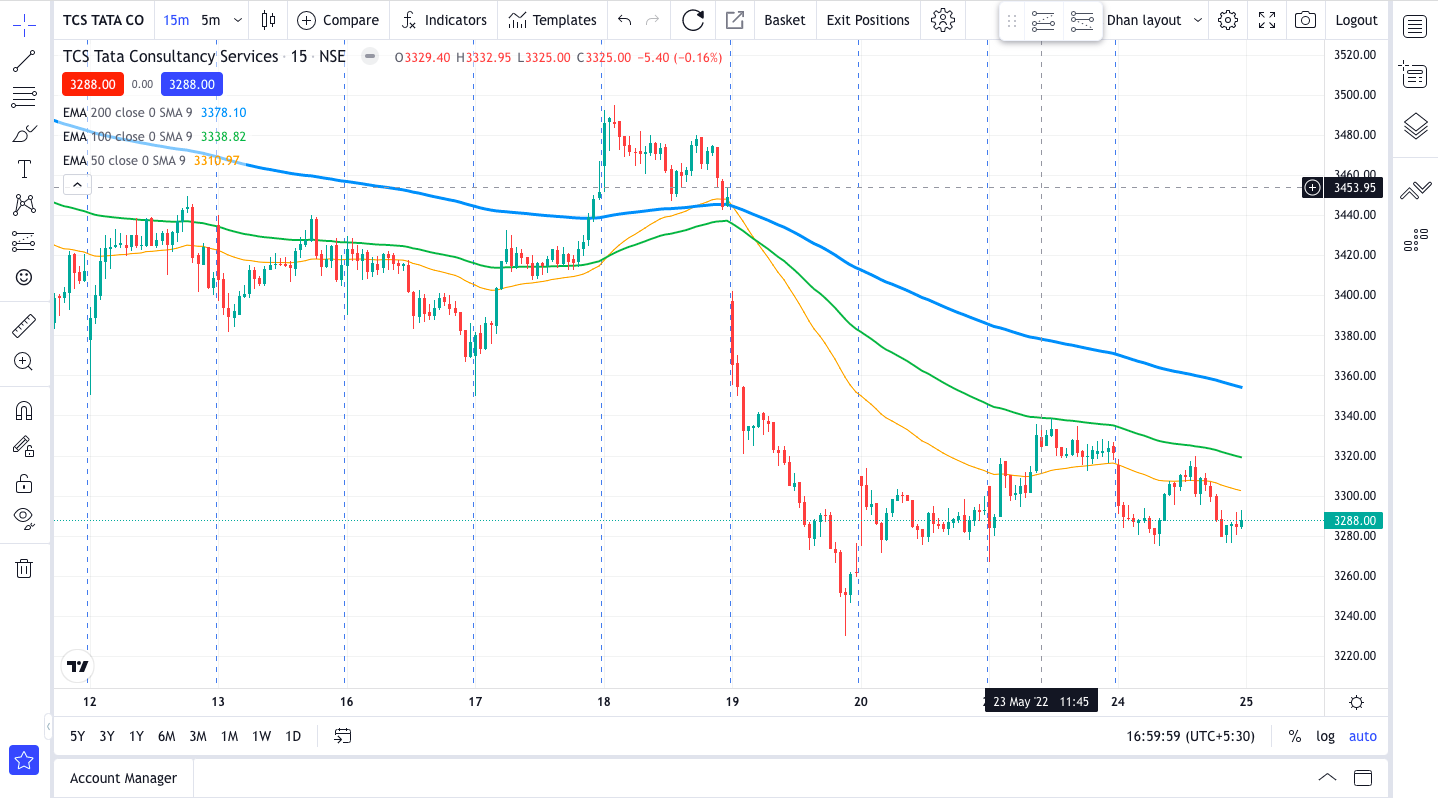
1. Using Displaced Moving Averages in Trading (DMA)
Moving averages are one of the most important aspects of trading with technical charts. Moving averages make it simple for a trader to spot trading opportunities within the market’s broad trend. Moving averages are used to determine the direction of a trend as well as the best moment to purchase or sell a stock. It is extremely valuable not only for technical analysts but also for fundamental analysts. Moving average is a standard average in which the data point skips and calculates. The 50 DMA, 100 DMA, and 200 DMA are popular moving averages.
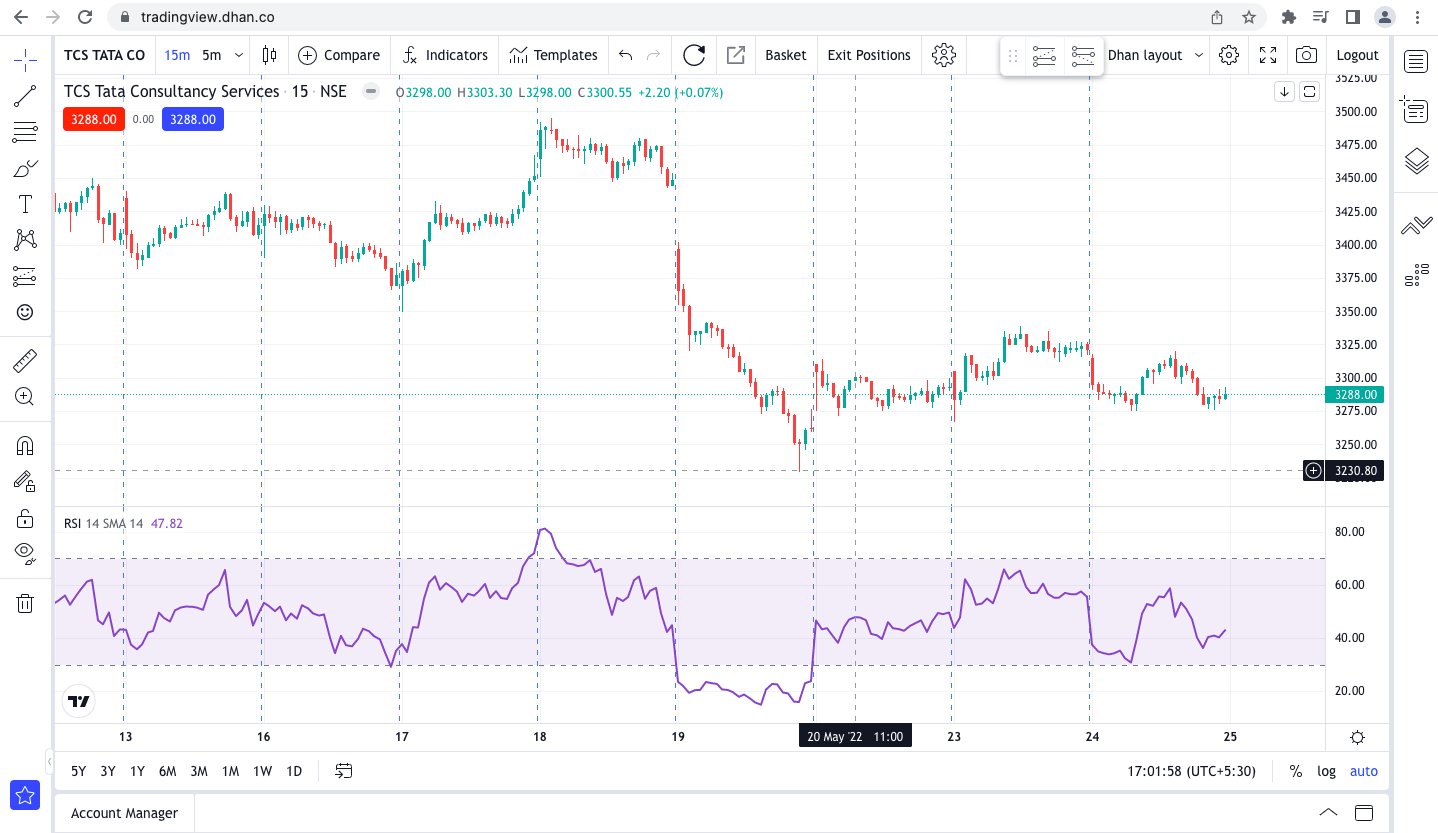
2. Using the Relative Strength Index to Trade (RSI)
An oscillator is also known as the Relative Strength Index (RSI). This allows you to determine if the stock you’re looking at is overbought or oversold in a reliable manner. Overbought equities are often candidates for selling or shorting, while stocks that are oversold are typical candidates for purchasing at lower levels. When is the best time to enter the market and buy stock? The RSI provides an answer to that question. As an oscillator, the RSI is shown on a scale of 0-100. A reading of 100 means the stock is severely overbought, while a reading of 0 means the stock is extremely oversold.
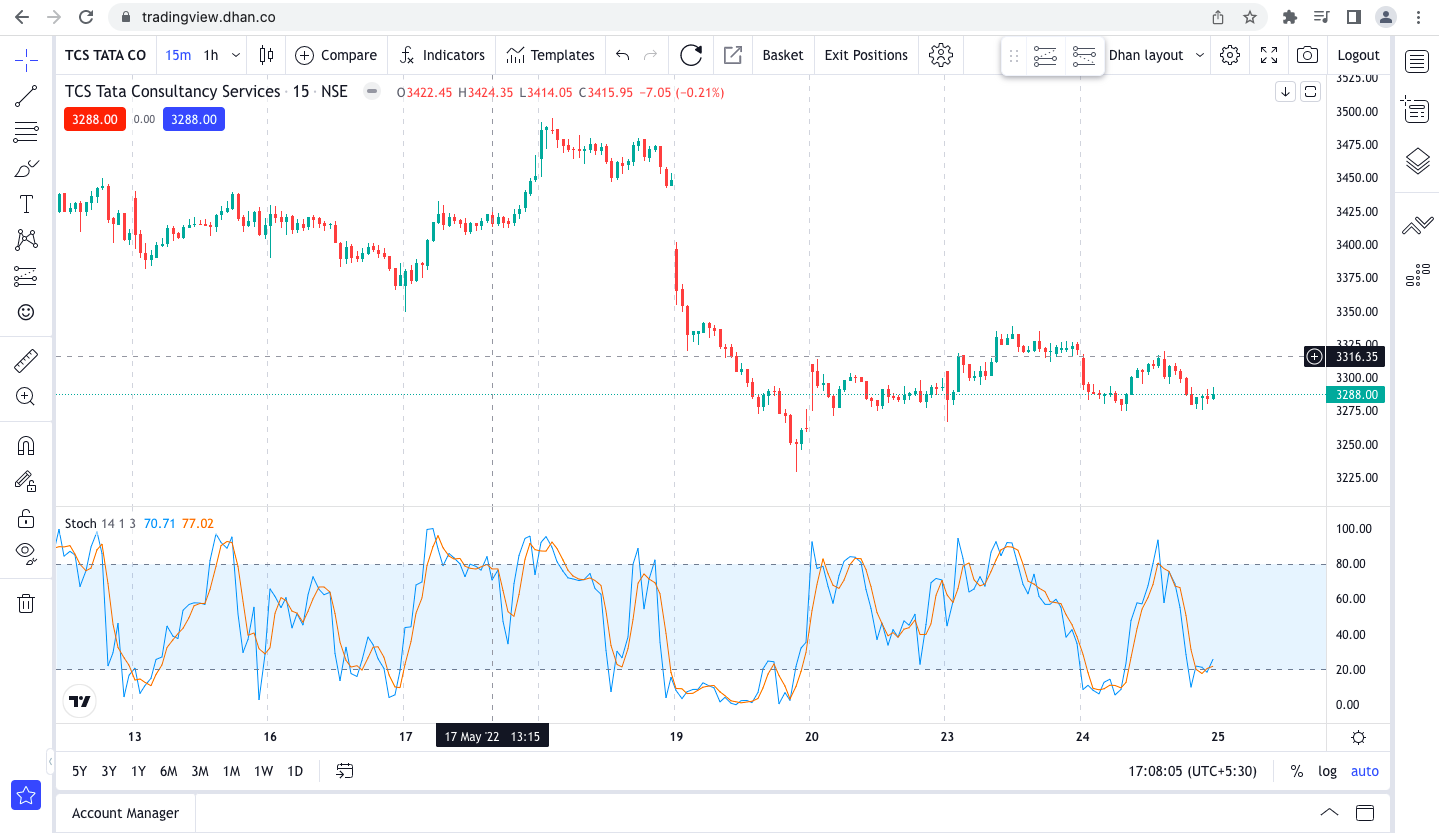
3. Using Stochastics in Trading
The stochastic oscillator, like the RSI, is an oscillator that shows whether a stock is overbought or oversold. In comparison to the RSI, the Stochastics is more dependable and positive of these zones, and it is employed by expert traders more frequently. Before determining overbought and oversold zones, the RSI does not search for double confirmation. The Stochastics takes a step further by identifying the per cent K and per cent D lines, as well as using a crossover to detect oversold levels.
4. Moving Average Convergence Divergence Trading (MACD)
The relationship between two moving averages of a security’s price is shown by moving average convergence divergence (MACD), a trend-following momentum indicator. How do you use MACD to find signals? By subtracting the 26-period exponential moving average (EMA) from the 12-period EMA, the MACD is calculated. The lines in respect to the zero line, which indicate an upward or downward bias in the stock price, are the first to notice. Second, you must determine whether the red and blue lines cross over or under to obtain a suitable trading signal. An exponential moving average (EMA) is a sort of moving average (MA) that gives the most recent data points more weight and relevance.
To Wrap Up
Technical Charts work as a life jacket for the trader as it determines the entry and exit of the trend. A simple understanding of technical indicators may go a long way toward assisting you in making better trading selections. It is necessary to keep in mind these indicators and make a smart choice for yourself.
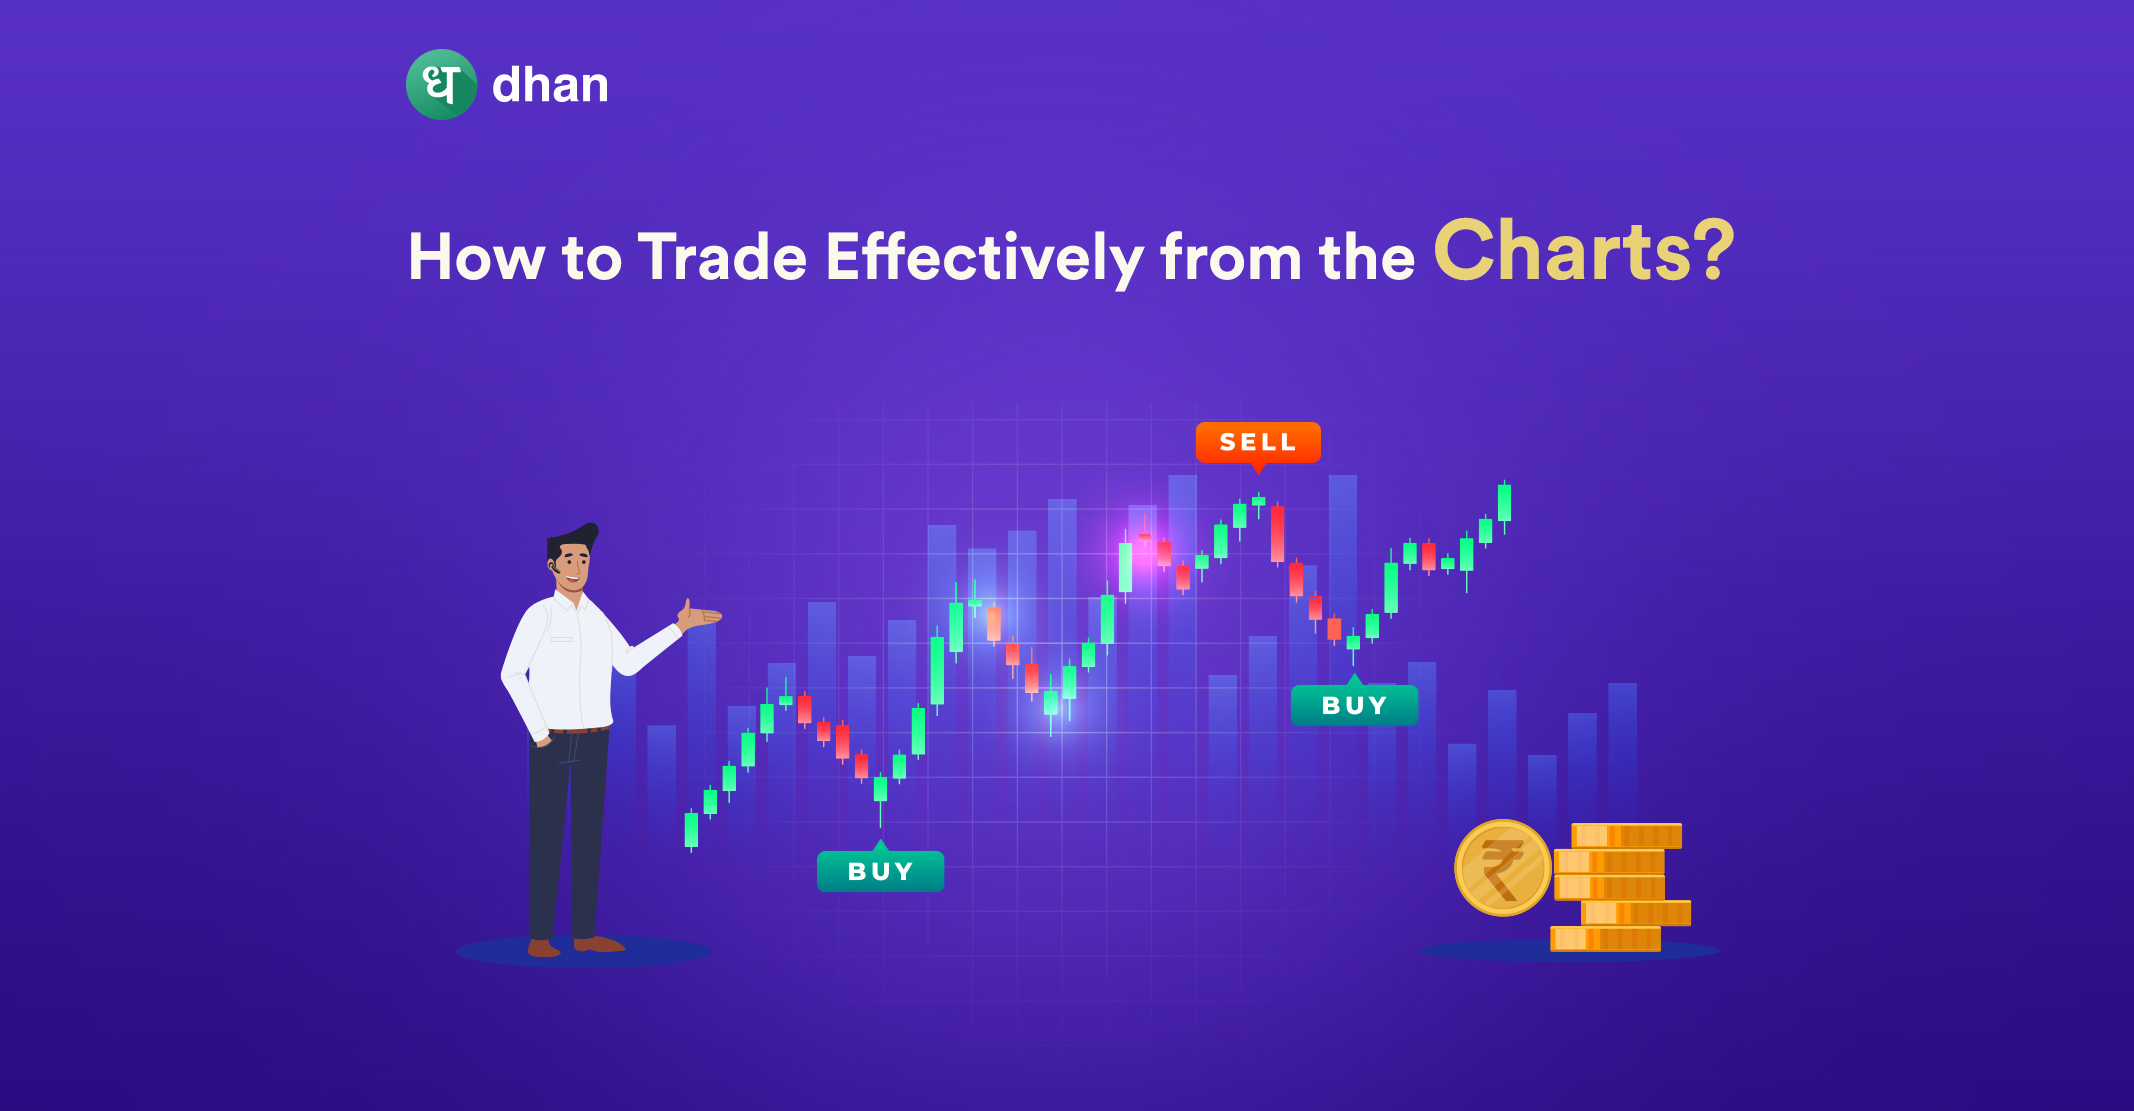
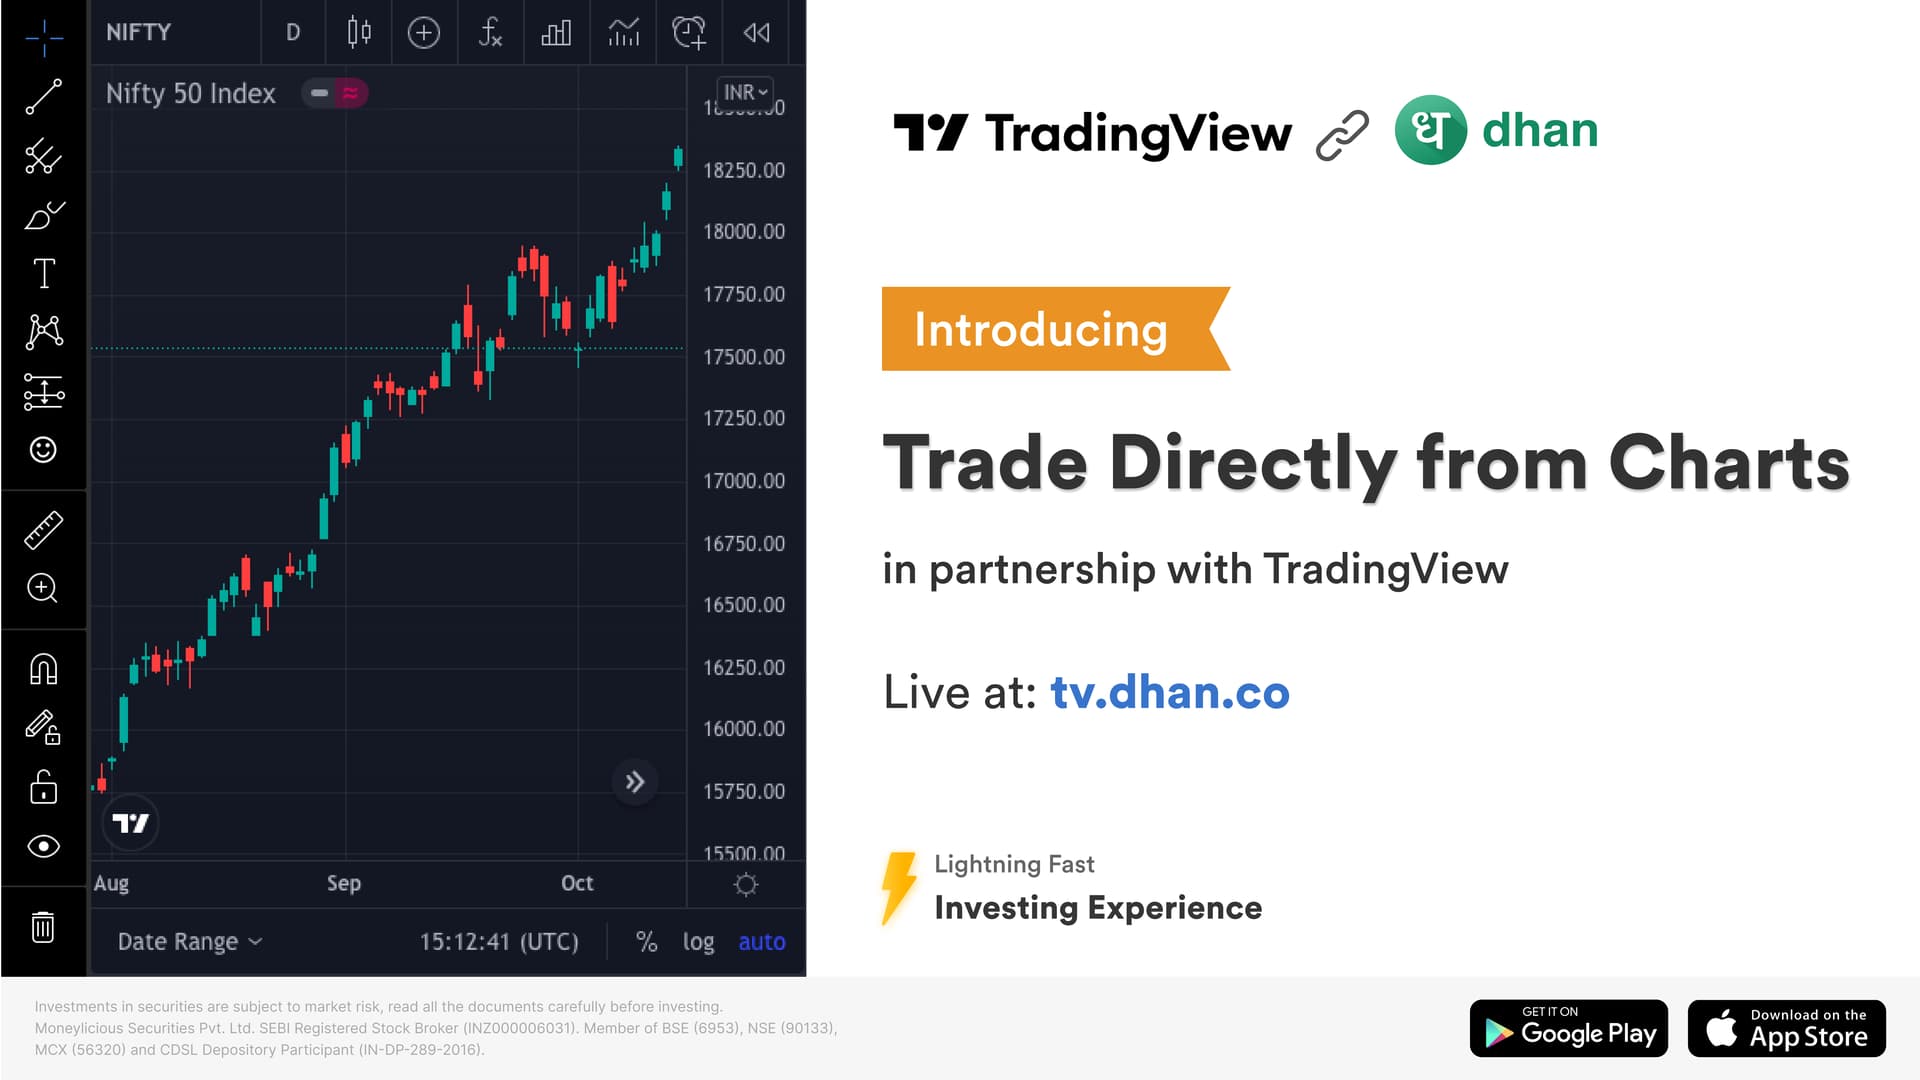
Dhan in collaboration with TradingView has built a super product for super traders to trade directly from charts.
With this deep integration between TradingView, users of Dhan App can now directly Trade via TradingView charts in Shares, Options & Futures , Commodity & Currency.
You can also read – What is Algo-Trading and How Useful Is It for Day Traders?
Happy Trading 📈
PS: The above-mentioned stock in chart is just for educational purposes and should not be construed as recommendation for buying/selling. Investments in securities are subject to market risk read all the related documents carefully before investing. The stocks discussed on this website may not be suitable for all investors. Investors should make their own investment decisions based upon their own financial objectives and financial resources and, if in any doubt, should seek advice from an investment adviser.
Disclaimer: This blog is not to be construed as investment advice. Trading and investing in the securities market carries risk. Please do your own due diligence or consult a trained financial professional before investing.
Comments are closed.