Options Chain data is a complete picture of different Option strikes for a particular stock or Index. The Option Chain data analysis will help you undertake both Macro and Micro level research on the stock market.
- The Option Chain on the Stock Index gives a broader picture of where a particular sector or market is moving.
- The Option Chain on a particular stock helps to predict the movement of that particular stock.
Before we move into the technicals, let us understand what is Option Chain and what are some important components.
What is Option Chain?
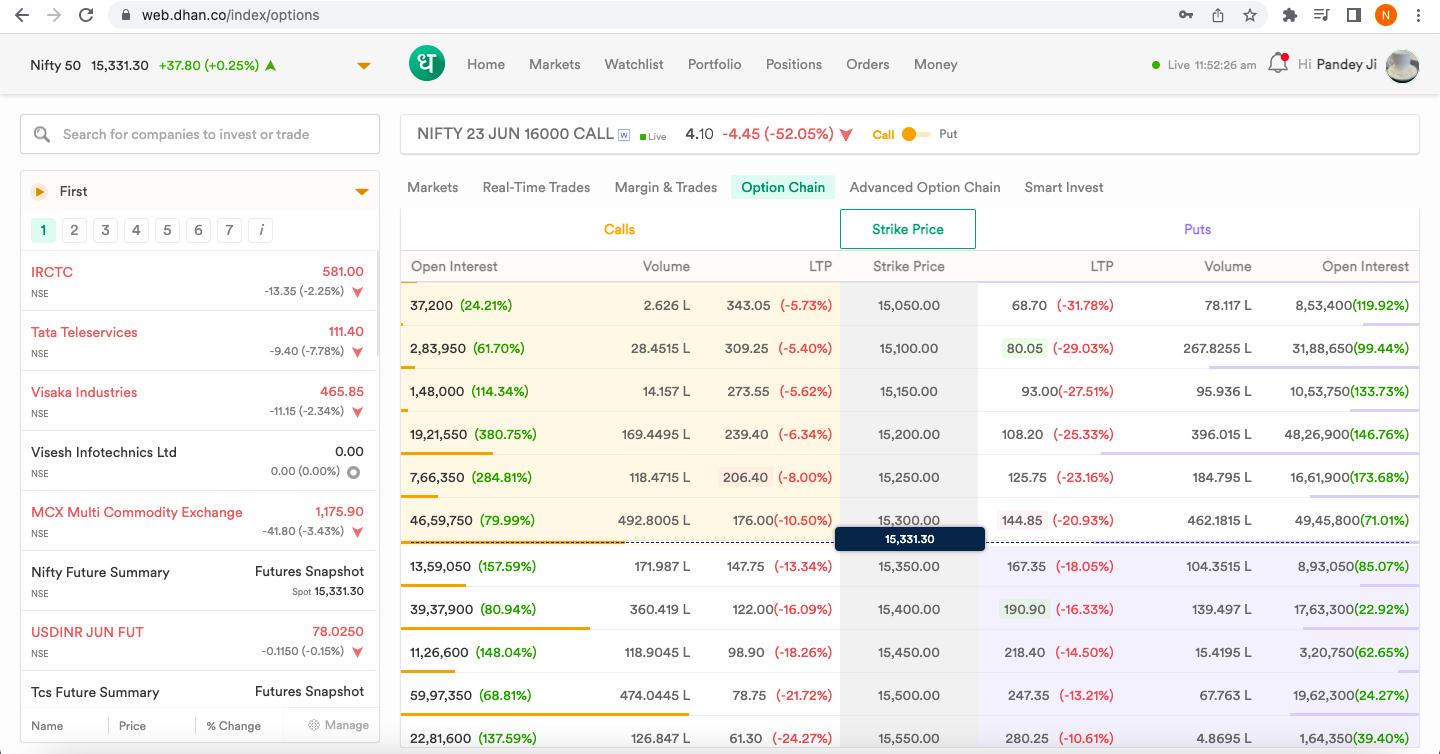
The Option Chain is a snapshot of the critical data related to different strike prices of an Index Option or Stock Option.
The At The Money (ATM) strike price is at the center. The Strike price increases with increasing rows, and vice-versa.
All important information related to the Call option lies on the left side of the Strike price. The data related to the Put option can be seen on the right side.
The Option Chain is visually represented as shown in the image below:

Important Components of Options Chain
The critical components showcased in the Options Chain make the data super useful to traders to place the right trades and not miss an opportunity to gain profits.
1. Strike Price
The strike price is the cost at which you can purchase (with a call) or sell (with a put). Call Options with higher strike prices are quite often more affordable than lower strike calls.
The converse is valid for put Options – a lower strike price likewise converts into lower Options prices.
2. Premium
The last price is the latest posted trade, and the change shows how much the last trade fluctuated from the earlier day’s closing price.
Bid and ask to show the prices that sellers and buyers, individually, are ready to trade at the present moment. Buyers are simply ready to pay so much, and the sellers are willing to accept so much.
Negotiations occur at both ends until the bid and ask prices start coming closer together. Finally, the transaction occurs only after the buyer takes the offered price or the seller accepts the buyer’s bid.
The price of a contract is called the premium in options, which is the upfront fee that a buyer pays to the seller through their broking platform for purchasing the Option.
3. Open Interest (OI)
The Open Interest helps in Options trading by making you understand the total number of open Options are there in the market for that particular Strike.
OIs are contracts that have not been exercised, offset, or assigned. Sudden fluctuation in the OI will indicate Fund houses taking positions. This will help you predict the direction.
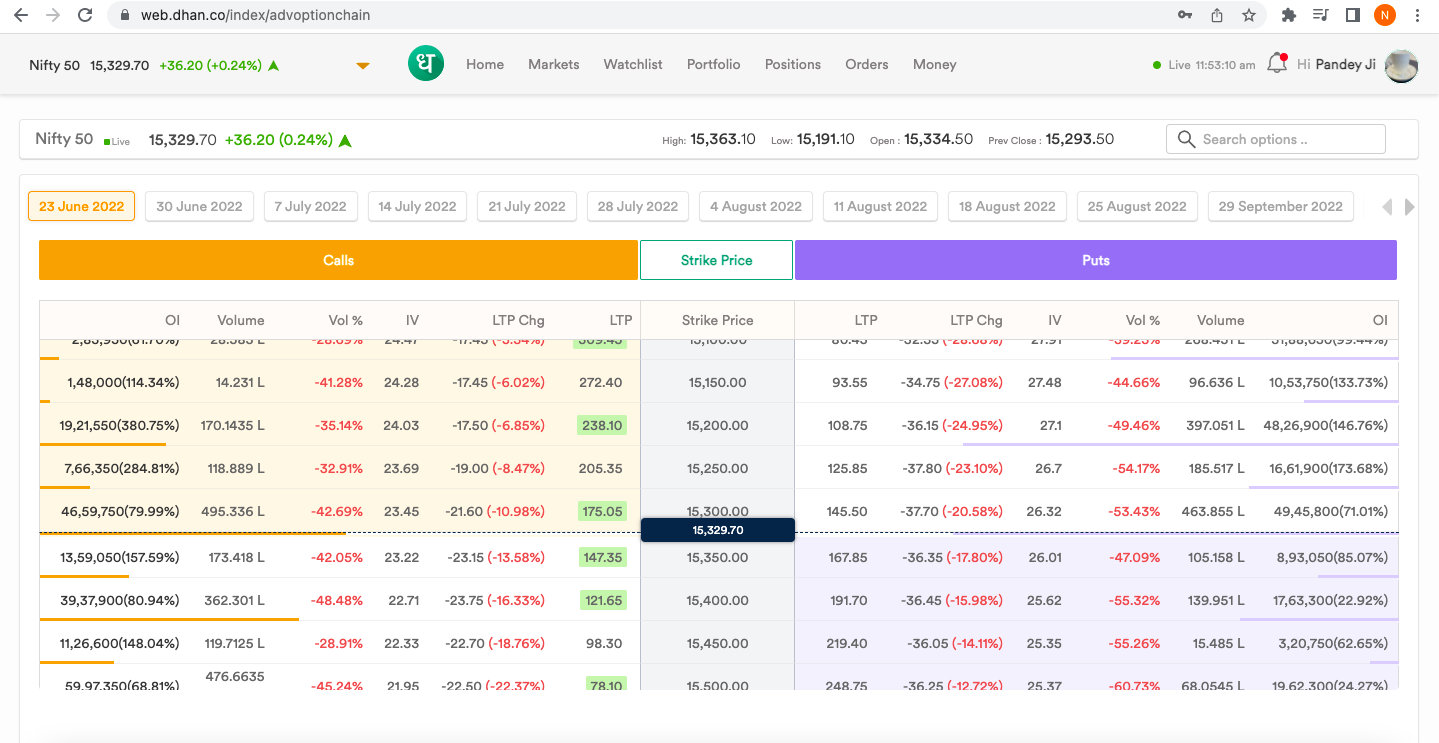
4. Implied Volatility (IV)
Implied Volatility is a market’s prediction of the movement of the underlying security of an option. If the IV is high, then the chances of the underlying security’s movement are high and the Option price will be high.
5. Volume
The volume indicates the total number of contracts that are created in a day. If the volume is high, then it indicates that traders are more interested in the contract and vice versa.
How to Use Option Chain to Trade Futures and Options?
Option Chain data acts as an additional check, in your trading to predict the movement of the stock.
Once you have selected a particular stock for trading, the Index Options Chain and Stock Option Chain will help you forecast the movement and make a profitable trade.
Large Fund houses spend millions to hire market researchers and to get material information at a faster rate from different sources.
As soon as the market starts to react to a particular stock, the Indicators in the Options Chain Chart will throw triggers.
If the Bid quantity of a particular OTM (Out of the Money) call starts to increase suddenly, then the stock price may move up and you can trade accordingly.
Similarly, if the IV (Implied Volatility) increases rapidly, then the stock price may either go up or down, so you can enter into a Long Strangle (Buying Call and Put of the same strike).
Option Chain on Dhan Trading Platforms
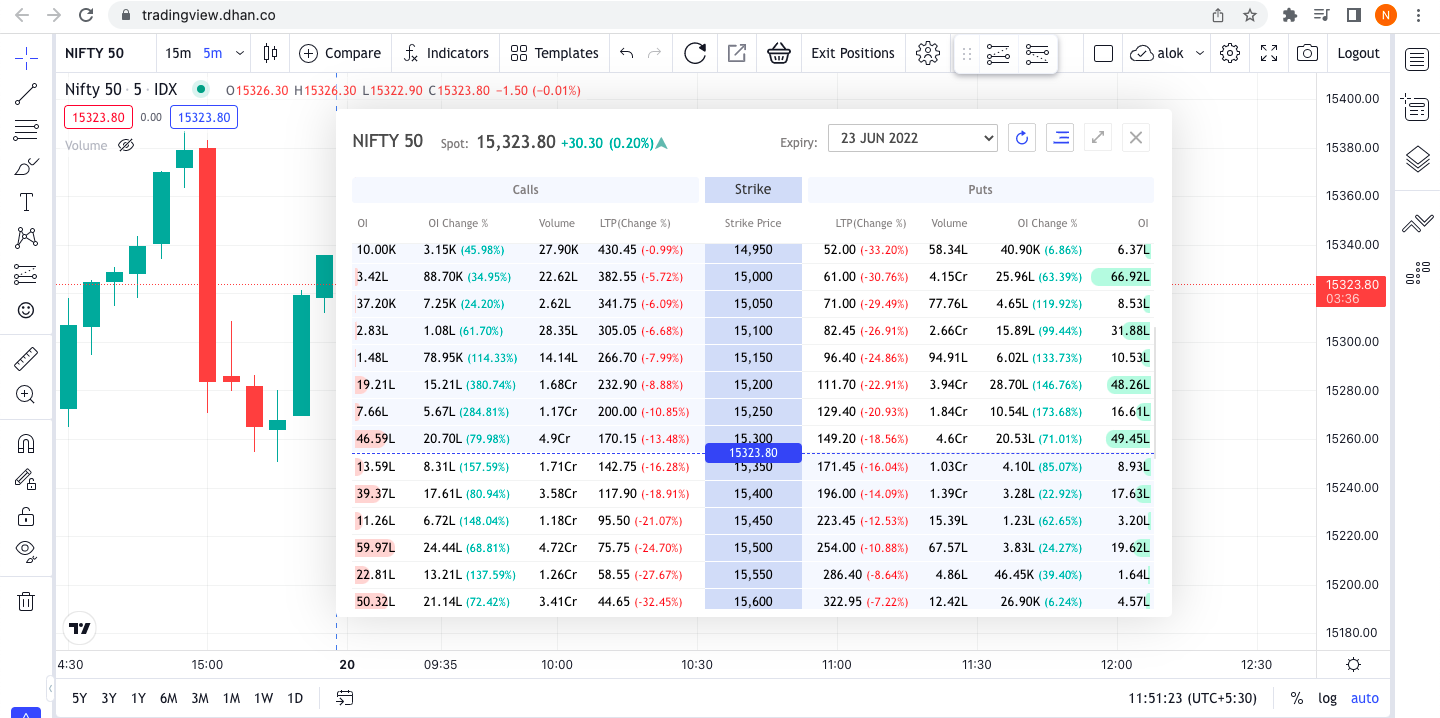
For Options Traders, only watching the charts, ladder, or price action is not sufficient to place orders.
They need to have a complete view of the markets, see where other people are standing and anticipate the direction before placing a trade.
You can explore these Option Chains on our web trading platform or online trading app. At Dhan, we also have a dedicated Options Trading App especially built for Indian F&O traders.
Conclusion
Option Chain analysis is an effective way of online trading. Once you have selected a stock, you can track the particular sector Index Options Chain of that stock to see whether the sector is showing any sudden movement or not.
Option Chain Data analysis makes online trading easy for you.
Learning how to read Options Chains is a very important skill to master because it can help you make better trading decisions and come out on the winning side more often.
You can also read:
- How to Trade Effectively by Trading Directly from Charts?
- What is Algo-Trading and How Useful Is It for Day Traders?
- What is BTST Trading – Meaning, Advantages & Shortcomings
Happy Trading 📈
Comments are closed.