


What is a Mutual Fund Load?
Investing in mutual funds carries charges that an investor has to pay and thus should know about. One…
What is Switching in Mutual Funds?
A significant number of mutual fund investors buy regular mutual funds recommended or sold by their Bank RM…

How to Learn about Mutual Funds?
Investing in mutual funds online can be a great way to grow your wealth over time, but it’s…

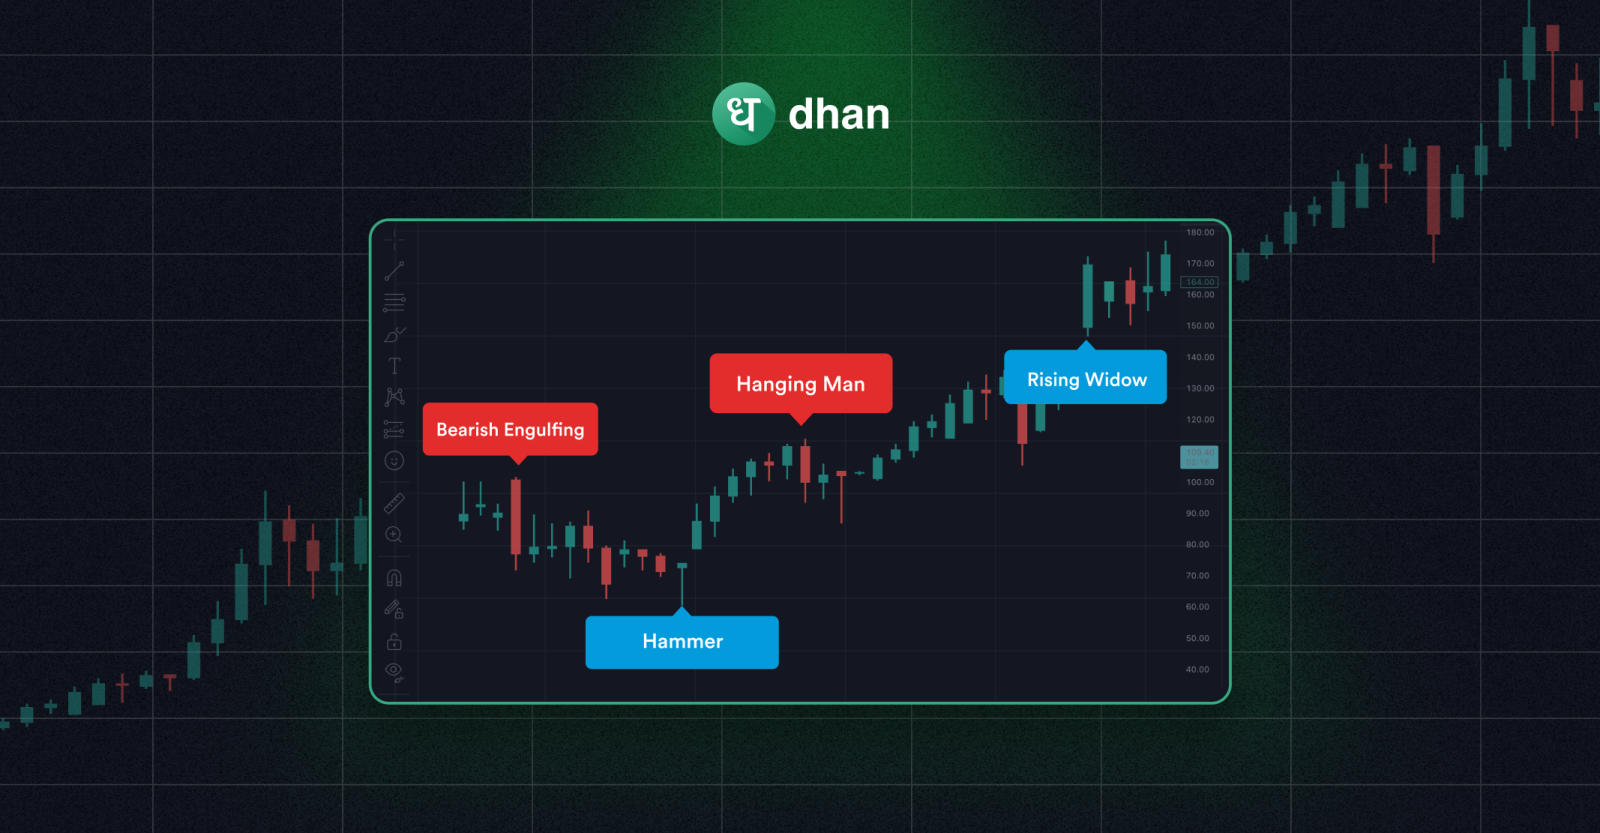
Bonus Shares in India – Most Bonus-Giving Shares
Bonus share or Bonus issue refers to a non-chargeable auxiliary share provided to the shareholders as a bonus.…
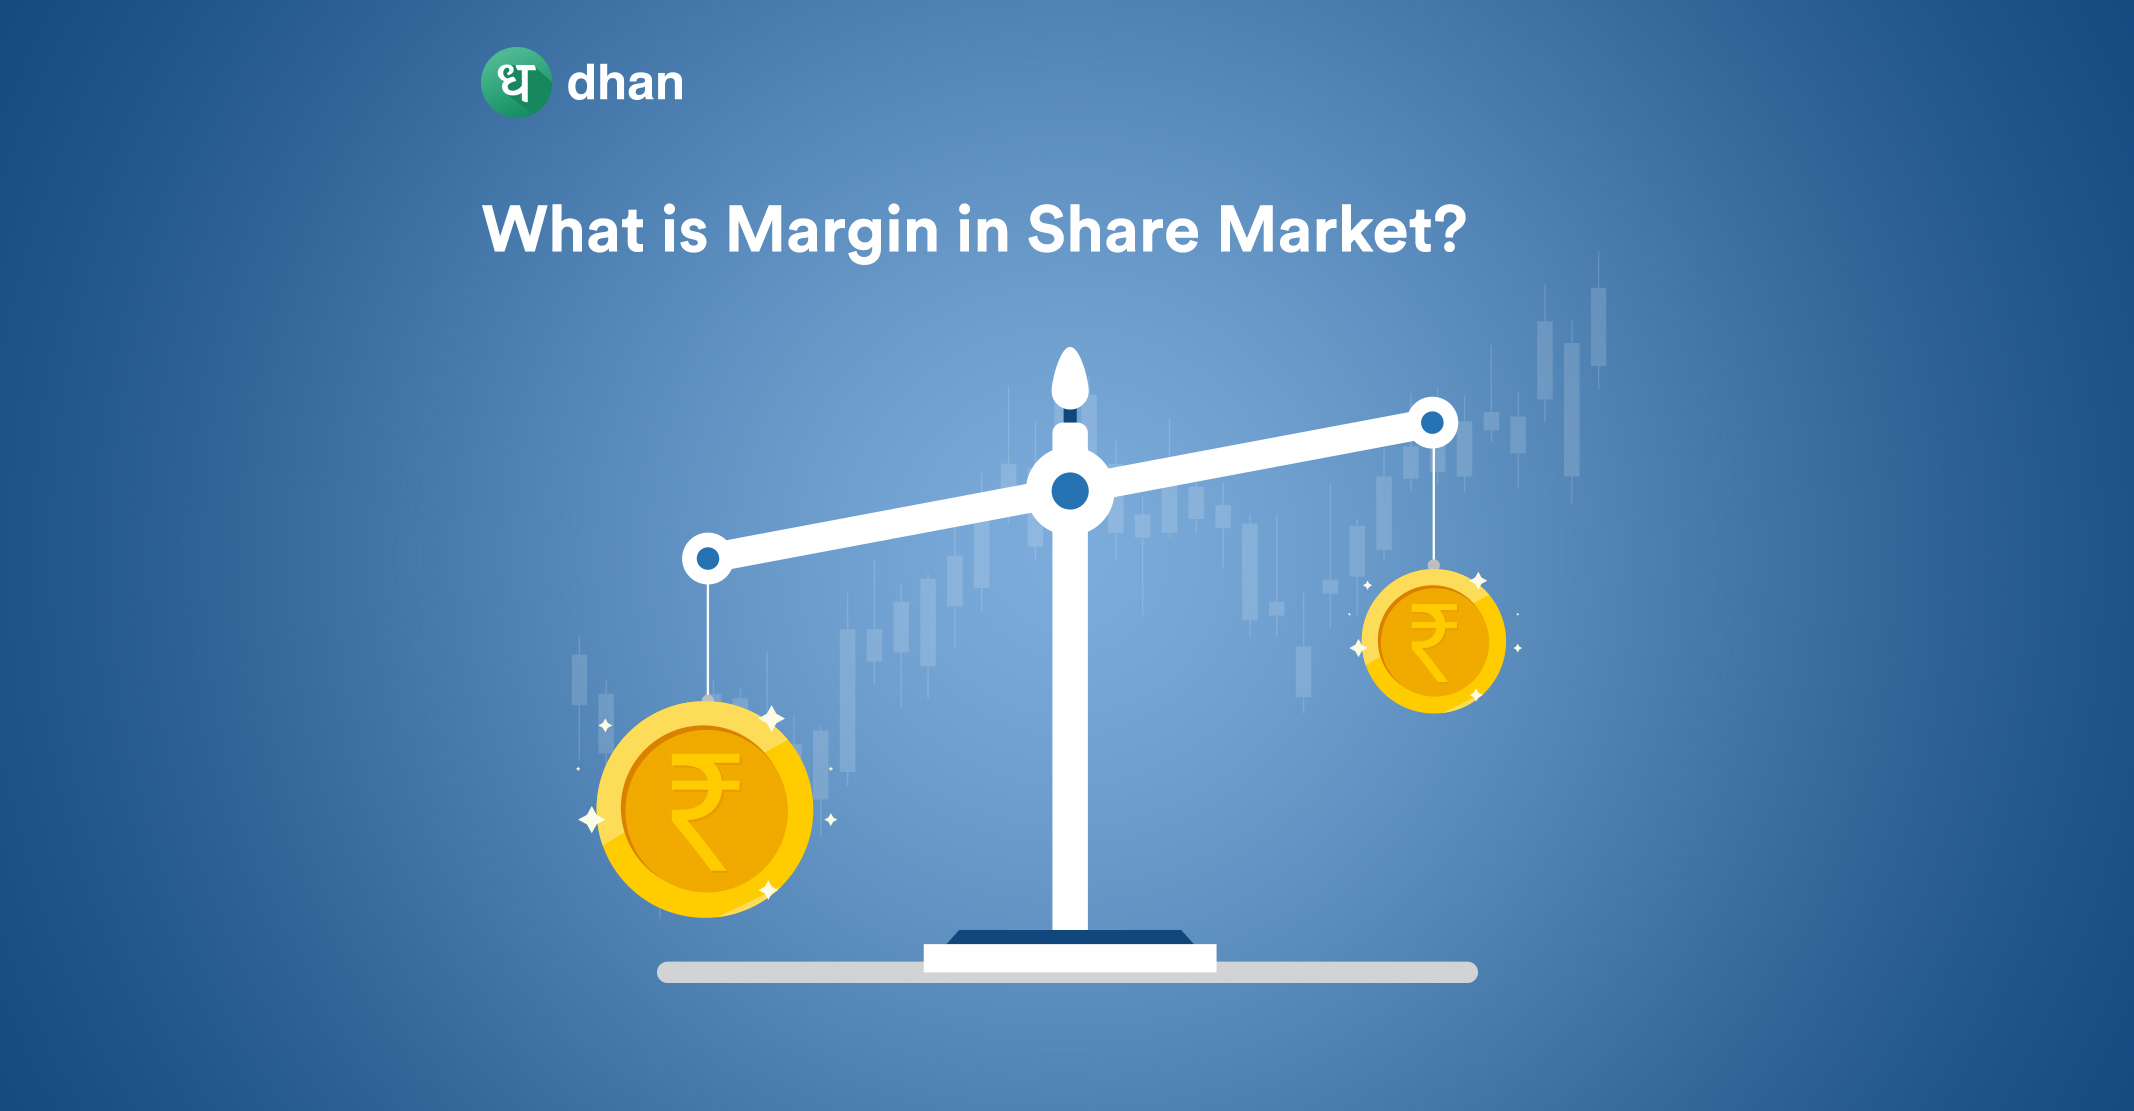
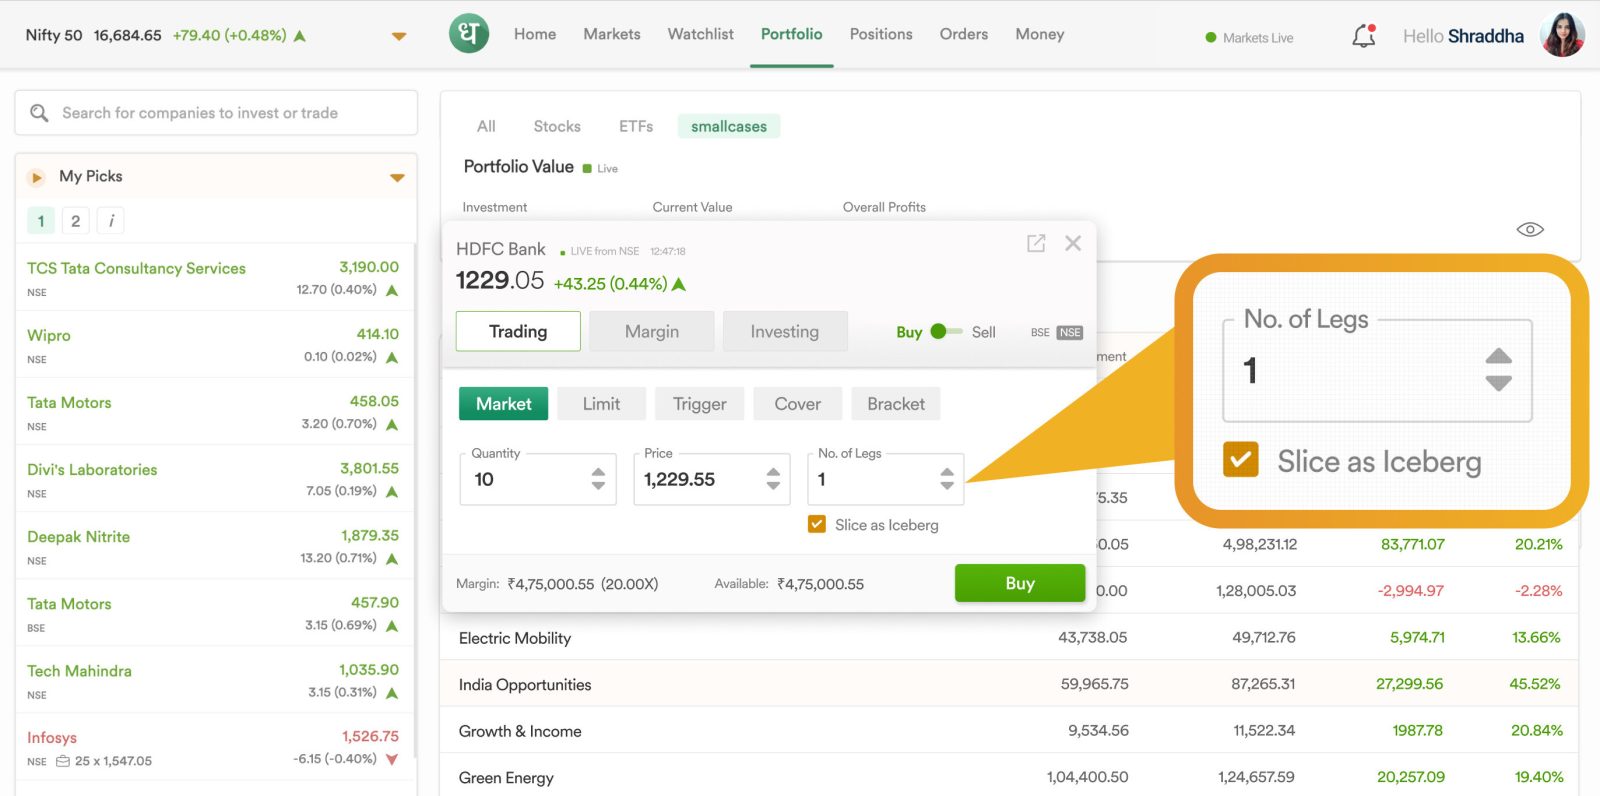
What is Margin in Share Market?
Margin in share market empowers you to buy shares or take positions in commodity and currency derivatives. But…
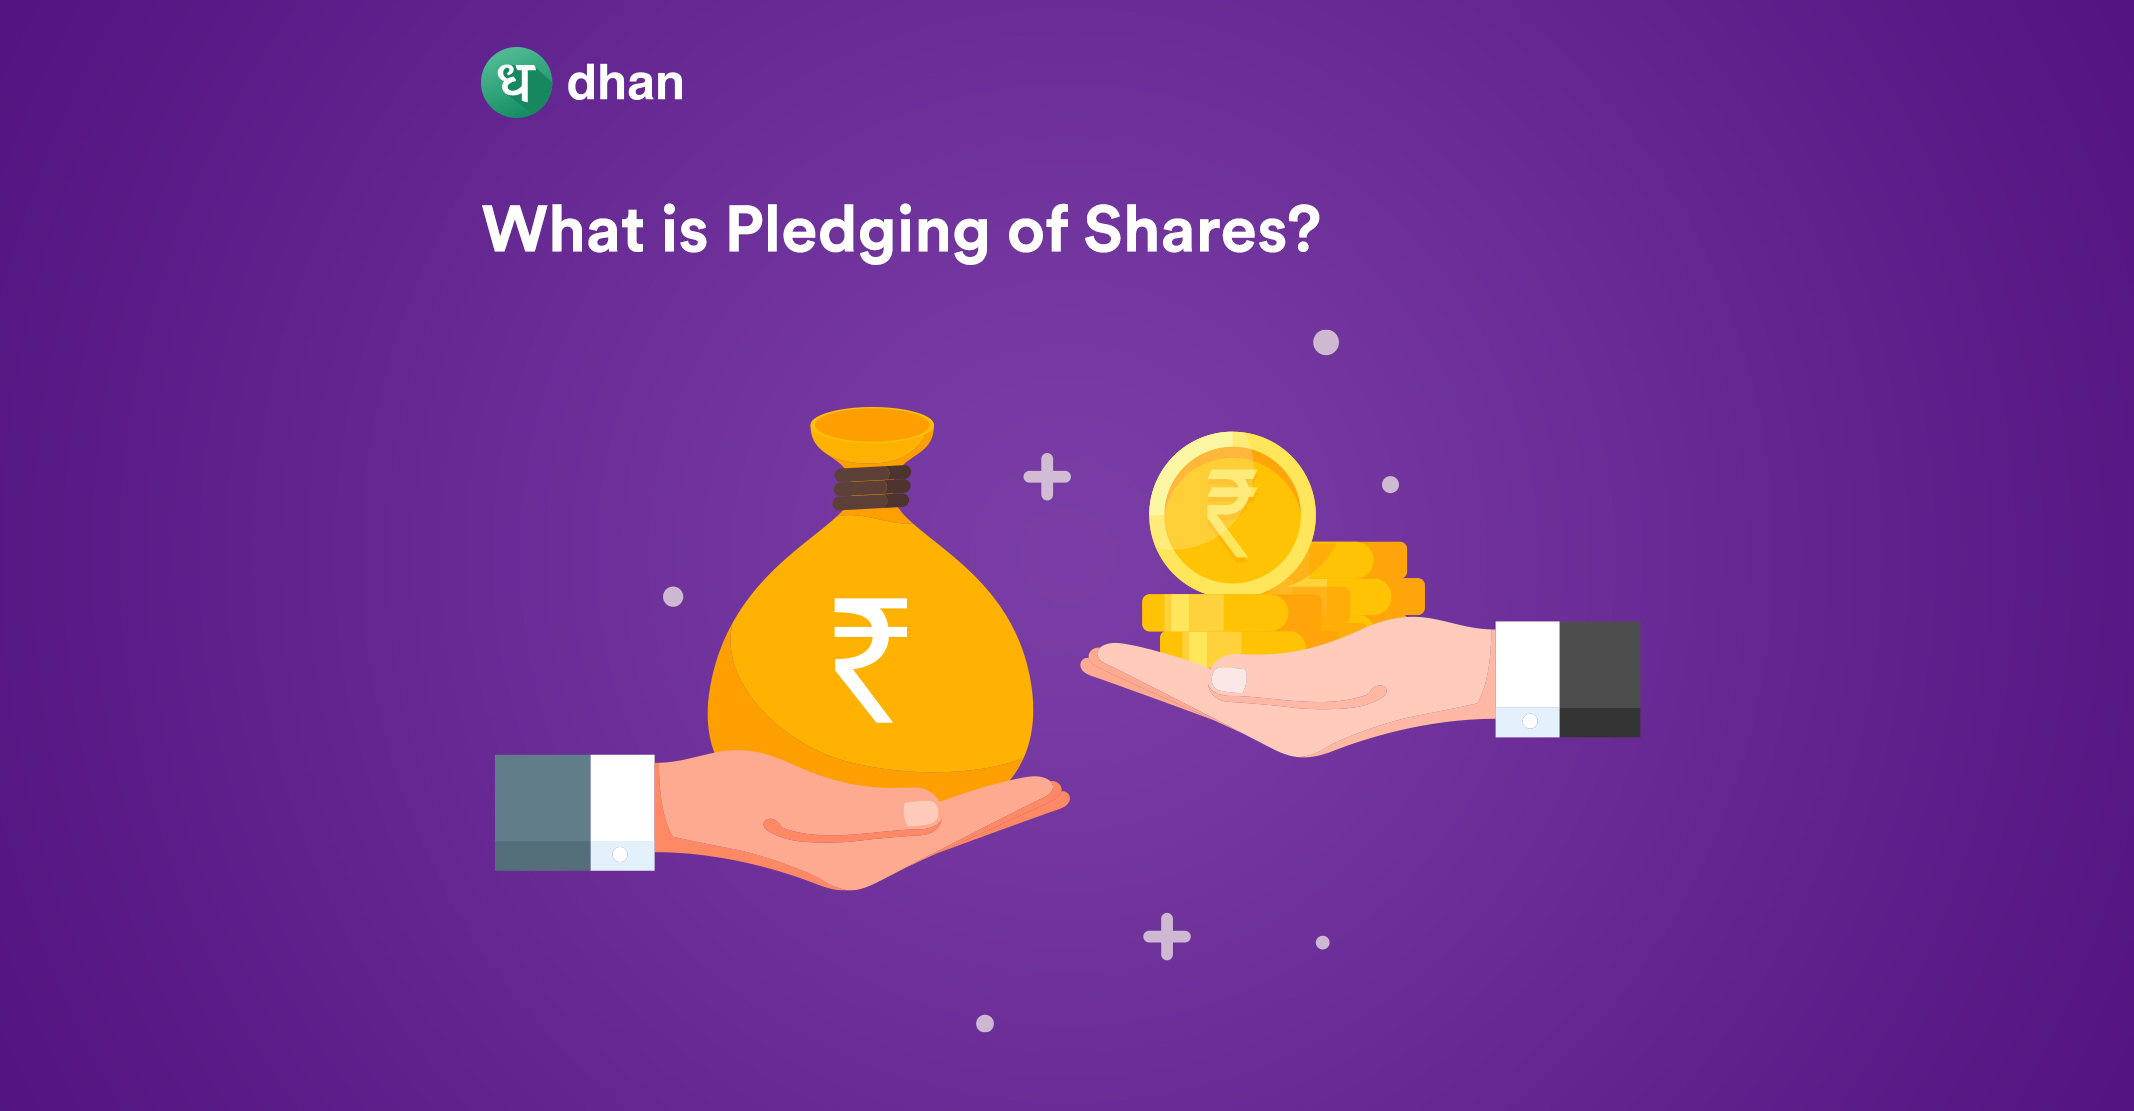
What Is Pledging of Shares?
You might have come across the term “pledging” while share trading online. The concept is popular amongst traders…
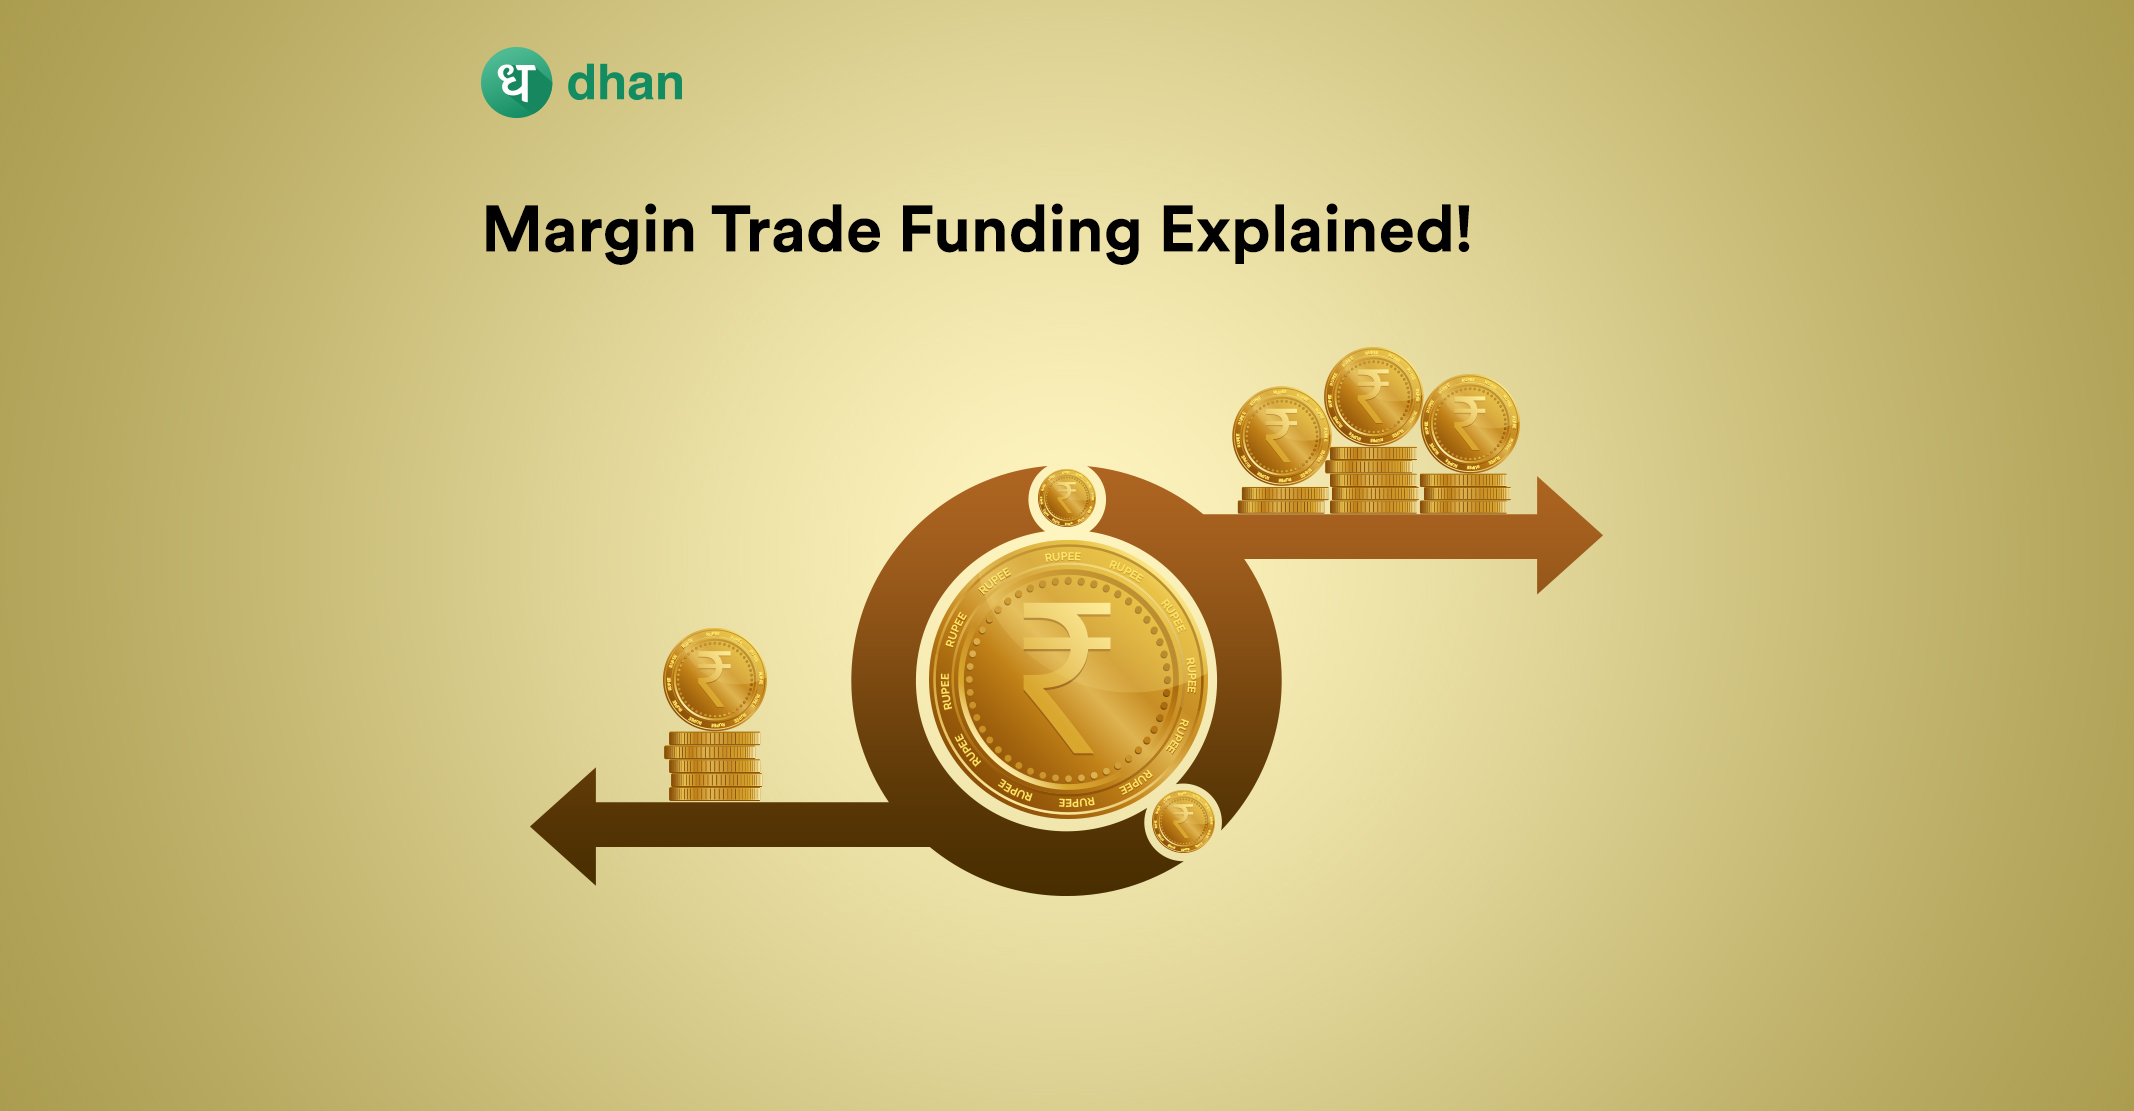
Margin Funding Meaning: What is Margin Trade Funding?
You’re a swing trader or a BTST trader but… you don’t have enough capital and suddenly, there’s a…
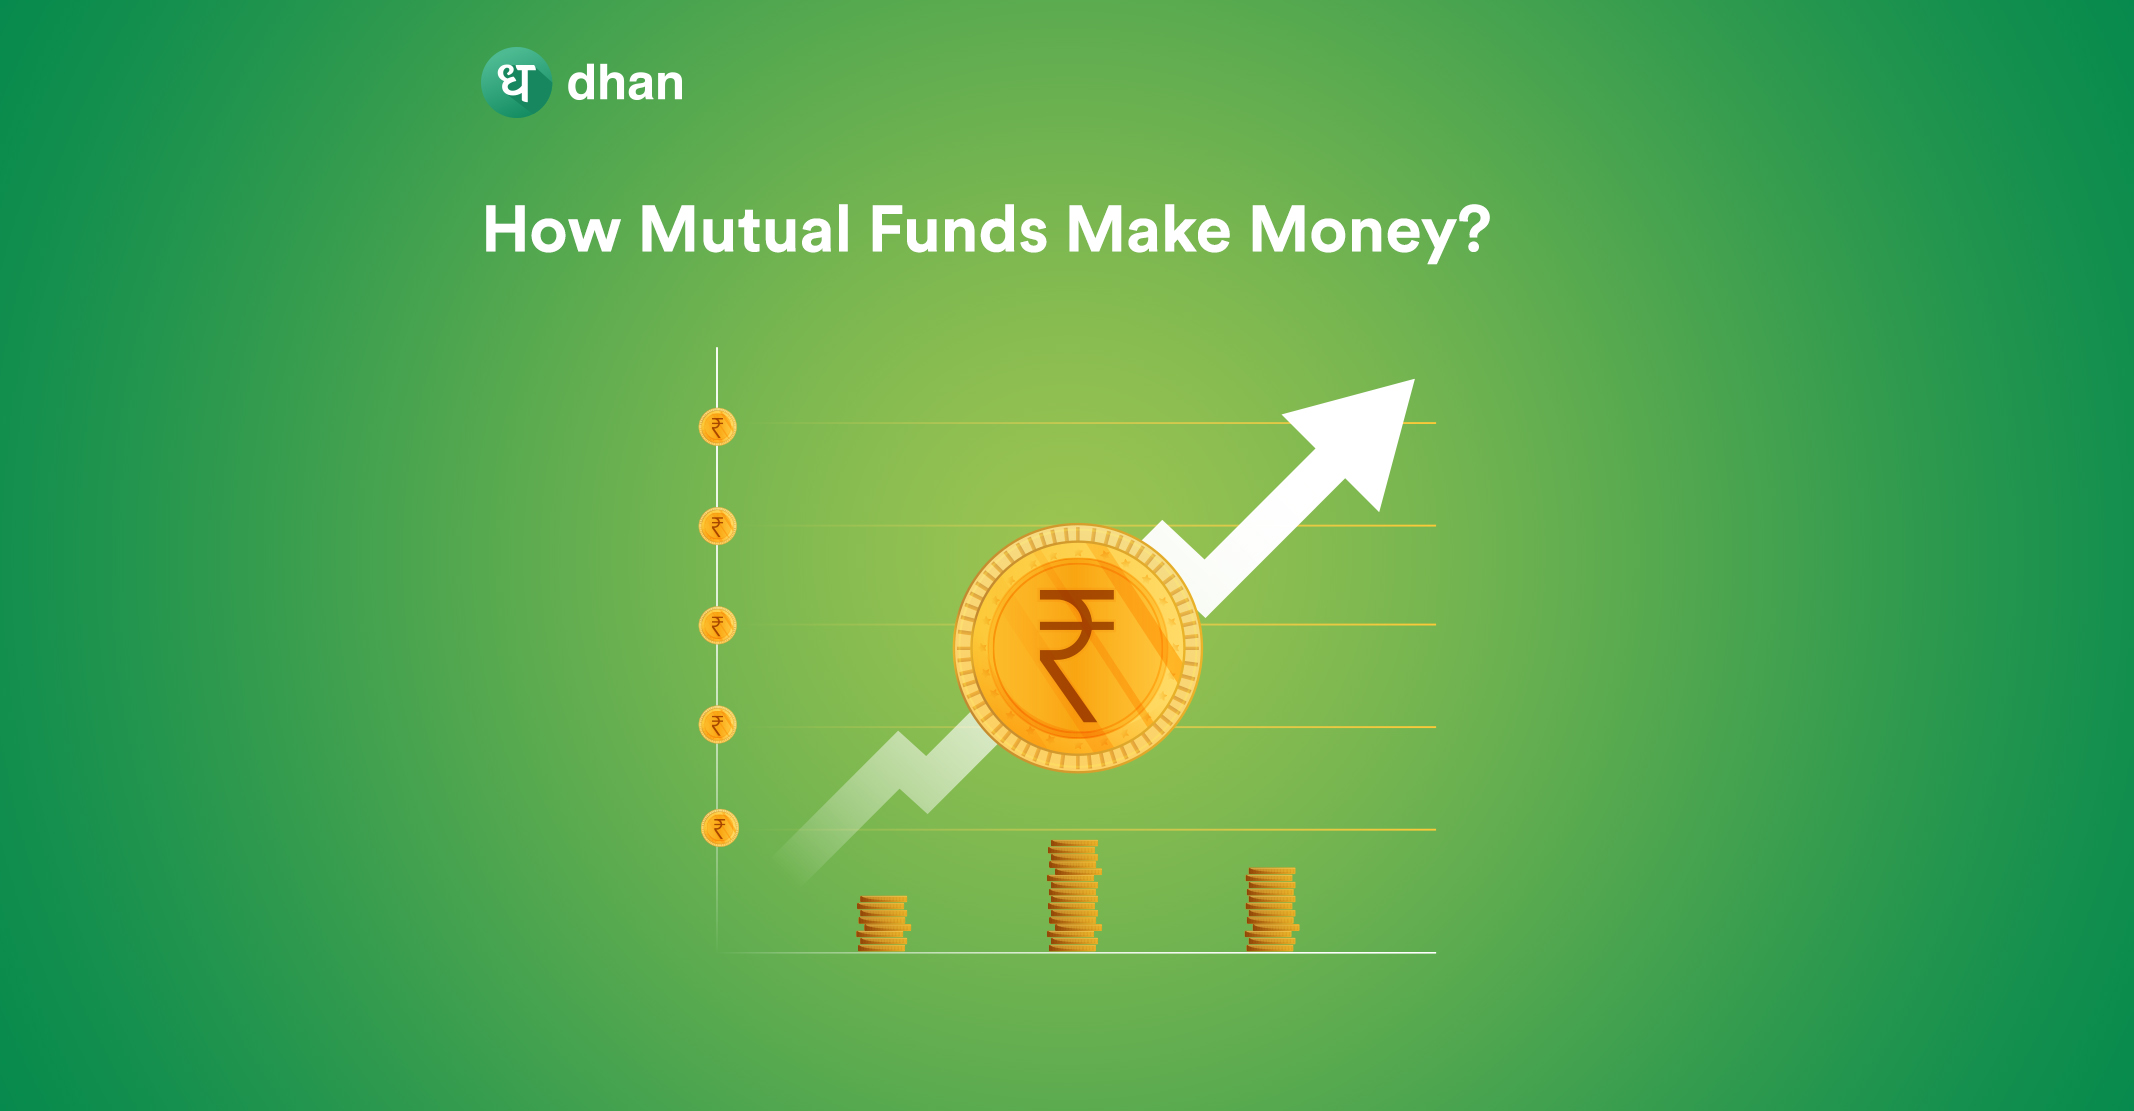
How Mutual Funds Make Money: ₹39.46 Trillion Industry!
Mutual funds not only earn for an investor like you but also for asset management companies, advisors, and…
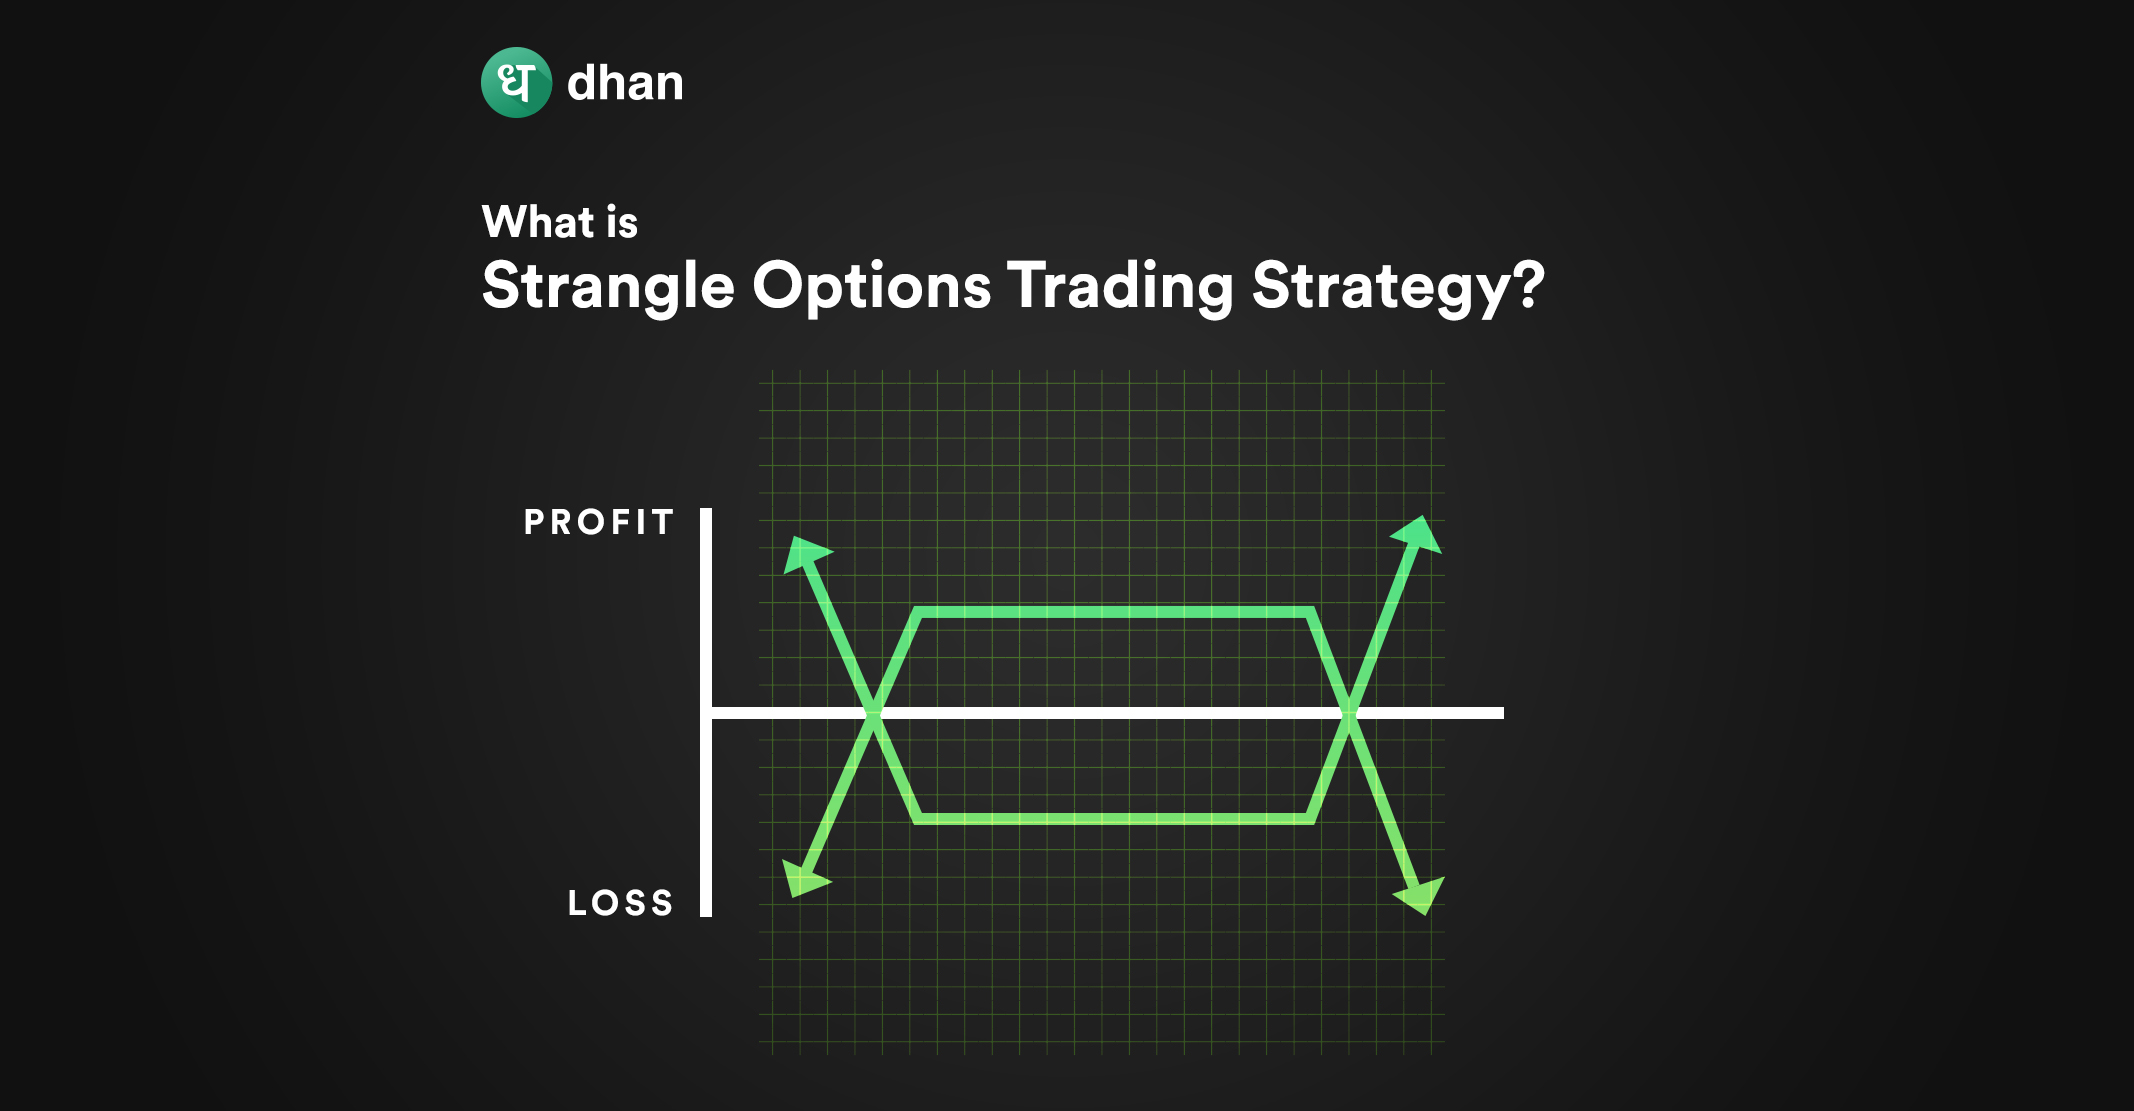
Strangle Option Strategy: What it is & How it Works!
The stock market is an interesting place from an analysis perspective. Even the smallest news (good or bad)…
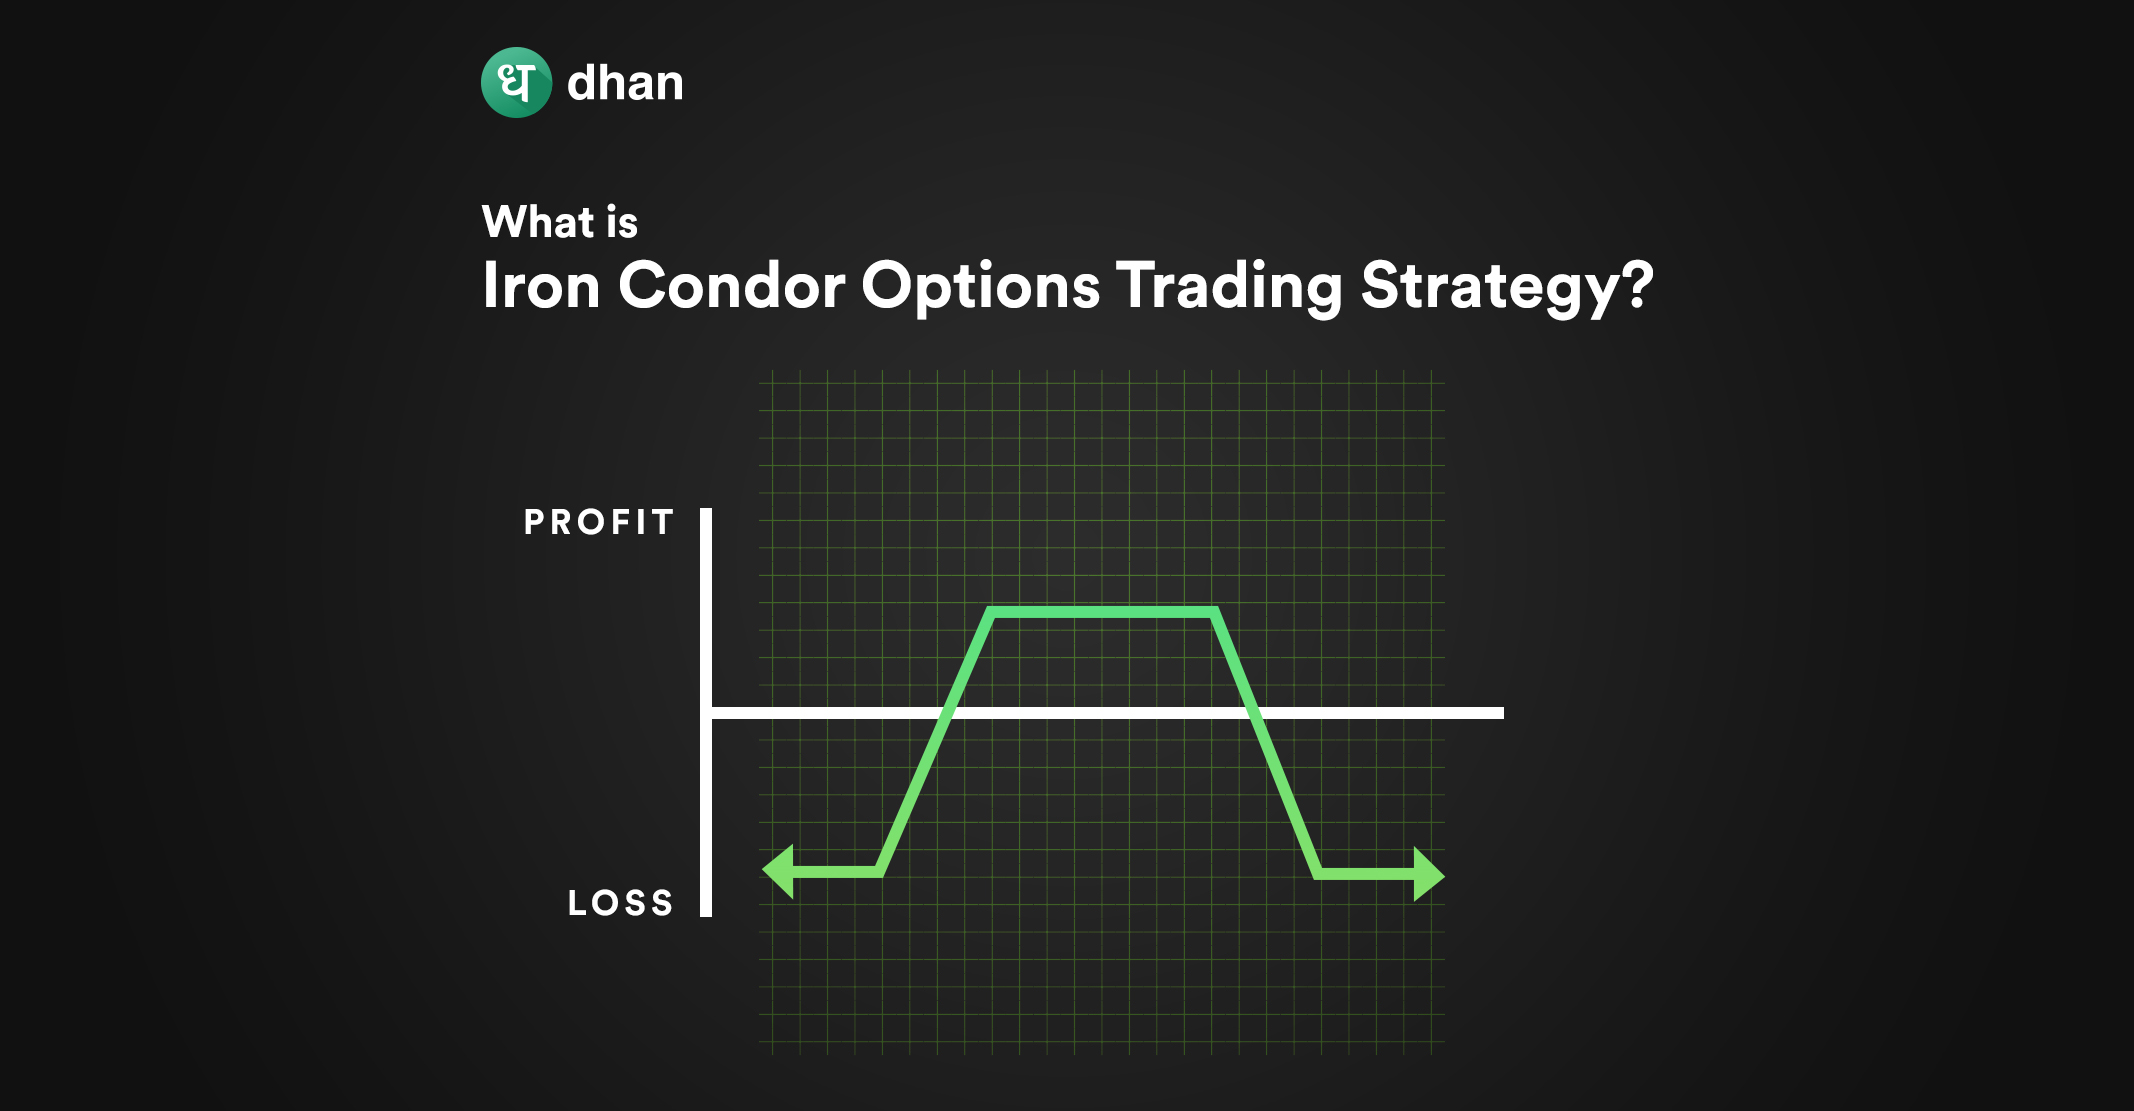
What is Iron Condor Strategy?
Imagine if a financial security expires worthless, you get to take home a decent profit. Sounds whacky, right?…