Price movements happen over a length of time, but how do you analyze them effectively to reveal the insights that can help you make money? The answer lies in selecting the best trading timeframe.
Timeframes reveal varying levels of detail for each financial instrument, helping you dissect what has happened and translate it to what may happen during online trading.
It is the cornerstone of technical analysis, and in this blog, we’ll help you understand how to determine the best trading timeframe for beginners.
What is Timeframe in Trading?
A timeframe is a specific duration of time over which financial instruments are analyzed on charts. It can also refer to the time elapsed between price movements displayed on candlestick charts.
Either way, timeframes on charts are crucial in trading analysis as they reveal patterns, trends, and reversals useful for determining entry and exit points. Timeframes are of these types:
- Seconds
- Minutes
- Hours
- Days
- Months
- Years
Each of these timeframes allows you to zoom in or out of price movements as they’ve happened.
Shorter timeframes are used for scalping and day trading while medium timeframes are used for swing and delivery trading.
Long-term investors are known to use longer timeframes as they reveal more clear price trends, uncluttered by short-term noise.
The best part is that trading timeframes are flexible and you as a trader can choose one that works for you based on your outlook.
How to Select a timeframe for Trading?
Picking the right timeframe isn’t an easy task. However, understanding certain aspects of trading and technical analysis can make it easier.
First, you must pay attention to the time of the day.
The earlier half of the market is known to be the most volatile because the financial instrument absorbs the pre and post-market news. This leads to phenomena such as gap up and gap down.
After 9:30 AM, the volatility is known to settle down in the second half, the volatility tends to be at its lowest. That said, yeh stock market hai boss. Anything can happen at any time.
Thus, you must select a timeframe according to your trading style and holding period. Here is a suitable timeframe for different types of traders:
- Scalper: A trading style as quick and intense as scalping requires a 1-minute to 15-minute chart timeframe. Some scalpers are known to use seconds charts too.
- Day Trader: As a day trader, you can use 15-minute or 60-minute charts to analyze the starting trend. You can also use a 5-minute chart to analyze the very short-term price trend.
- Swing Trader: A 60-minute chart to analyze the swings is known to be the norm. You can use weekly charts so that you can hold a stock for a few days or weeks.
- Position Trader: As a position trader, you can use weekly or monthly charts to analyze the long-price trend so that you can hold the stocks for months or years.
The Best Trading timeframe for Beginners
If you’re just starting with trading, then it’s logical and reasonable to analyze securities on a longer timeframe.
This will allow you to cut out unnecessary noise and have a better view of the scrip/market compared to shorter timeframes.
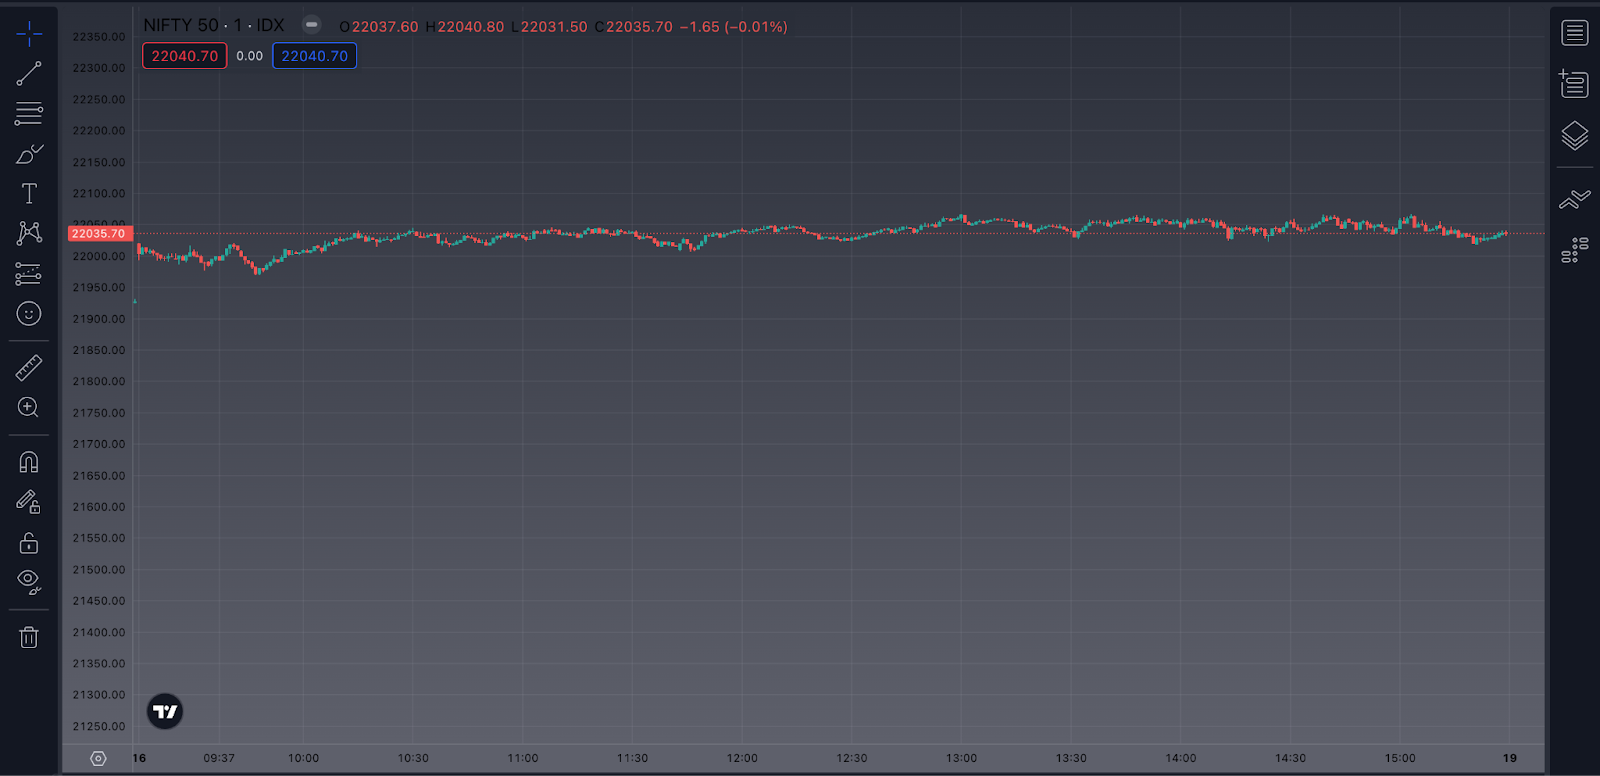
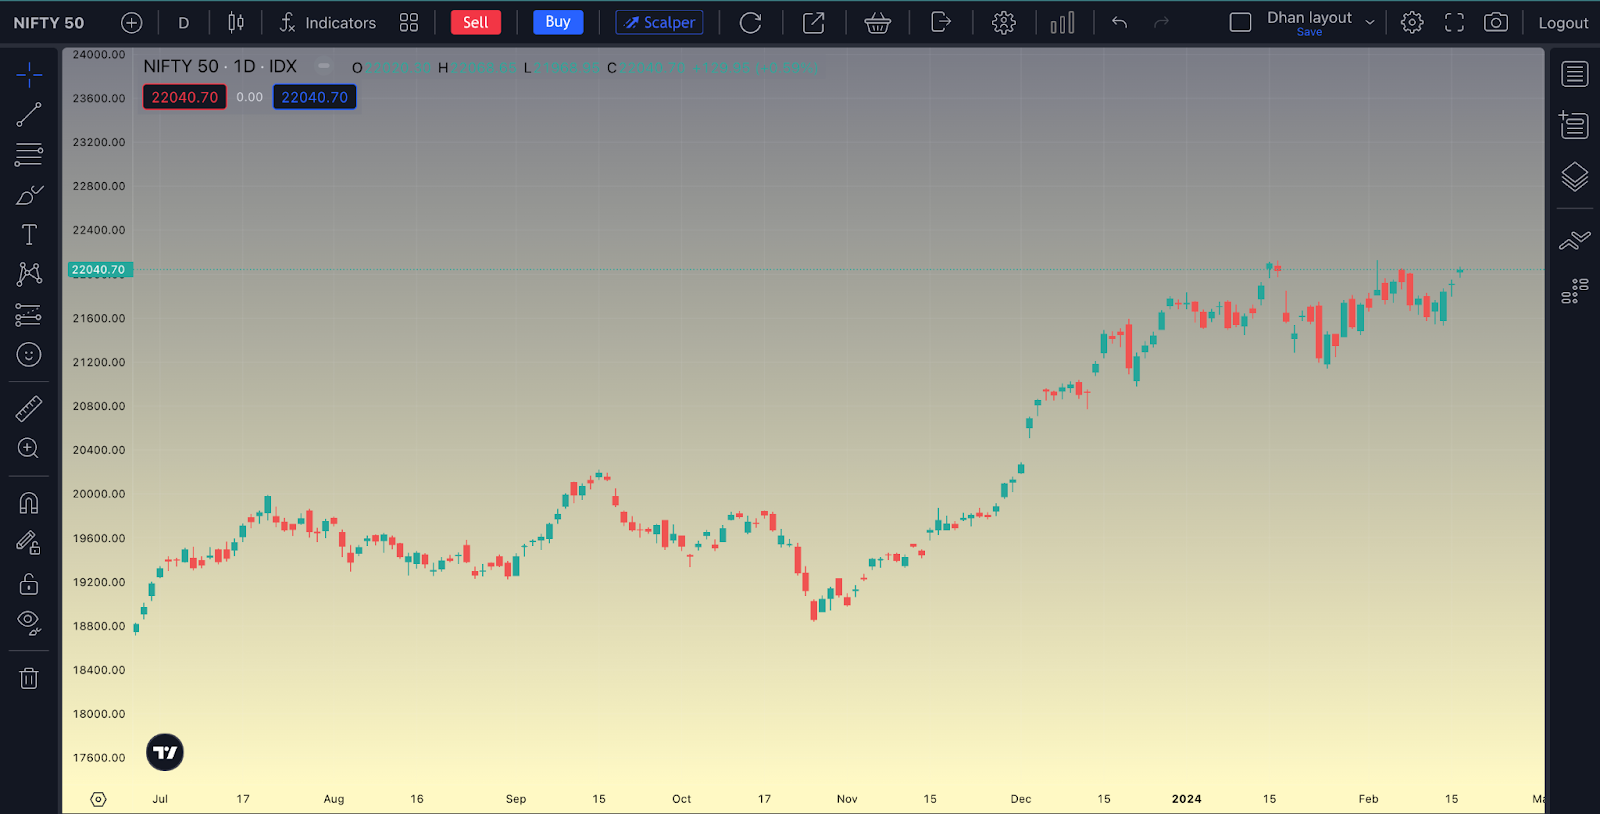
Check the image below to know the different patterns denoted by short and long timeframes.
Moreover, a longer timeframe requires less monitoring. You won’t be glued to your chart and instead, you can spend more time analyzing or studying the market.
All this being said and done, the ideal timeframe for you will depend on your trading style, financial goals, and trading plan.
Is There a Perfect Time to Trade as a Beginner?
There’s no such thing as the perfect time to trade as a beginner. However, there are some general principles that you can turn to.
Volatility is known to be the highest during the earlier part of market hours, subsiding as the day progresses.
But then a sudden piece of news can trigger high volatility and liquidity anytime during the day, and such periods allow you to benefit from market conditions.
Wise traders typically build out their trading system and obsess over making it risk-proof.
That’s what you should focus on while trying to figure out the best time to trade as a beginner. Trade when you can spare dedicated time and focus.
Conclusion
The timeframe in trading means the time horizon in which you study a particular chart.
There are different types of timeframe charts such as monthly, weekly, daily, or minute charts which you can use as per your requirements.
Analyzing financial securities across timeframe charts allows you to study the price trend and reversal to make better trading decisions.
Choosing the right timeframe is key in trading. Remember, there’s no one-size-fits-all approach. Find what works for you and stick with it.
While there’s no best time to trade as a beginner, you can choose periods of high liquidity to enter and exit the market as per your trading setup.
FAQs
Q. Which timeframe is best for beginner traders?
The best timeframe for beginner traders is the 15-min chart if the purpose is to buy and sell stocks within the same trading day.
Q. Which chart timeframe is best for trading?
The best chart timeframe for day traders is the 15-min or 30-min charts. For scalpers, it is the 3 or 5-minute charts.
Q. What is the best time to start day trading?
The best time to start day trading is after 9:30 AM because till this time the market’s opening volatility gets settled.
Q. What is the perfect timing for trading?
9:30 AM to 10:30 AM is known to be highly volatile, allowing day traders and scalpers to get something out of the market. Once the market settles, swing traders and position traders are known to reap more rewards.