There are over 4,000 stocks in the market and choosing the right stock for swing trading is nothing short of identifying a needle in a haystack. In this blog, we will cover the methodology behind how to select stocks for swing trading.
What is Swing Trading?
Swing trading is a type of trading that involves capturing price swings that happen over the short to medium term.
These swings are a part of a larger trend which can be revealed by choosing the right timeframe for swing trading.
While holding a position for days to weeks, a swing trader ensures that they carefully select financial instruments and carry out research through technical analysis. Some even incorporate fundamental analysis.
The focus of a swing trader remains on earning incremental profits from each trade, eventually adding up to a substantial return on their investment.
Swing trading offers flexibility for traders who can’t monitor the markets all day, allowing them to capitalize on intermediate price movements while avoiding the noise of short-term fluctuations.
How to Select Stocks for Swing Trading?
The following pointers will answer how to select stocks for swing trading in India.
- Manage Risk: Implement proper risk management techniques such as setting stop-loss orders and position sizing to protect your capital.
- Trade Liquid Stocks: Choosing a stock with high trading volume ensures that your transactions will go through with minimal slippage.
- Engage with Volatility: For swing trading to exist, there needs to be swings so ensure that there’s sufficient price volatility to generate potential profits.
- Monitor Price Trends: Identify stocks with clear uptrends or downtrends as these provide better opportunities for swing trading.
- Use Technical Analysis: Technical indicators and chart patterns can help you identify potential entry and exit points.
- Add Fundamental Analysis: Consider combining technical analysis with analyzing the fundamentals of the company (earnings, revenue, etc.) to assess medium to long-term potential.
- View Historical Performance: Track historical price performance to identify patterns or tendencies that may repeat in the future.
- Sector Analysis: Focus on specific sectors or industries that are currently exhibiting strong trends or have favorable market conditions. Conduct sector analysis to identify sectors with robust growth prospects or positive catalysts that may drive stock prices higher.
- Monitor Earnings Calendar: Pay attention to the earnings calendar (upcoming corporate actions) and identify stocks that are scheduled to release earnings reports during your intended holding period. This stands to boost liquidity and volatility.
- Read about News and Events: Stay updated on relevant news and market events that could impact the stocks you’re considering.
Top Tools for Identifying Stocks for Swing Trading
Here are the top 5 tools that can help you identify the best swing trading opportunities:
1. Candlestick Charts
You must have seen technical charts with green-red or white-black candles.
These charts have become synonymous with trading, and represent the price movement over a specific period.
Using candlestick charts, you can gain insights into swings and plan your entry and exit.
2. Volume
Volume tells about the strength of the current price trend. Suppose that some XYZ stock is trading between the support and resistance level and the volume has also been high for the past few days. It means that a breakout can happen and you can make use of it.
3. Moving Average
The Moving Average (MA) is calculated like a mathematical average. You just add the past prices and divide it by the number of days.
Suppose that the stock’s faster-moving MA line crosses the slower-moving MA line from below, then you can see a rising price trend.
4. Relative Strength Index (RSI)
If this momentum indicator’s value is above 70, the stock is overbought and you can consider selling it.
If the RSI value is less than 30, then the stock is trading far below its true value and is oversold.
5. Stochastic Indicator
You can get your answer on how to find stocks for swing trading through a Stochastic Oscillator.
If the XYZ stock shows a reading above 80, then it is excessively bought. If it is below 20, the stock is said to be in an oversold region.
6. Ease of Movement (EOM)
EOM is drawn on a chart where the baseline is zero. When the EOM rises above the zero level, then it shows that prices are rising with much more ease.
Top 6 Best Swing Trading Strategies
Some strategies can help you understand how to filter stocks for swing trading and you can also find entry or exit points.
1. Moving Average Crossover
This strategy involves using the crossover of short-term and long-term moving averages as signals to enter or exit trades.
You can look for a bullish crossover as a buy signal and a bearish crossover as a sell signal.
Bullish crossovers happen when the short-term moving average crosses and moves above the long-term moving average.
Bearish crossovers happen when the short-term moving average crosses and moves below the long-term moving average.
Swings traders typically use stop-loss orders based on the distance between the moving averages.
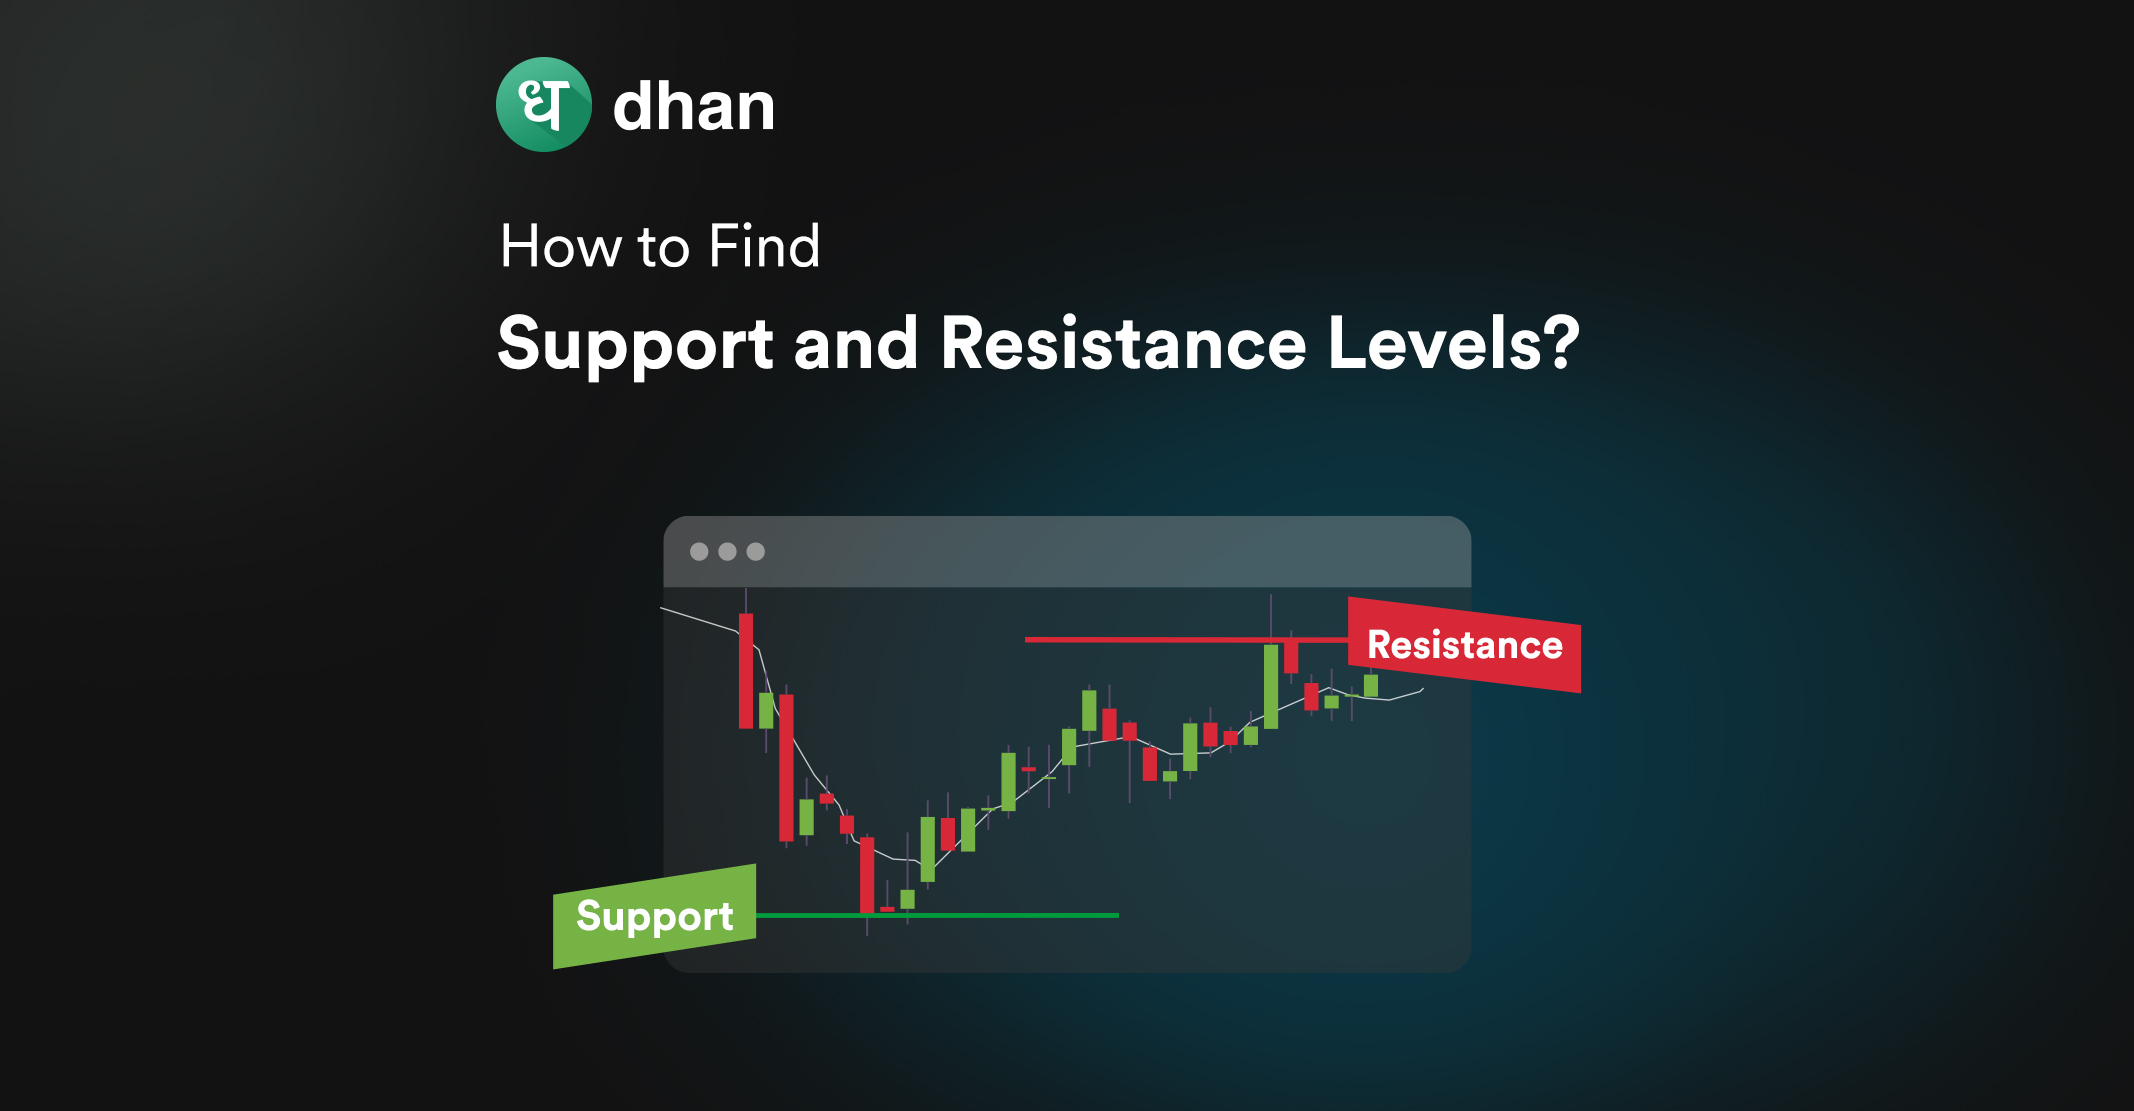
2. Breakout Trading
Breakouts happen when the price of the stock you’re tracking crosses a key resistance level on charts.
Most swing traders would enter long positions when the price breaks above resistance, anticipating a continuation of the uptrend.
Stop-loss orders are placed below the breakout level to limit potential losses.
3. Pullback Trading
You could say that pullbacks are the opposite of breakouts, in that you wait for a stock to pull back from an uptrend to a support level.
Once it hits that level, you’ll be able to enter long positions at a lower price.
Swings traders look for signs of a bounce off the support level to confirm the continuation of the uptrend.
Stop-loss orders are typically placed below the support level to manage risk.
4. Trend Reversal Trading
Trend Reversal Trading involves the identification of trend reversals to enter counter positions, meaning entering the opposite direction in anticipation of the reversal of the current trend.
Stop-loss orders are placed to limit potential losses if the reversal does not occur.
5. Range Trading
Range trading is based on trading within the price range of a stock that is moving sideways or consolidating.
You’d typically buy near support levels and sell near resistance levels, aiming to profit from price oscillations within the range.
Stop-loss orders are placed outside the range boundaries to manage risk in case of a breakout.
6. Fibonacci Retracement
Fibonacci retracement levels are used to identify potential support or resistance levels where the price may reverse or continue its trend.
Swing traders use 38.2%, 50%, and 61.8% retracement levels to identify areas of confluence with other technical indicators or chart patterns.
Stop-loss orders are placed below support levels or above resistance levels identified by Fibonacci retracement.
Conclusion
Swing trading is a popular method that trades use to make quick profits from small price changes.
This trading technique helps in reducing the risk as you can change your position and portfolio in the stock market easily according to market conditions.
It is famous because you can keep the stocks for a few days or some weeks based on your risk appetite and goals.
However, you must know how to select stocks for swing trading using multiple indicators such as volume and retracement levels.
FAQs
Q. How do you screen for the best stocks for swing trading?
For swing trading, you can do the screening of stocks based on previous returns, high liquidity, and low volatility.
Q. How do you choose breakout stocks for swing trading?
You can choose breakout stocks based on support and resistance levels. You can buy a stock when its price breaks above resistance. Also, you can sell it when its price breaks below the support level.
Q. What is the most successful swing trading strategy?
SMA, or Simple moving averages is a simple and successful swing trading strategy. Suppose the ABC stock’s 10-day SMA line crosses the 20-day SMA line from below. It means stock prices are moving upwards.
Q. Which time frame is best for swing trading?
You can use the weekly or daily time frame charts for swing trading. You can use charts above the 1-hour time frame to analyze long-period price trends.