



IV Rank vs IV Percentile






Implied volatility is one of the most important variables to consider when trading options. It reflects the market expectation of how much an underlying asset may move over a given period and has a direct impact on option premiums.
But looking at the current IV number alone does not tell you whether options are relatively expensive or inexpensive compared with their own history.
This is where IV Rank and IV Percentile become useful.
Both metrics put current implied volatility into historical context, but they do it differently. As a result, the same underlying can show a relatively high IV Rank and a different-looking IV Percentile depending on how its volatility has behaved during the chosen lookback period.
That difference matters when selecting an options strategy.
A trader considering a long option strategy may approach a high-IV environment differently from a trader considering an option-selling strategy. IV Rank and IV Percentile can help provide that context, but they should not be treated as automatic buy or sell signals.
What is Implied Volatility?
Before comparing IV Rank and IV Percentile, it helps to understand implied volatility itself. Implied volatility (IV) is the level of volatility implied by the market price of an option.
Unlike historical volatility, which looks at how much the underlying actually moved in the past, implied volatility is derived from current option prices using an option-pricing model.
For example, suppose a stock is trading at ₹1,000. A call option and put option on that stock may have relatively high premiums because traders are pricing in the possibility of larger future movements.
If implied volatility rises while other factors remain unchanged, option premiums generally increase. If implied volatility falls, option premiums generally decrease.
This relationship is important because the same directional view can produce different results depending on the level of IV when the option is purchased.
What is IV Rank?
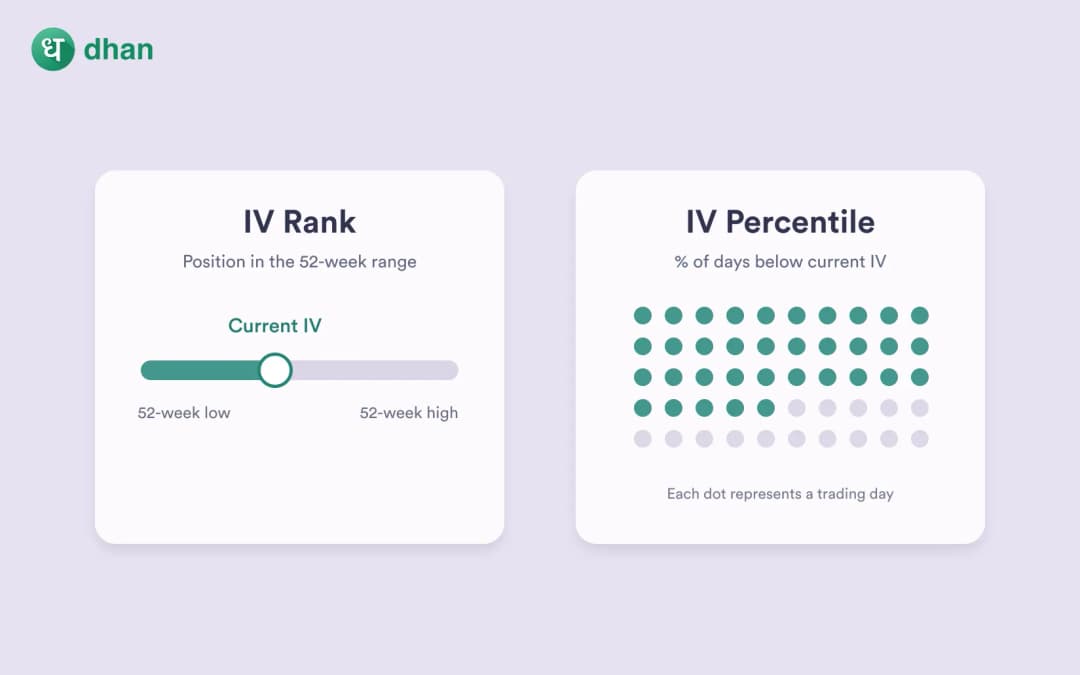
IV Rank measures where the current implied volatility sits between its historical high and low over a specified period.
A commonly used formula is:
IV Rank =(Current IV − Lowest IV )(Highest IV − Lowest IV )100
Suppose an underlying has:
- Lowest IV over the lookback period: 15%
- Highest IV: 45%
- Current IV: 30%
Then,
IV Rank =(30 − 15)(45 − 15 )100
IV Rank = 50%
The current IV is therefore halfway between the historical low and high.
An IV Rank close to 0% means current IV is near its historical low, while an IV Rank close to 100% means it is near its historical high.
What is IV Percentile?
IV Percentile measures the percentage of historical IV observations that were below the current IV.
Suppose an underlying has 100 historical IV observations and the current IV is higher than 70 of them.
Its IV Percentile would be approximately 70%.
This means current IV is higher than about 70% of the observations in the selected historical period.
Unlike IV Rank, IV Percentile does not focus on the distance between the historical high and low. Instead, it focuses on how frequently past IV readings were below the current level.
IV Rank vs IV Percentile
The easiest way to understand the IV rank vs IV percentile difference is to think about the question each metric answers.
IV rank answers the question ‘Where is current IV within its historical high-low range?’, while IV percentile answers ‘How often was historical IV below the current level?’.
Consider an underlying with a historical IV range of 15% to 45%.
If current IV is 30%, IV Rank is 50%.
But if most historical observations were below 30%, IV Percentile could be considerably higher than 50%.
Why can IV Rank and IV Percentile differ?
Shape of the historical IV distribution is a major point of difference between IV rank and IV percentile.
IV Rank depends heavily on the highest and lowest observations. If there was an unusually high IV spike caused by an event, that single observation can stretch the historical range.
IV Percentile does not care how far away the extreme observation is. It cares about how many observations were below the current IV.
For example, imagine an underlying normally trades between 20% and 35%, but IV briefly jumps to 80% during an exceptional event.
After the event, IV falls to 35%.
IV Rank may appear relatively low because the 80% reading has expanded the historical range.
IV Percentile, however, can still be high if 35% is above most of the historical observations.
How IV Rank can help with strategy selection
IV Rank can provide useful context when a trader wants to understand where current IV sits within its recent range.
Suppose IV Rank is very high because current IV is close to its historical maximum. A trader evaluating an option-selling strategy may investigate whether elevated premiums are providing sufficient compensation for the risks involved.
For example, strategies such as short strangles, short straddles, iron condors or credit spreads can be sensitive to changes in implied volatility. A high IV environment may be relevant when evaluating these strategies, but high IV does not by itself make them appropriate.
Similarly, a low IV Rank may be relevant when evaluating long-option strategies because the options may have lower implied volatility relative to the selected historical range.
How IV Percentile can help with strategy selection
IV Percentile can provide a different perspective.
Suppose current IV is above most of its historical observations. A high IV Percentile tells you that the current volatility environment is relatively elevated in terms of frequency.
This can be useful when comparing strategies that have different exposure to changes in implied volatility.
For example, a trader evaluating an option-selling strategy may want to know whether current IV is elevated compared with most historical observations rather than simply sitting somewhere within the historical high-low range.
Likewise, a trader considering buying options may want to know whether the current IV is already higher than a large proportion of its historical observations.
Which is better for option strategy selection?
There is no universal answer because the two metrics measure different aspects of historical IV.
The more useful question is: What are you trying to understand about the current volatility environment?
IV Rank can be useful when you want to know how close current IV is to its historical extremes.
IV Percentile can be useful when you want to know how frequently historical IV was below the current level.
For example, consider two situations.
Situation 1: IV Rank is high
Current IV is close to the historical maximum. This tells you that volatility is near the upper end of its historical range.
A trader evaluating a premium-selling strategy may investigate whether the elevated IV provides enough premium relative to the strategy's risks.
Situation 2: IV Percentile is high
When current IV is higher than historical observations, it can be interpreted as abnormal volatility based on its frequency of occurrence.
A trader can use this information to assess whether strategies exposed to a decline in IV, or strategies that benefit from elevated option premiums, align with the overall trade setup.
What else should traders check?
IV Rank and IV Percentile become much more useful when combined with other information.
- Actual IV level: A percentile or rank without knowing the current IV can hide important context.
- Expiry: IV can differ significantly between near-term and longer-dated options. Comparing metrics across different expiries without accounting for this can create misleading conclusions.
- Expected event: Earnings announcements, major economic releases, policy decisions and other scheduled events can affect implied volatility.
- Option premium: A volatility metric does not tell you whether a particular strike is attractively priced for the strategy being considered.
- Liquidity: Bid-ask spreads and trading activity can affect the practical cost of entering and exiting an option position.
- Expected move: The traders estimate of how much the underlying may move should be compared with the movement implied by option prices.
Conclusion
IV Rank and IV Percentile are useful tools for putting current implied volatility into historical context, but they measure different things. IV Rank asks where current IV sits within its historical range. IV Percentile asks how often historical IV was below the current level.
As both of them show different aspects, traders can use them in combination instead of using them standalone. Traders can use them to understand the current volatility environment before examining option premiums, expiry, expected movement, liquidity and the specific risk profile of the strategy.
FAQs
What is the main difference between IV Rank and IV Percentile?
IV Rank measures the current IV's position between its historical high and low. IV Percentile measures the percentage of historical IV observations that were below the current IV.
Is a high IV Rank bullish or bearish?
IV Rank does not indicate market direction. A high IV Rank simply means current implied volatility is relatively close to its historical high within the selected lookback period.
What does a high IV Percentile mean?
A high IV Percentile means current IV is higher than a large proportion of the historical IV observations in the selected period. It indicates that the current volatility level is relatively elevated compared with those observations.
Does high IV mean options are expensive?
High implied volatility generally contributes to higher option premiums, all else equal. However, whether an option is attractive or expensive depends on factors such as the expected future movement, strike, expiry and the volatility actually realised later.
Why do IV Rank and IV Percentile sometimes show very different values?
The two metrics use different methods. IV Rank depends on the historical high and low, while IV Percentile depends on how many historical observations were below the current IV.