



Correlation Trading Strategy







Key takeaways
- Correlation trading technique involves establishing the degree to which two assets tend to move together (using -1 to +1 correlation coefficient) and trading those situations where the relationship becomes stretched or broken.
- In India, there are three such pre-established pairs which can be studied, viz. Nifty-Bank Nifty, Gold-Rupee, and Crude Oil-Rupee pairs, all because of some structure-based relationship.
- Correlation is dynamic and changes with time frames, often going closer to +1 at times of market stress, when one needs it the most and least.
There is an old adage about trading on Dalal Street. No stock ever moves alone. Wait long enough, and you will witness it.
HDFC Bank falls, and Bank Nifty follows suit. Crude oil rallies overnight, and the rupee already reacts the next morning.
It is this kind of movement that forms the basis of a correlation trading strategy. Instead of speculating on the future direction of a stock or an index, you observe the correlation between the movement of two correlated assets and capitalise on any unusual divergence.
This guide covers everything from basic principles to actual strategies: What correlation is, three Indian market correlations you should research first, how to design and implement your strategy, and common mistakes beginners fall prey to.
What Correlation actually measures?
A correlation trading strategy relies on one simple statistic: the correlation coefficient, denoted by the Greek letter rho (ρ). It measures the relation between the movements of two assets over a chosen period on a scale ranging from -1 to +1.
The reading of +1 means that two assets move in complete unison. In practice, anything higher than +0.7 is considered significant, and anything over +0.8 is viewed as a very strong relationship.
The reading of -1 means that two assets move in absolute opposition. In such a case, a correlation strategy is just as easy to implement. Finally, a reading close to 0 means that there is no connection between the assets. It is what most randomly selected pairs demonstrate.
Three Indian market correlations worth researching first
One does not have to search for rare combinations to begin with. There are three relationships lying at the heart of the Indian market that behave quite differently.
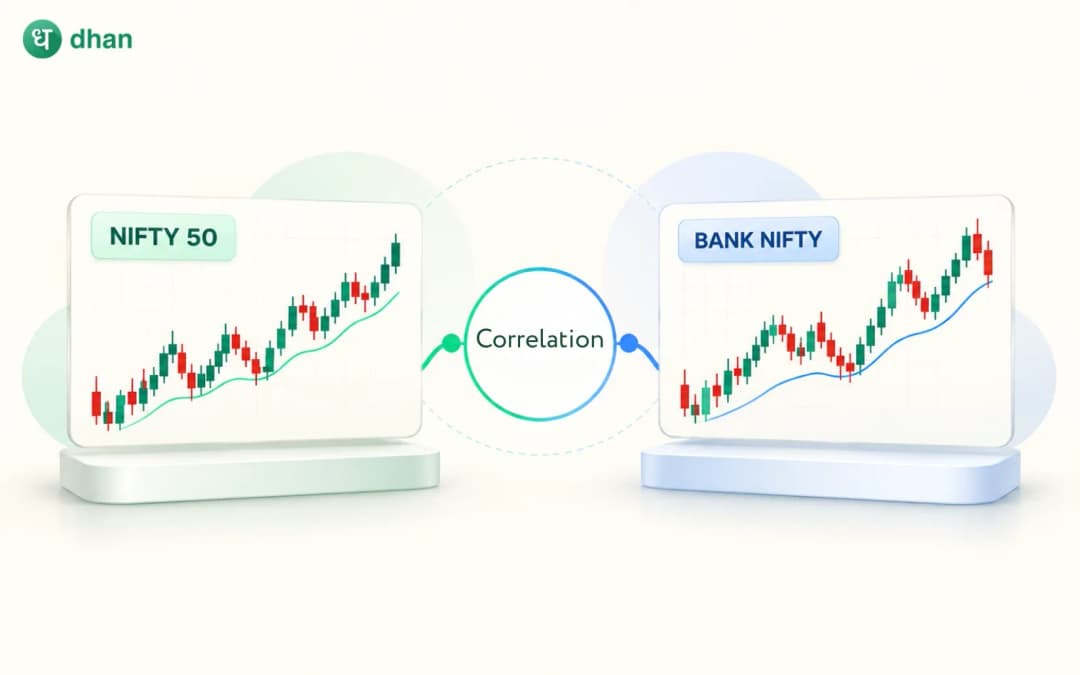
- Nifty 50 and Bank Nifty: A five-year academic study found that the two indices had a correlation coefficient of 0.977. The studies of more recent periods placed it at 0.88. In any case, banking stocks account for such a large weight in Nifty 50 that the two do not diverge easily.
- Gold and the rupee: The price of rupee-denominated gold has a positive correlation of 0.66 with the USD/INR exchange rate. It is a different relationship from the correlation of 0.90 between the dollar and the rupee gold price. A weakening rupee increases the price of imported gold, even if international prices are unchanged, because India is an importer of most of its gold consumption.
- Crude oil and the rupee: India imports most of its oil and, therefore, a rise in the oil price increases the amount of dollars needed to pay for it and puts the rupee under pressure. It is not accidental: the import dependency forms the basis of their relationship.
Correlation changes over your chosen timeframe; always verify it
A pair with a correlation coefficient of 0.90 on a daily timeframe can fall to 0.55 on an hourly one. Correlation is not an inherent property of two assets. It changes over your chosen period and timeframe.
Calculate it yourself based on your intended timeframe; never take the correlation coefficient from another trader's daily chart study and trade on it without double-checking it on your own timeframe.
Building a correlation trading strategy in 5 steps
- Step 1: Choose correlated pairs for sure. Industry is the same, macro drivers are the same, or a common holding firm. Correlation that could be described by one sentence is much more likely than a statistical accident.
- Step 2: Calculate the correlation coefficient for at least two different timeframes, daily and hourly, with the help of a spreadsheet or a charting tool with the correlation overlay.
- Step 3: Monitor the spread between the two, either as a price ratio or as a simple difference and record its typical range for the last few months.
- Step 4: Enter the positions whenever a divergence takes place; go long on the asset that lags and short the one that outperforms, so that rupee exposure is balanced.
- Step 5: Close on reversal towards the historical average or on a hard stop if the spread continues to grow.
Pairs Trading: the classical implementation of this strategy
Quant desks institutionalise the process described above as pairs trading. After confirming the presence of a pair through a chosen correlation threshold, they track the z-score of the spread, its deviation in standard deviations from its historical average.
The spread, which deviates 1.5 to 2 standard deviations from the average, is a common trigger for entry, with the position being closed on its reverting to 0. This strategy works well for Nifty sector pairs as well, such as two private banks or two automobile stocks, driven by similar demand.
Position sizing and risk management
Correlation is not a permanent phenomenon. As shown during the 2008 global financial crisis, correlations across equities, currencies, and commodities surged to +1, destroying the portfolio diversification effect investors relied on for years.
Keep individual trade sizes low compared to your portfolio size, place a hard stop on the spread, rather than on individual legs, and avoid opening new correlation trades around important events, such as RBI policy days or FED announcements, when correlation between assets may suddenly break.
5 Common mistakes beginners make
Here are some common mistakes:
- Mistake 1: The confusion between correlation and causation. In some cases, the link between two financial instruments is not due to their relationship but rather to their response to a third variable, like interest rates or changes in appetite for risk.
- Mistake 2: Trusting a correlation on a single timeframe. The correlation between assets on a daily timeframe can vanish intraday, which is the very time when beginner traders watch it.
- Mistake 3: Failing to research the fundamentals. Without the ability to explain why two assets should move together, a high correlation alone is not enough to trade on.
- Mistake 4: Failure to place a stop loss on the spread. Even though it feels safe in comparison with a pure directional trade, a growing spread with no exit strategy can bring losses.
- Mistake 5: Ignoring liquidity. A correlation trade needs both legs to be liquid enough to enter and exit cleanly, or slippage quietly erodes the edge the correlation was supposed to provide.
Equipment and data to kick things off
Charting takes even more importance here than usual, because you are dealing with comparing two instruments simultaneously instead of reading one chart alone.
Dhan Web's TradingView-powered charts allow you to layer two symbols on a single pane and switch timeframes instantly, while the ScanX screener is a good first filtering tool when you need to find peers in a certain market cap and sector for calculating correlation manually.
Regarding the options leg of the pairs trade, the Options Trader app's open interest and volume scanners can ensure that both legs are liquid enough to make trades without suffering from any slippage. Brokerage on the F&O segment is flat ₹20 or 0.03% of executed order value, whichever is lower, making the cost of trading both legs relatively predictable.
Conclusion
The correlation trading approach makes use of the reality that the market does not just move but moves in webs, and turns it into a process. The approach involves identifying assets which are truly correlated, checking how correlated they are with respect to each other over different periods of time and trading during times when there is a strain and breakage of this correlation.
The initial step is to trade pairs which are relatively smaller and liquid, like Nifty and Bank Nifty, with a hard stop on the spread.
FAQs
Is correlation trading suitable for absolute beginners?
Yes, as long as you start with well-known, liquid pairs such as Nifty and Bank Nifty and practice on paper first. In terms of concept, tracking how two assets move together is easier than tracking most options strategies.
What correlation coefficient should I aim for when entering the trade?
The majority of traders aim for a coefficient above 0.7, while anything above 0.8 is usually considered a good relationship for building pairs. Make sure to check the figure on the same timeframe where you want to trade.
Will a high coefficient of correlation guarantee that assets will keep moving together?
Not necessarily. Correlation is a historical metric, and relationships can break and become weaker, especially in periods of market stress, so a stop-loss on the spread is absolutely required.
What is the difference between correlation trading and pairs trading?
Correlation trading is the concept of exploiting the relationship between two assets. Pairs trading is a special case of correlation trading in which you go long the underperformer and short the overperformer if the price spread moves outside its historical range.
How often should I recalculate the correlation between my assets?
As often as possible, ideally each time you consider trading new positions, rather than using the number calculated some time ago. The correlation may change after earnings reports, policy news, and even sentiment shifts in the entire sector.