



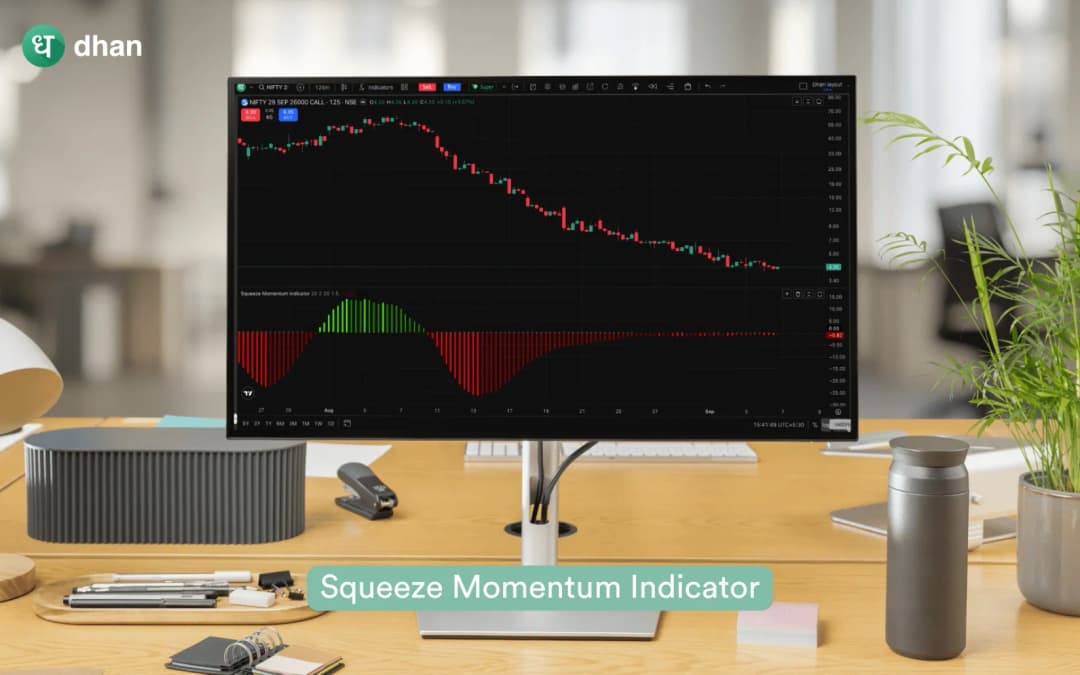
Squeeze Momentum Indicator






Key takeaways:
- The squeeze momentum indicator can be used to spot times when volatility is low and then may increase.
- To detect a squeeze, it combines Keltner Channels and Bollinger Bands.
- Traders can determine if positive or negative momentum is strengthening with the aid of the momentum histogram.
- The indicator can be used in conjunction with risk management, volume, support and resistance, and price action.
Markets don't usually shift dramatically. There are times when the market seems to be waiting for its next move, prices stay in a small range, and volatility decreases.
It integrates a momentum histogram with the connection between Bollinger Bands and Keltner channels. This enables traders to examine both the potential direction of momentum and volatility compression from a single indicator.
It's important to remember, though, that a squeeze cannot ensure that the next move will be upward or downward. It implies that since volatility has decreased, traders should be on the lookout for a possible expansion.
What is the squeeze momentum indicator?
A technical analysis tool for spotting times when price volatility decreases and subsequently increases is the squeeze momentum indicator.
There are two primary parts to the indicator:
- Squeeze condition: Indicates the movement of Bollinger bands within Keltner channels.
- Momentum histogram: Assists in determining if momentum is strengthening or weakening and whether it is travelling above or below the zero line.
Consider the squeeze as a time when there is less activity in the market. The release indicates that volatility is increasing once more.
How does the squeeze momentum indicator work?
Bollinger bands and Keltner channels are two volatility tools that are combined in this indicator.
A 20-period moving average with bands positioned two standard deviations from it is the conventional default option.
Keltner Channels generate an upper and lower channel using a moving average and average true range (ATR).
The market is said to be in a squeeze when Bollinger Bands contract to the point where they move inside the Keltner Channels. This suggests a period of less volatility.
The squeeze is released or "fires" when the Bollinger Bands enlarge and exit the Keltner Channels.
Traders typically look for this shift from compression to expansion.
What do the squeeze dots mean?
Typically, the squeeze momentum indicator shows crosses or dots surrounding a zero line.
Traders should examine the settings of the indicator they are using because the precise colours may differ based on the platform or indicator version.
- A squeeze has begun when there are black spots or crosses.
- The release of the squeeze is indicated by grey dots or crosses.
- The histogram offers further details on momentum.
There is no directional signal provided by the squeeze itself. It indicates that volatility has decreased. The direction of price momentum is then examined using the momentum histogram.
What does the momentum histogram show?
A zero line is where the histogram revolves.
Positive momentum is indicated when the histogram is above zero. Negative momentum is shown when it is less than zero.
Additionally, traders consider whether the bars of the histogram are rising or falling.
For example:
- Histogram above zero and rising: Positive momentum may be strengthening.
- Histogram above zero but falling: Positive momentum may be weakening.
- Histogram below zero and falling: Negative momentum may be strengthening.
- Histogram below zero but rising: Negative momentum may be weakening.
Rather than being interpreted as independent entry or exit signals, these readings should be considered in conjunction with price action, trend, support, and resistance.
A momentum histogram is another tool used by the TTM Squeeze approach to determine the potential direction of the move following a squeeze release.
How to read the squeeze momentum indicator?
Reading the indicator becomes easier when you separate it into three stages.
1. Identify the squeeze
Look for the squeezing situation first.
Volatility has decreased when Bollinger Bands enter the Keltner Channels. During this time, traders frequently describe the market as being "in a squeeze."
It does not imply that a price breakout must occur right away.
Rather, it advises you to be aware of the potential for an increase in volatility.
2. Wait for the squeeze release
The release phase comes next.
The squeeze is over when the Bollinger Bands enlarge and leave the Keltner Channels.
This indicates that volatility is rising once more.
To determine the direction of the move at this time, traders typically examine the momentum histogram and price activity.
3. Check momentum
Additional context can be obtained from the histogram.
Strengthening positive momentum is indicated if momentum is climbing over the zero line. While negative momentum is indicated if momentum is decreasing below the zero line.
Before making a trade decision, a trader should, however, also consider elements including market trend, volume, support, and resistance.
How to use the squeeze momentum indicator?
The indicator can be used as part of a broader technical analysis setup.
Here is a simple process:
Step 1: Open a chart
To study a stock, index, or other instrument, open its chart.
Traders can examine market movements using Dhan's charts and technical analysis tools. TradingView charts with over 100 indicators and sketching tools are available on Dhan's online trading platform.
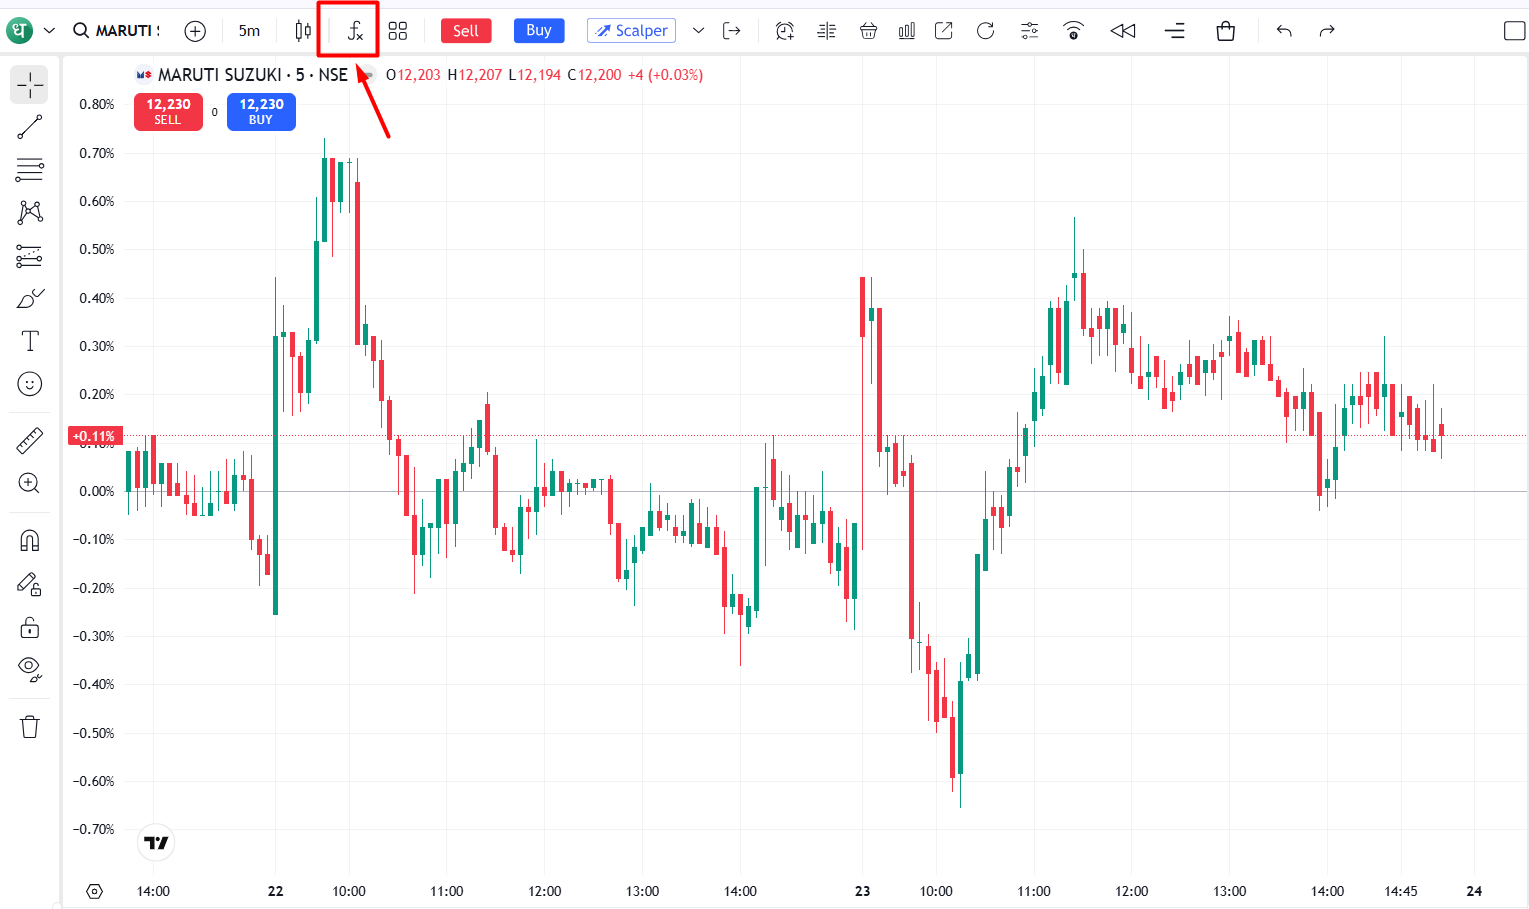
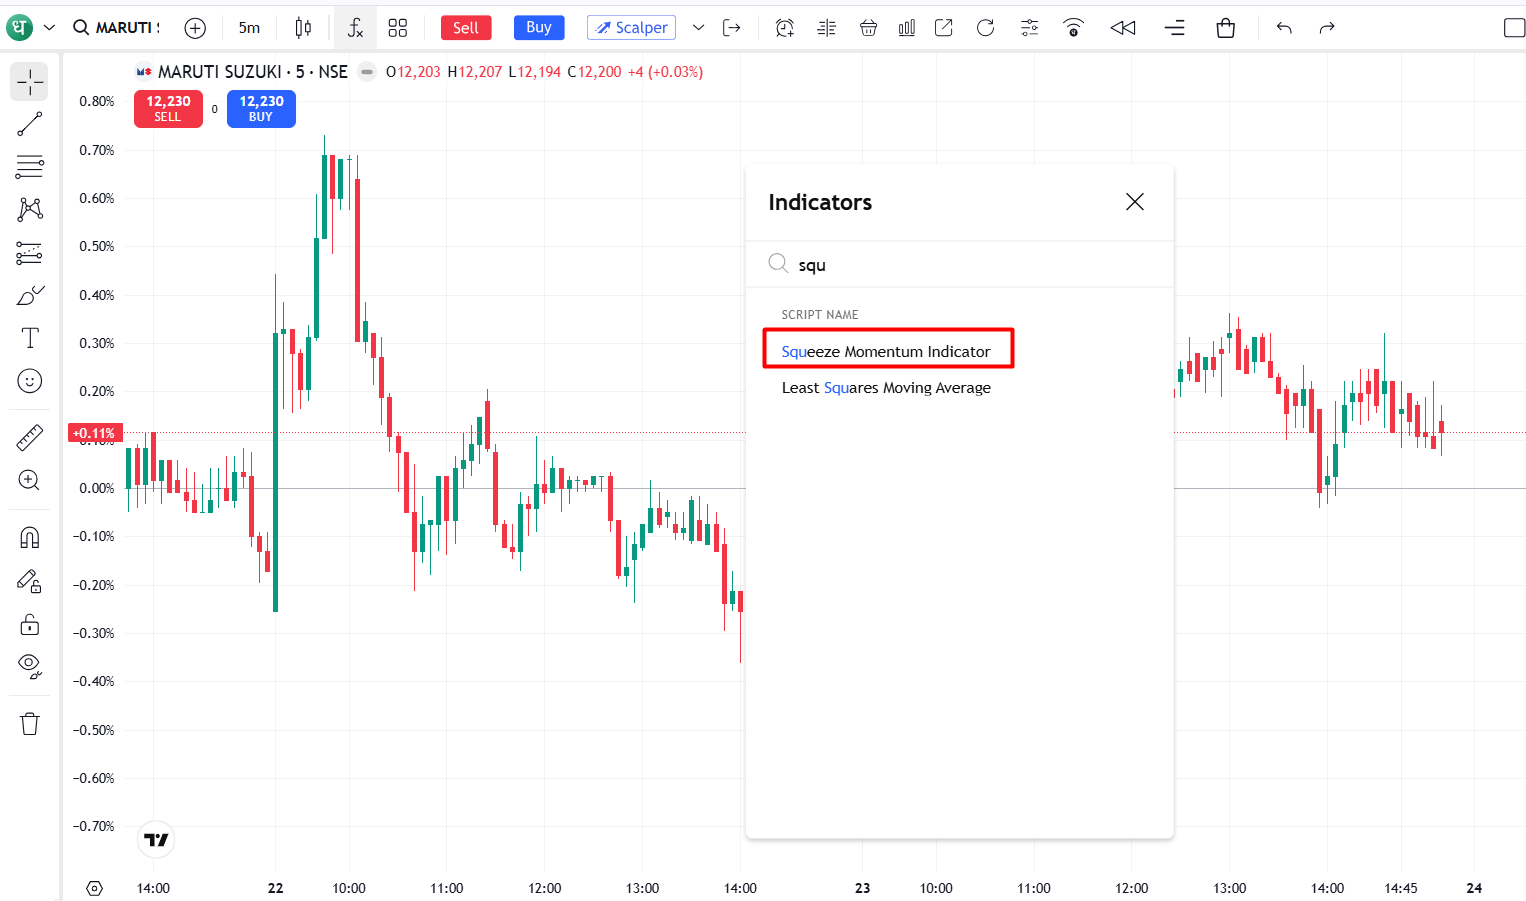
Step 2: Add the indicator
On your charting platform, look for the squeeze momentum indicator or the appropriate squeeze indicator.
Before making any changes, choose the indicator and check its default settings.
Step 3: Look for a squeeze
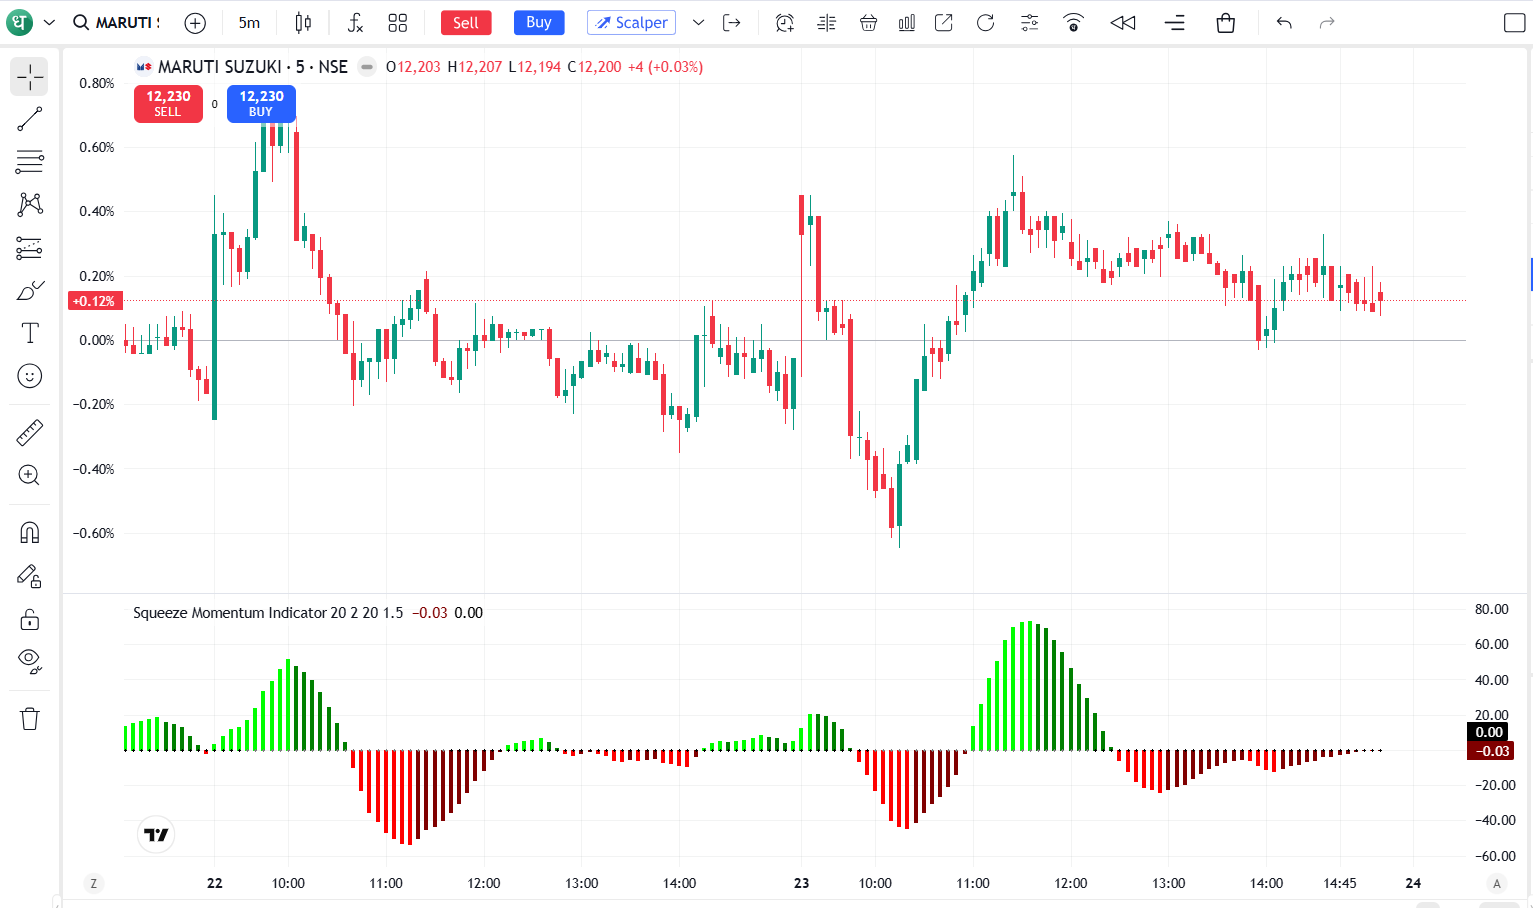
Check to see if the Bollinger Bands have shrunk within the Keltner Channels.
The volatility-compression phase is represented by this.
Step 4: Watch for the release
Look for an increase in volatility after the squeeze is over.
Don't think that every squeeze release will lead to a big, lucrative move.
Rather, see if the price is also breaching a significant level of support or resistance.
Step 5: Study the histogram
Examine the direction and position of the histogram with respect to the zero line.
Step 6: Manage risk
Determine how much money you are willing to risk before making a trade.
The risk of an unforeseen price shift can be reduced with the use of a stop-loss and suitable position sizing.
Additionally, Dhan offers risk-management tools and trader controls to assist traders in managing their positions.
Example of a squeeze momentum setup
Let's say a stock has been trading sideways for a number of trading sessions.
The Bollinger Bands finally enter the Keltner Channels after progressively narrowing.
After that, the momentum histogram rises above the zero line, the squeeze releases, and the price rises above a nearby resistance level.
This combination could be interpreted by a trader as proof that volatility has increased with bullish momentum.
This does not, however, imply that an upward advance is certain. Additionally, after the squeeze release, the price may revert and create false breakouts.
For this reason, risk management, price structure, volume, and general market conditions are still crucial.
Squeeze momentum indicator settings
The commonly used settings are:
Although TTM Squeeze-style implementations frequently use these settings, they shouldn't be assumed to be appropriate for all stocks or timeframes.
A trader examining short-term intraday charts, for instance, would test different parameters than someone looking at daily charts.
Before using any change in live trading, it should be compared to past price behaviour.
Advantages of the squeeze momentum indicator
The indicator can be useful because it combines volatility and momentum in one setup.
Some potential uses include:
- Recognising times when volatility is compressed.
- Highlighting the point at which volatility starts to increase.
- Examining the momentum surrounding a breakout.
- Assisting traders in keeping an eye on consolidation stages.
- Integrating pricing structure and momentum data.
- Utilising the idea over a variety of time periods.
The ability to study the squeeze concept over a variety of time periods is another helpful tool. Additional context can be obtained by comparing the same item on intraday and daily charts.
Limitations of the squeeze momentum indicator
The squeeze momentum indicator can provide useful insights, but it should not be used as a standalone trading tool.
Some potential limitations include:
- On its own, it does not reveal the breakout's direction.
- Before volatility increases, a squeeze may last longer than anticipated.
- A false breakout may occur from a squeeze release.
- Shortly after emerging, momentum signs may become weaker or reverse.
- Depending on the settings and computation technique, indicator readings can vary.
- Because it depends on past pricing data, it might deliver delayed signals.
- Analysis may be lacking if price activity, volume, and market structure are not taken into account.
Another drawback is that different stocks, indices, and time periods may not benefit equally from the same parameters. Depending on the instrument and trading period they are examining, traders might have to assess the indicator.
Conclusion
The squeeze momentum indicator helps traders understand what occurs when a market transitions from a time of compression to expansion by combining momentum and volatility.
The link between Bollinger Bands and Keltner channels determines the squeeze condition, and the momentum histogram offers more details regarding the strength and direction of price momentum.
It can be a helpful complement to a technical analysis setup when used properly.
However, no signal should be regarded as a surefire way to predict how prices will change. A more comprehensive picture of a possible trade setup may be obtained by combining the squeeze momentum indicator with price action, market structure, and prudent risk management.
FAQ’s
1. Is the squeeze momentum indicator good for intraday trading?
It can be used to examine momentum and volatility compression on intraday charts. However, rather than being employed as a stand-alone trading strategy, the indicator should be used in conjunction with price action, market circumstances, and risk management.
2. What does a squeeze mean in trading?
Bollinger Bands moving inside Keltner Channels during a period of compressed volatility is commonly referred to as a squeeze. It implies that volatility has decreased and could increase in the future.
3. Does the squeeze momentum indicator predict breakouts?
It is not a reliable indicator of a breakout. It can assist traders in keeping an eye out for potential volatility growth and detecting volatility compression. Price action and other market data must still be used to determine the direction.
4. What does the histogram mean in the squeeze momentum indicator?
Momentum around a zero line is shown by the histogram. Positive momentum is often represented by a reading above zero, whereas negative momentum is represented by a reading below zero. Additional momentum context can be provided by altering the bar's height and direction.
5. Can beginners use the squeeze momentum indicator?
Indeed. It can be used by beginners to comprehend momentum and volatility compression, but they should first understand how Bollinger Bands, Keltner Channels, and ATR operate. It works best when incorporated into a larger trading system.