Support and resistance levels are like specific price points where stocks or other assets limit their movement in that particular direction and reverse.
Every trader pays keen attention to these levels during online stock trading as they determine the entry and exit price.
To find these support and resistance levels, you need to use charts and conduct technical analysis. But is that enough? Not really.
In this article, we will cover what support and resistance levels and how to find support and resistance levels for trading.
What is Support and Resistance?
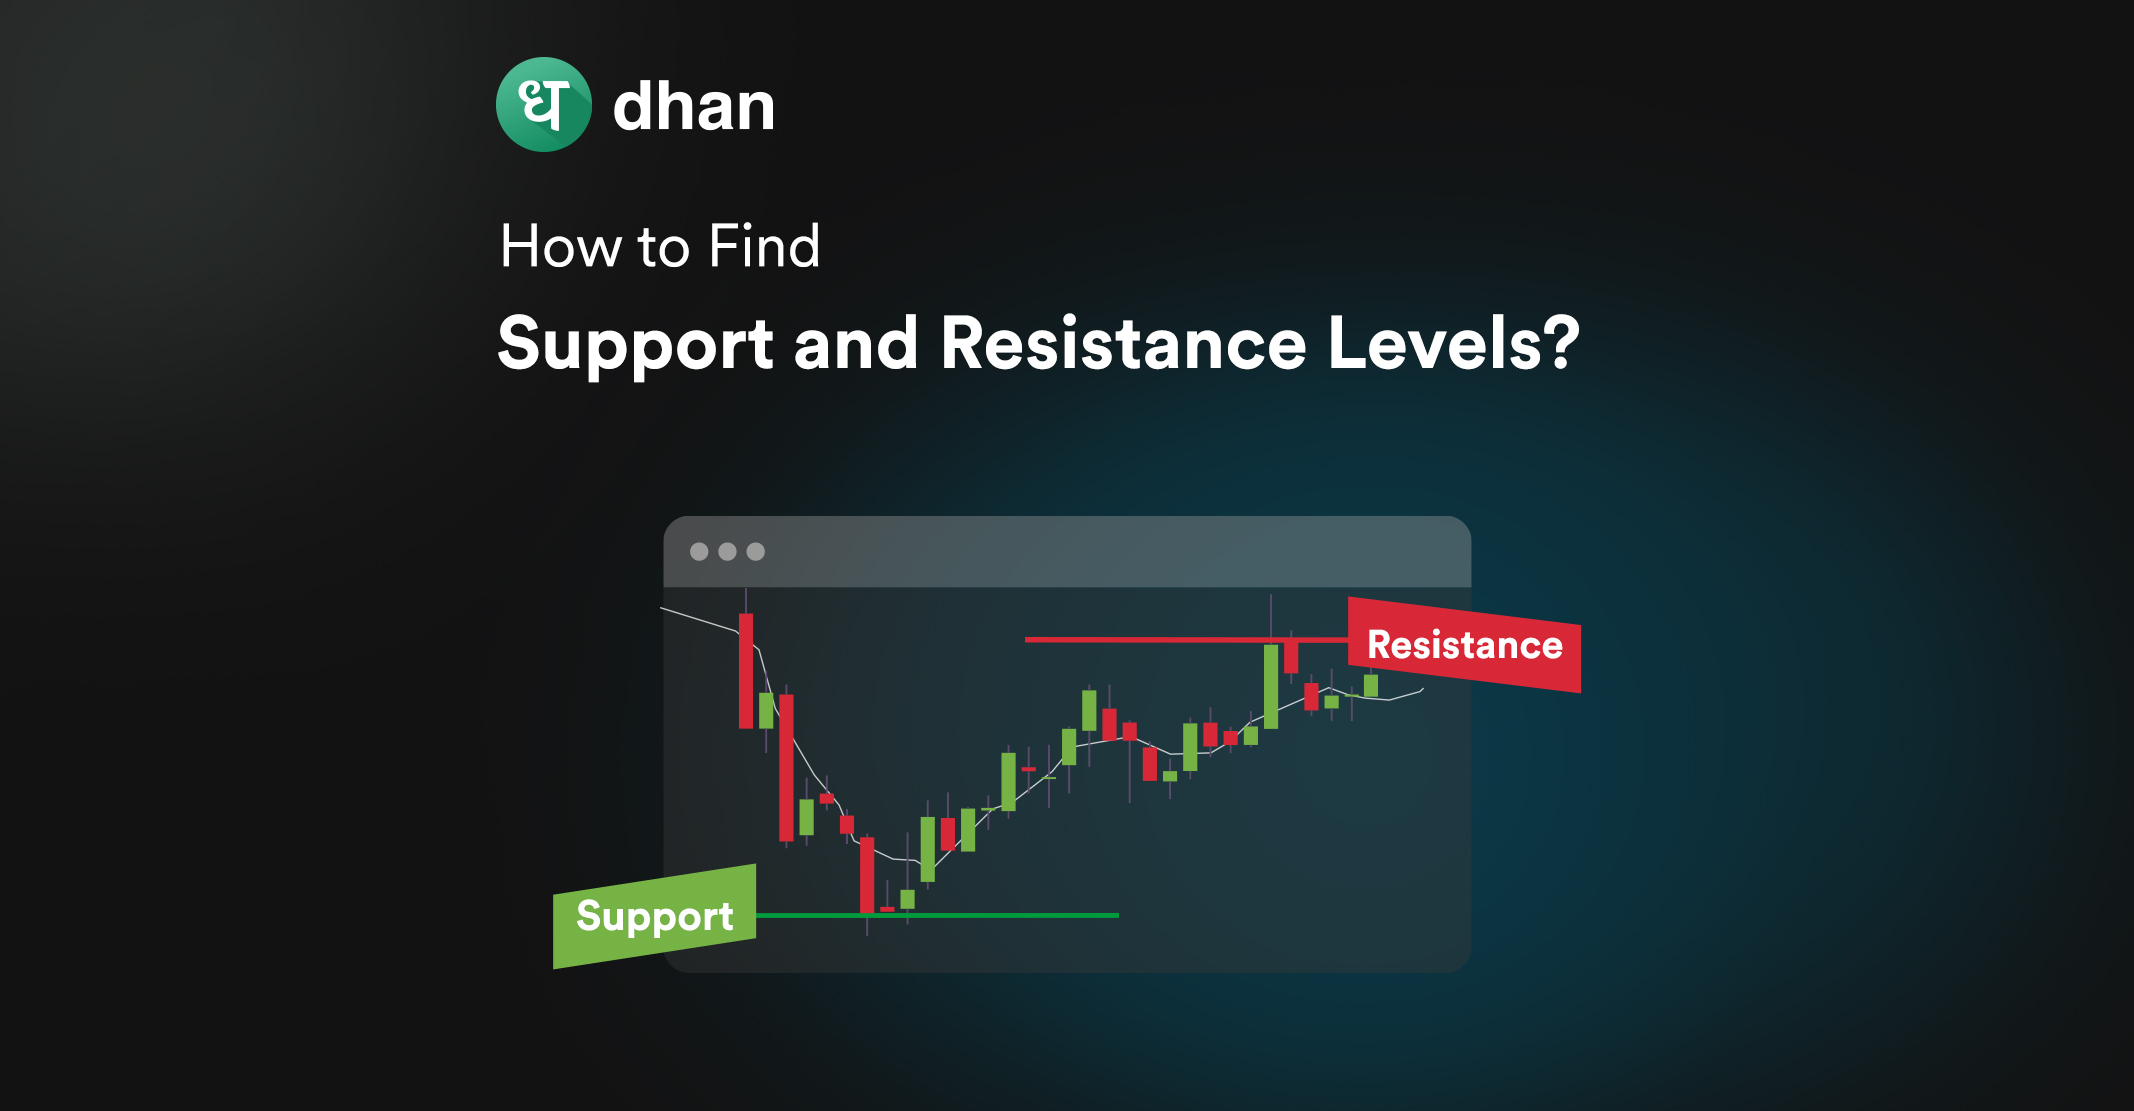
Support is a price level where demand is expected to pause a downtrend. This is where the price stops falling and bounces back up.
On the other hand, resistance is a price level where supply is expected to pause an uptrend. This is where the price stops rising and dips back down.
In simple words, the price level does not go below the support level; it’s where the price stops falling and bounces back.
Resistance is the opposite – it’s where the price doesn’t go higher and might start to fall.
Support and resistance levels play essential roles when it comes to trading any security.
That’s why traders are known to plan their moves accordingly, always keeping in mind the appropriateness of the support and resistance levels.
The Math Behind Support & Resistance Levels
There are different ways to calculate support and resistance levels, but one of the common methods is using the pivot point formula.
The Pivot Point (PP) is the average of the previous day’s high, low, and close prices. The formula is:
PP = (H+L+C) / 3
where H is the previous day’s high, L is the previous day’s low, and C is the previous day’s close.
The first level of support (S1) and resistance (R1) are calculated by subtracting and adding the difference between the high and low prices to the pivot point. The formula is:
S1 = PP-(H-L)
R1 = PP+(H-L)
The second level of support (S2) and resistance (R2) are calculated by subtracting and adding the difference between the high and low prices twice to the pivot point. The formula is:
S2 = PP-2 (H-L)
R2 = PP+2 (H-L)
These levels can be used as potential entry or exit points for traders, as they indicate areas of increased buying or selling pressure.
Purpose of Identifying Support and Resistance
Identifying support and resistance levels serves several crucial purposes in trading.
1. Risk Management
Support and resistance levels help risk management by helping you set effective stop-loss orders.
Typically, a trader would set a stop loss at a key support level to limit potential losses.
Doing so provides a structured approach to exit positions if the market moves unfavorably.
2. Decision-Making
Identifying support and resistance levels helps you make better decisions. The logic is simple – support is buy, resistance is sell.
While this may sound simplistic, the framework is useful for entering or exiting positions and gathering crucial insights along the way.
3. Trend Analysis
When analyzing trends, you benefit from recognizing support and resistance levels.
Breakouts above resistance or below support signal potential trend shifts. Using this information can help you make new trades or close existing positions.
4. Target Setting
Support and resistance levels aid in setting profit targets as a part of a complete trading plan.
For instance, after entering a long position near a support level, a trader might establish a profit target as the price approaches a resistance level.
This smart use of price levels helps define potential gains and manage your trades effectively.
How to Identify Support and Resistance Levels?
Identifying S&R levels is essential for successful trading. Here are the key methods:
1. Price History Analysis
Analyze price history to identify levels where values are often paused or reversed.
As you observe past charts, look for points where the price movement halted or changed direction frequently.
These are potential support levels if the price stopped falling and resistance levels if it ceased rising.
This historical analysis enables you to anticipate future market behavior at these critical points and make informed trading decisions.
2. Trendlines
Connect successive higher lows for uptrend lines and lower highs for downtrend lines.
Draw a line beneath rising lows to identify potential support or above declining highs for potential resistance.
When prices approach these trendlines, they may bounce off (support) or face a barrier (resistance), helping your decision-making in trading.
Adjust the trendlines as the trend evolves. This type of analysis forms the pillar of a strategy known as Line Trading.
3. Moving Averages
Moving averages, like the SMA or EMA, offer dynamic support or resistance levels.
Plot these averages on your chart and observe how prices interact with them.
Upward movement above the average signals potential support, while downward movement below it suggests potential resistance.
These averages smooth out fluctuations, aiding in trend identification and decision-making.
4. Volume Analysis
When you’re analyzing support and resistance, pay attention to trading volume at specific price levels.
High volumes suggest increased market activity and can signal significant support or resistance.
If a price level coincides with a surge in volume, it strengthens the importance of that level, providing you valuable insights into potential key areas for making trading decisions.
5. Round Numbers
Identify psychological levels such as round numbers (Rs 50, Rs 100) as support or resistance.
Traders often observe these figures, considering the impact of psychological factors on market behavior.
Whole numbers act as mental barriers, influencing buying or selling decisions, making them significant points for entry, exit, or decision-making in your trading strategy.
Recognizing these round-number levels adds a valuable dimension to your trading analysis.
How to Draw Support and Resistance Lines?
After understanding what support and resistance are and how they can be identified, there’s another question now: How to draw support and resistance?
Drawing support and resistance lines is a straightforward process. Follow these easy steps:
- Spotting Peaks and Troughs: Locate significant highs and lows on the price chart.
- Connect Peaks for Resistance: Draw a line connecting the highest points. This line represents potential resistance levels where prices may struggle to rise above.
- Connect Troughs for Support: Draw a line connecting the lowest points. This line signifies potential support levels where prices may find a floor.
- Extend Lines: Extend these lines horizontally to cover more price action.
- Confirm with Touchpoints: Look for multiple instances where prices touch or bounce off these lines, confirming their significance.
Remember, practice enhances your skill in identifying and drawing support and resistance lines accurately.
Which Chart is Best for Support and Resistance?
When it comes to finding support and resistance, you’d want to go with a line chart. It clearly depicts price movements and key levels over time.
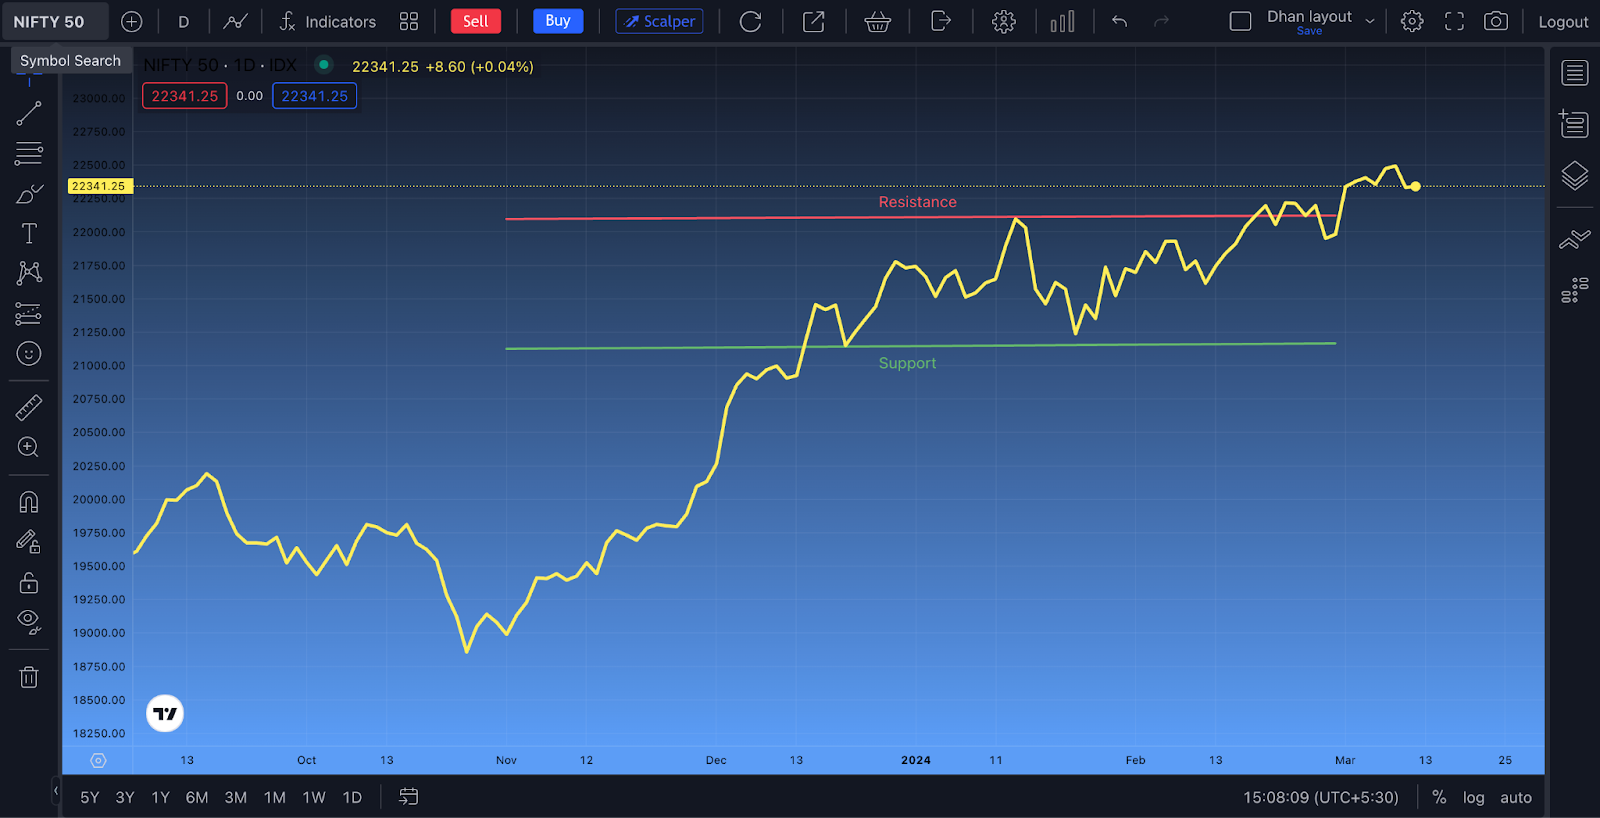
The simplicity of a line chart helps you easily identify areas where an asset’s price historically found support or resistance.
By connecting closing prices, line charts emphasize trends and provide a straightforward visual representation of potential entry or exit points, helping technical analysis in financial markets.
Which Indicator is Best for Support and Resistance?
While no single indicator is universally the best for identifying support and resistance, some commonly used support and resistance indicators include:
- Horizontal Lines
- Trendlines
- Fibonacci Retracement
- Pivot Points
- Bollinger Bands
Ultimately, a combination of indicators may provide more robust support and resistance analysis. Always consider market conditions and use multiple tools for confirmation.
Conclusion
Finding S&R levels is crucial for successful trading. Identify key price points, use historical data, and pay attention to chart patterns.
Trust your analysis, but also consider market sentiment. Don’t forget to adapt to changing conditions and adjust your trading strategies accordingly.
FAQs
Q. What is the formula for support and resistance levels?
The formula for support and resistance levels is Support Level = Previous Low – (Price High – Previous Low), and Resistance Level = Previous High + (Previous High – Price Low).
These calculations provide a quantitative way to identify potential support and resistance levels based on past price movements, alongside the more common method of spotting patterns on charts.
Q. How do you confirm support and resistance?
To confirm support and resistance, watch for the price to hit these levels multiple times without breaking through. The more often the price reacts to these levels, alongside noticeable trading volume at these points, the stronger the confirmation of their significance.
Q. What is the logic of support and resistance?
Support and resistance are based on supply and demand dynamics and investor psychology.
Support represents a price level where buying interest is significantly strong and surpasses the selling pressure, preventing the price from falling below this level.
Resistance is where selling interest outweighs buying pressure, stopping the price from rising further.