The supply and demand dynamics together are crucial factors that drive market prices. But how do you understand these price fluctuations? Lucky for you, reading candlestick charts can help you do just that! In this blog, we will explore how to read candlestick charts for day trading!
We have also covered everything about technical analysis and about charting like a pro in our youtube series. The best part is – it’s FREE. Here is the link
What Is a Candlestick Chart?
Candlestick charts have an ancient and fascinating history behind their origin. It all started in the 1700s when a Japanese rice trader Homma discovered the link between prices, supply, and demand!
Since then, these charts have undergone modifications and have found extensive usage, especially in online intraday trading. In a candlestick chart, the price graphs are represented as candles.
The visual representation of prices with different colors makes it easy for traders to analyze the patterns and make short-term trading and investment decisions.
Before we go on to find out how to read a candle stick chart, let us take a look at its components!
Candlestick Chart Components
When you open a candlestick chart, you will notice both green and red candles. See the image below to know more.
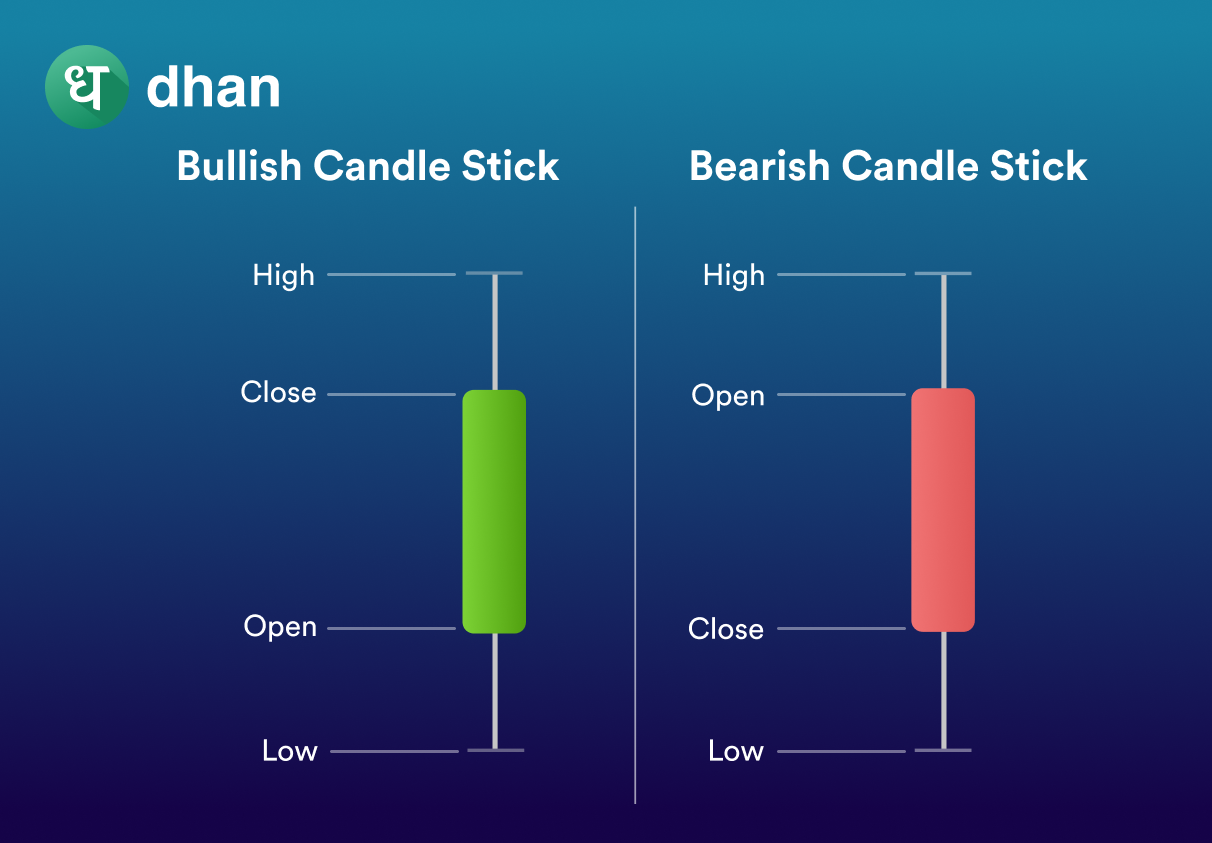
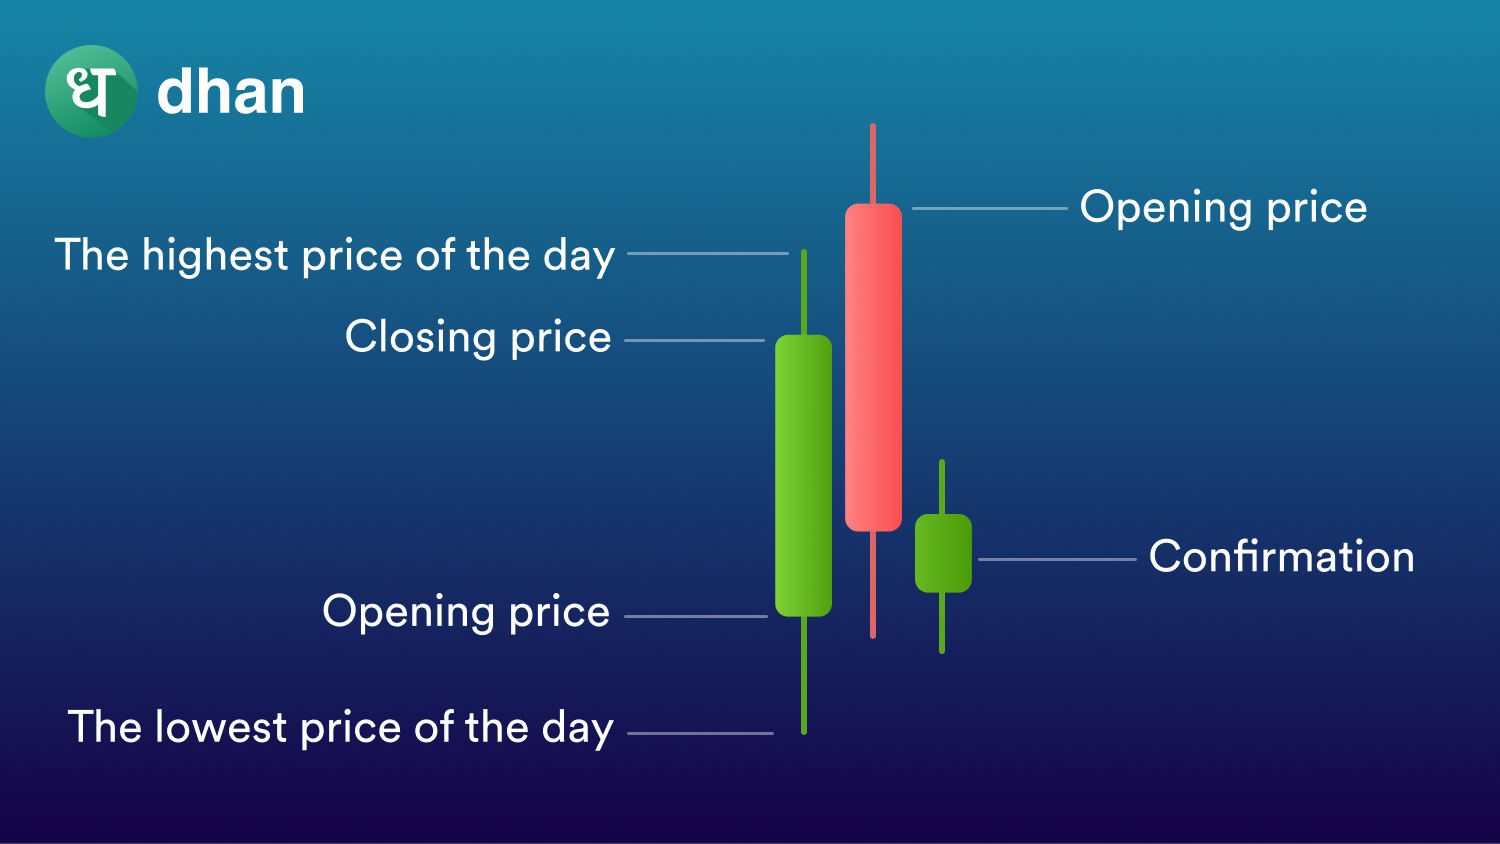
When you look at a daily candle, you will see that it depicts the market’s open, high and low, and close price for that particular day.
One thing to remember is that a candle only represents the price for a specific period.
For example, let’s say that you set the candlestick period to be an hour. In this scenario, every candle will only represent 1 hour period.
You will find the presence of thin candlewicks. These candlewicks depict the range of prices that a particular commodity was traded.
Now that you have a clear idea about the components of a candlestick chart, it is time to dive into how to read these charts!
How to Read Candlestick Charts?
Green candles indicate that the closing price for a particular asset was higher than its opening price, while a red candle indicates the exact opposite.
This means that when you see a red candle, the closing price is lower than the opening price. If the red candle’s upper wick is short, the stock nearly opened at the high of the day.
On the contrary, if the upper wick of the green candle is short, you can conclude that the stock closed near the high end of the day.
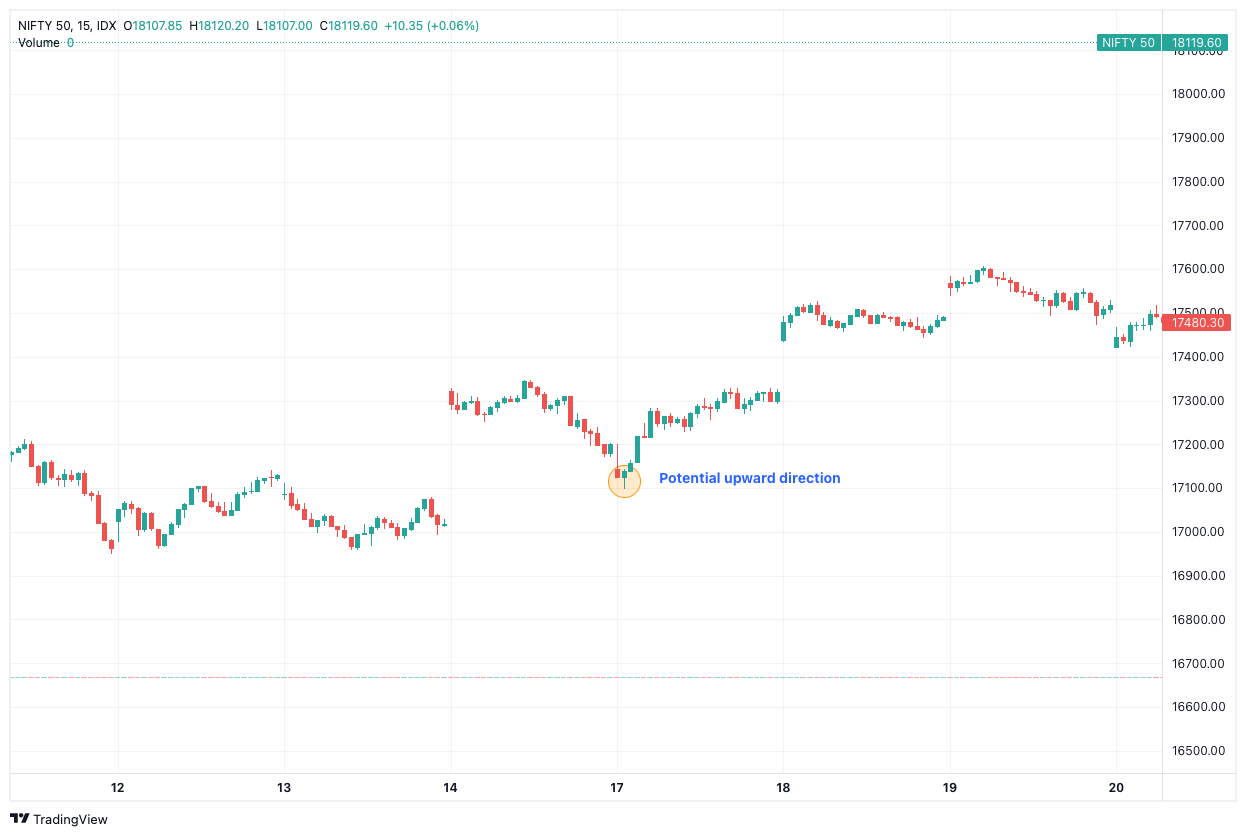
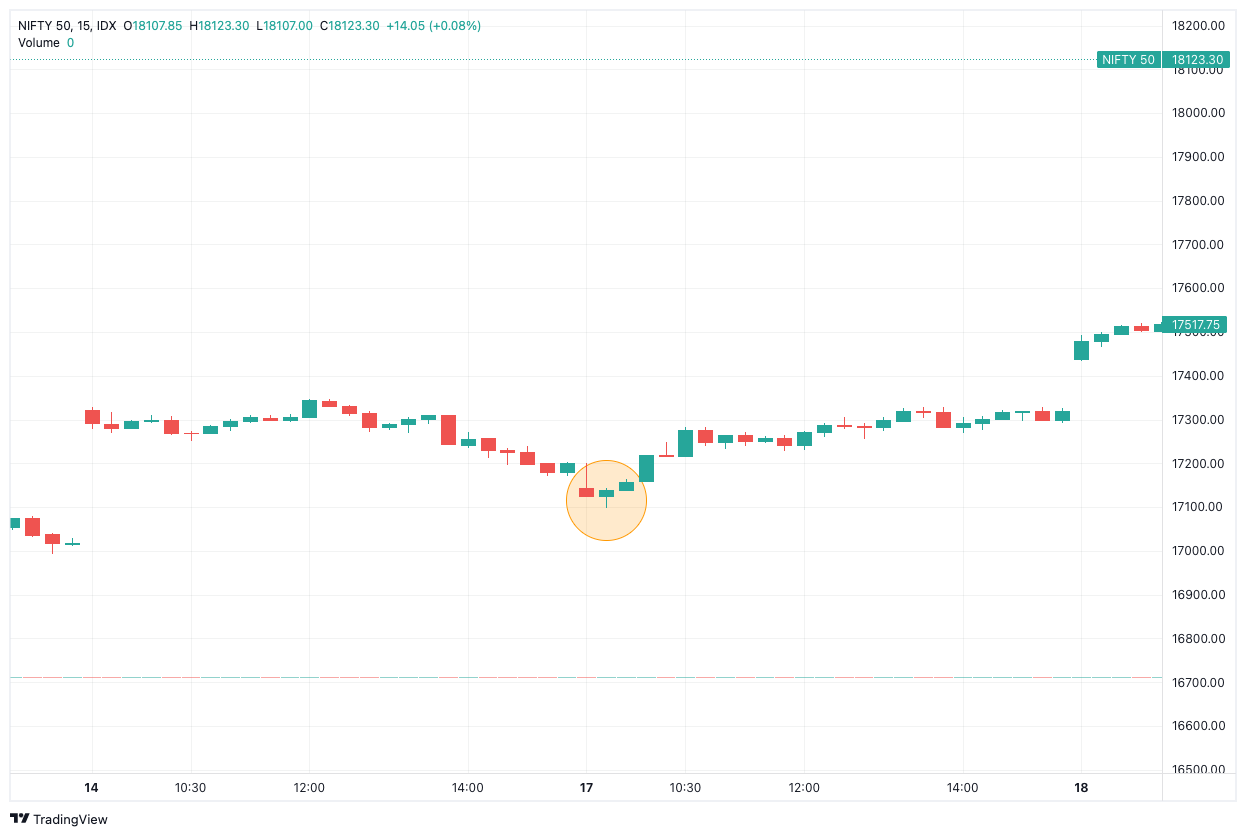
You also need to look closer at the number of green and red candle sticks. It will help you study the market trend, especially if you are using stock, commodity, or forex trading strategies that are centered around price action.
It does not end here! When you are an avid trader who is into online intraday trading, you should also understand different candle stick patterns apart from knowing how to read candle charts in the stock market.
Best Candlestick Patterns for Day Trading
You must already know that the market usually observes bullish and bearish patterns. So, we have compiled a few patterns to ease your learning process!
Bullish Patterns
1. Hammer pattern: If you find a short candlestick body with a longer lower wick at the end of a downward trend, it indicates a strong buying surge. If the body of this stick is green, there is a stronger bull market.
2. Morning Star Pattern
To form a morning star pattern, you need a small candle stick body between a long red and a long green candlestick. This pattern depicts the onset of a bull market due to a reduction in selling pressure.
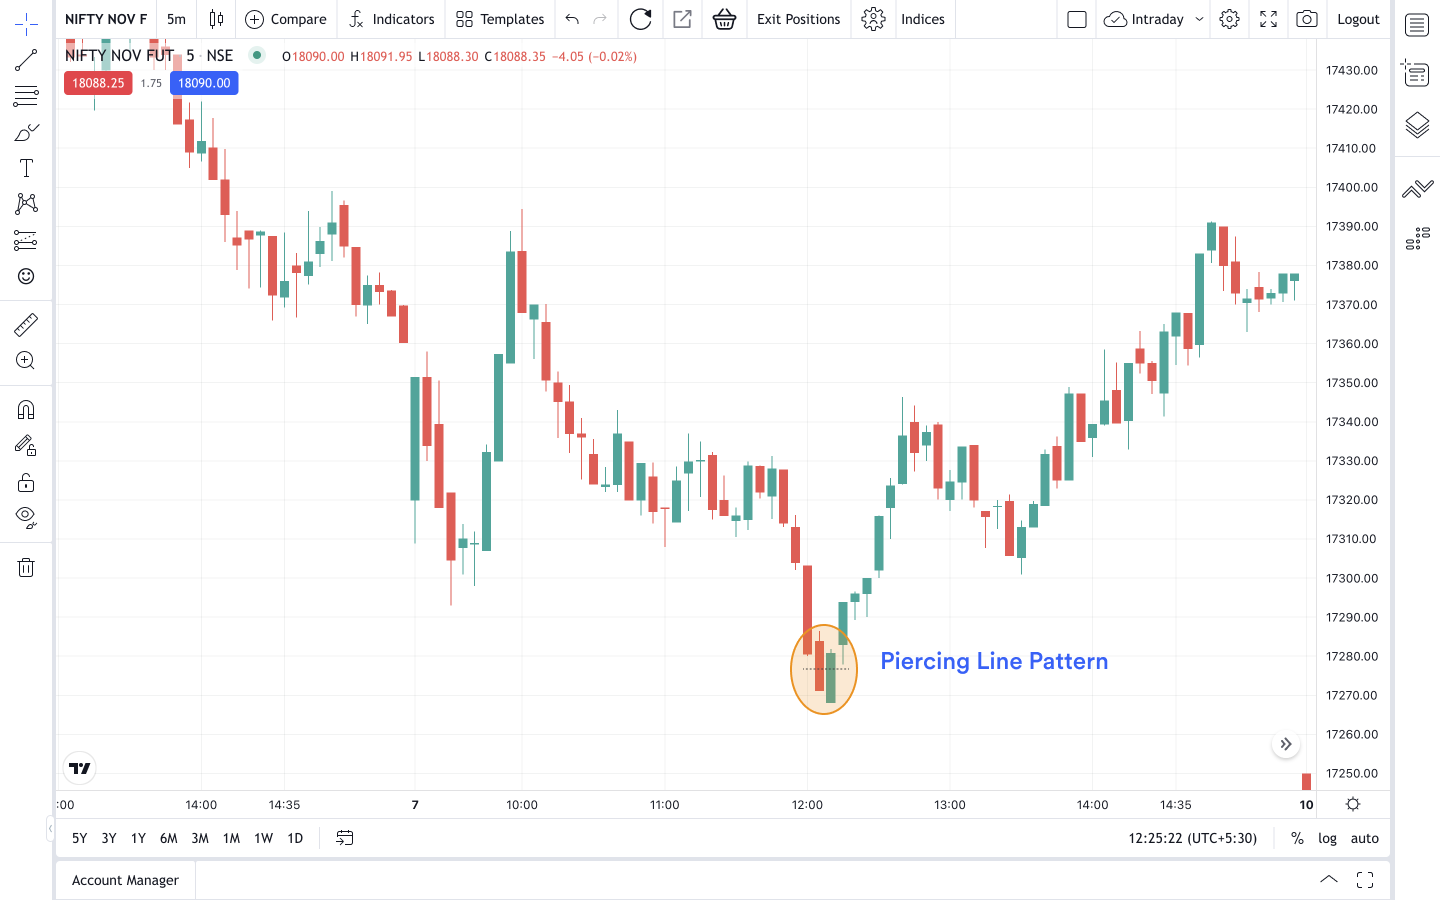
3. Piercing Line Pattern: In a piercing line pattern, a long red candle is followed by a long green candle. Additionally, the closing price of the green candle should at least be halfway up the body of the red candle.
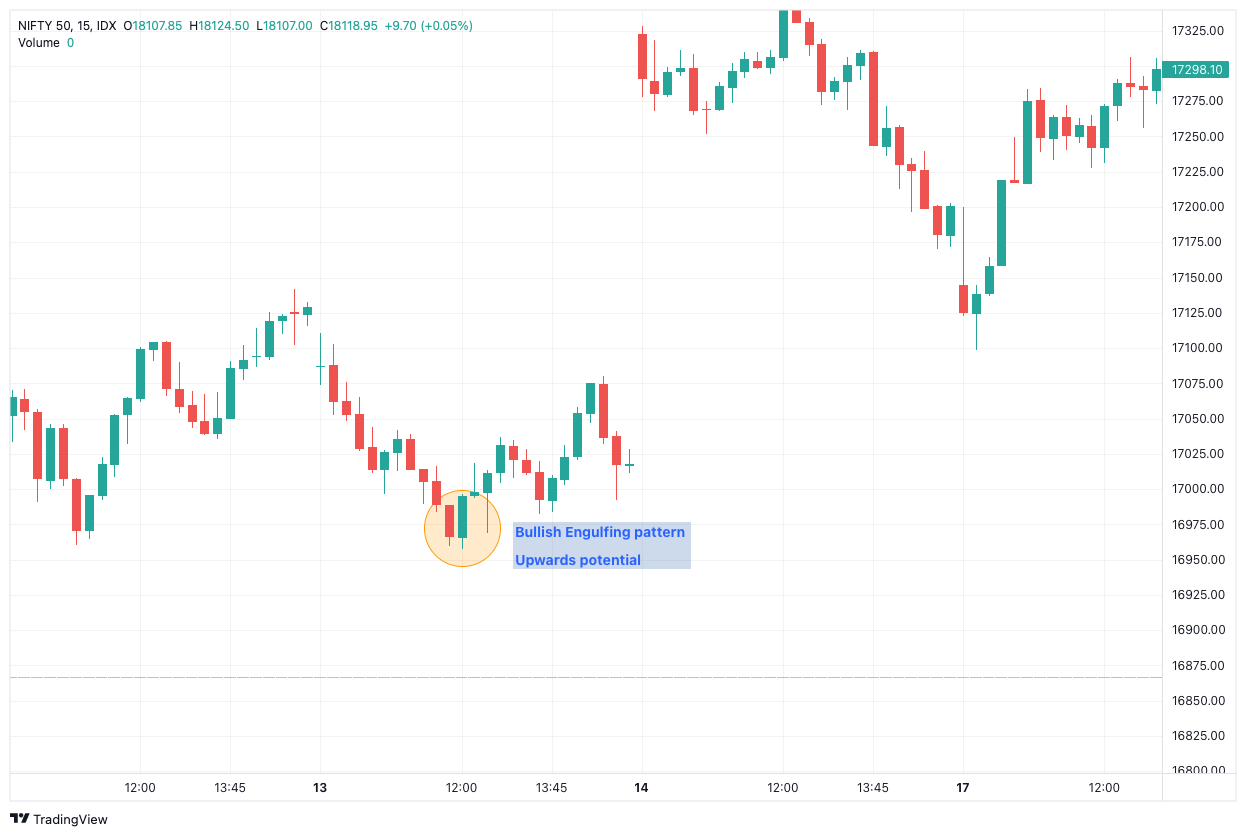
4. Bullish Engulfing Pattern: This pattern is reflected by a long green body engulfing a short red body. In this scenario, the buyers outpace the sellers.
Bearish Patterns
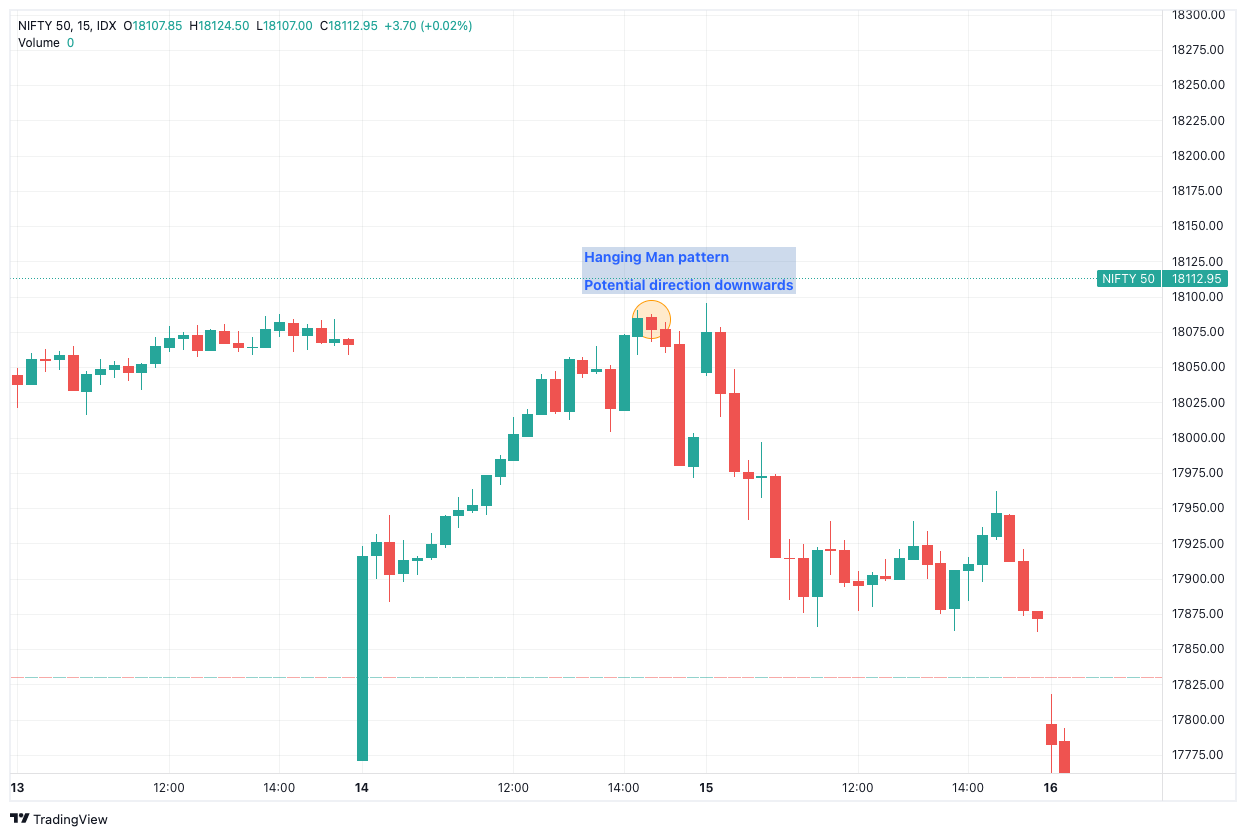
1. Hanging Man Pattern: If you find a short red candle body at the end of an upward trend, the selling pressures are much higher than the buying thrusts. This means that the bears are gaining market control.
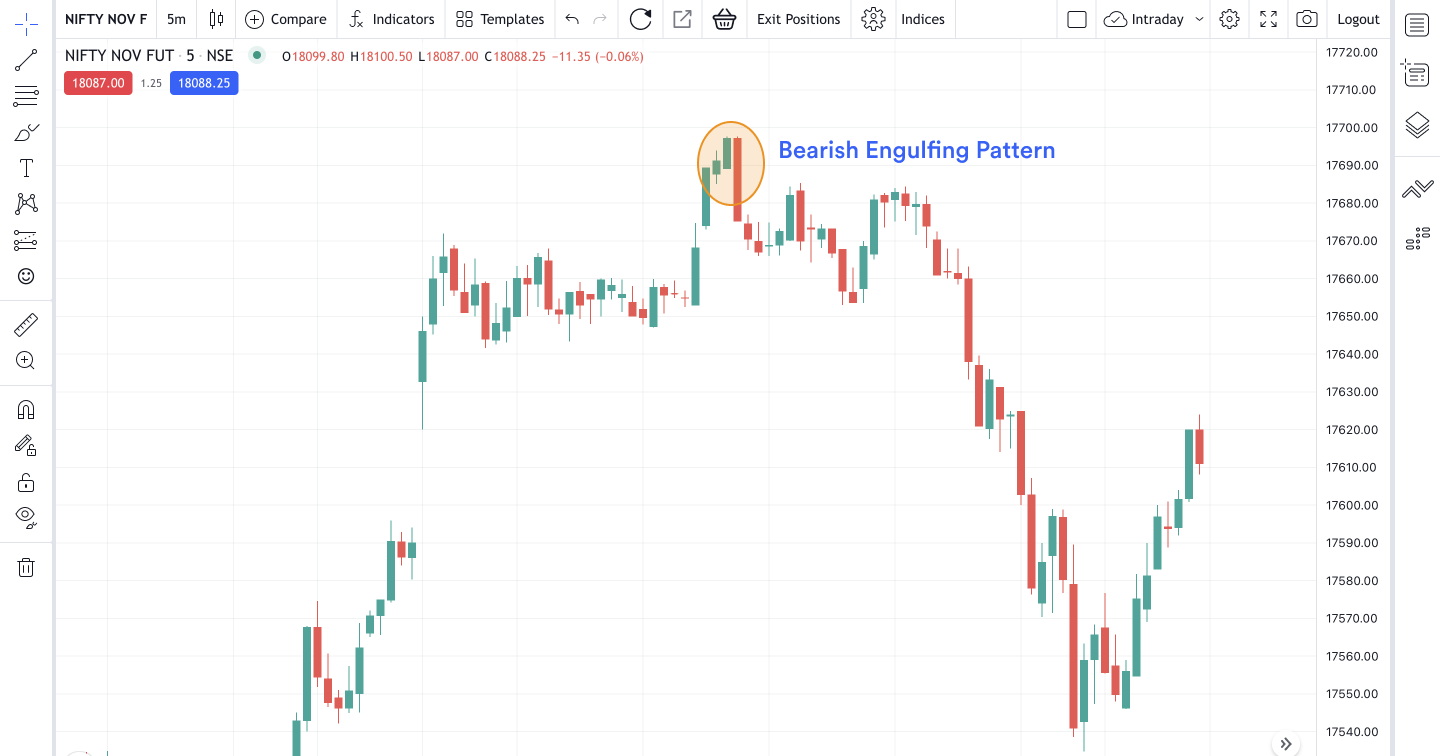
2. Bearish Engulfing Pattern: This pattern is depicted by a long red candle body engulfing a short green candle body. Occurring at the top of an upward trend, this pattern indicates that the market rise is slowing down and is a precursor to a downward trend.
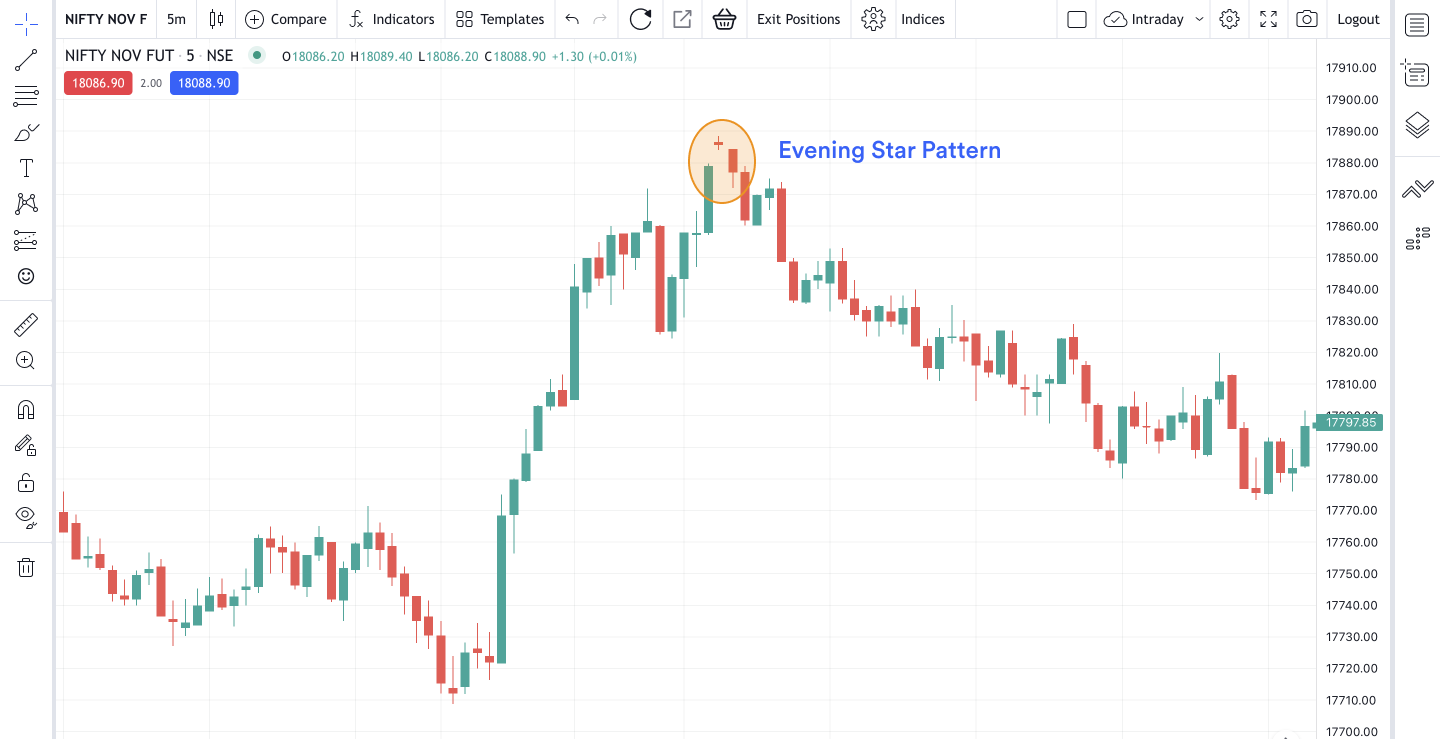
3. Evening Star Pattern: In an evening star pattern, a small candle body is fixated between a long green body and a long red body. This pattern is an indicator of the reversal of an upward trend.
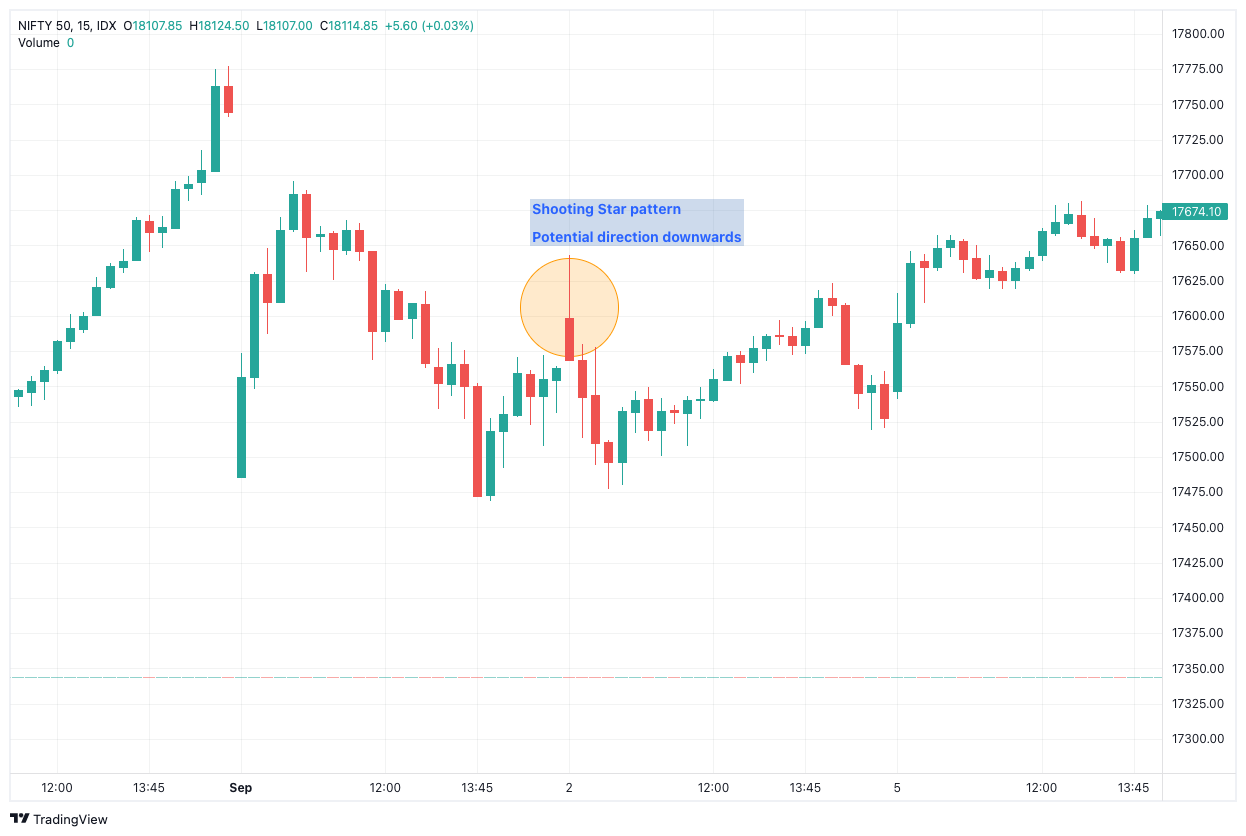
4. Shooting Star Pattern: This pattern is represented by a short body with a longer upper wick. Located at the pinnacle of an upward trend, the shooting star pattern alludes to the increase in selling pressures.
Conclusion
Candlesticks on charts can prove to be incredibly beneficial when trying to analyze market price fluctuations. It is an important part of technical analysis.
Use these tools properly, and you will find that your trading strategies can be that much more effective!
We hope now you can easily answer how to read candlestick charts for day trading! Like this? Then you’ll love these blogs:
The Complete Guide to Bollinger Bands Indicator
The Complete Guide to Average Directional Index
Happy Trading
FAQ’s
- What is a candlestick chart and how is it used in day trading?
A candlestick chart is a type of chart that is commonly used in technical analysis to display the price movements of a security. It is often used by day traders to identify patterns and make trading decisions. - What do the different colors of candlesticks represent?
Typically, green candlesticks represent an increase in price, while red candlesticks represent a decrease in price. However, the specific colors used can vary depending on the platform or software being used. - What are some common candlestick patterns that traders look for?
Some common candlestick patterns that traders look for include the hammer, the hanging man, the bullish engulfing pattern, and the bearish engulfing pattern. - How can candlestick charts be used in conjunction with other technical indicators?
Candlestick charts can be used in conjunction with other technical indicators, such as moving averages, to provide a more complete picture of a security’s price movements. For example, a trader may use a moving average to confirm a trend, and then look for specific candlestick patterns to identify potential entry and exit points. - How do I use candlestick charts to make trading decisions?
It’s important to use candlestick charts in conjunction with other technical analysis tools and to consider the overall market conditions when making trading decisions. It’s also important to backtest and practice with historical data before applying it to live trades.