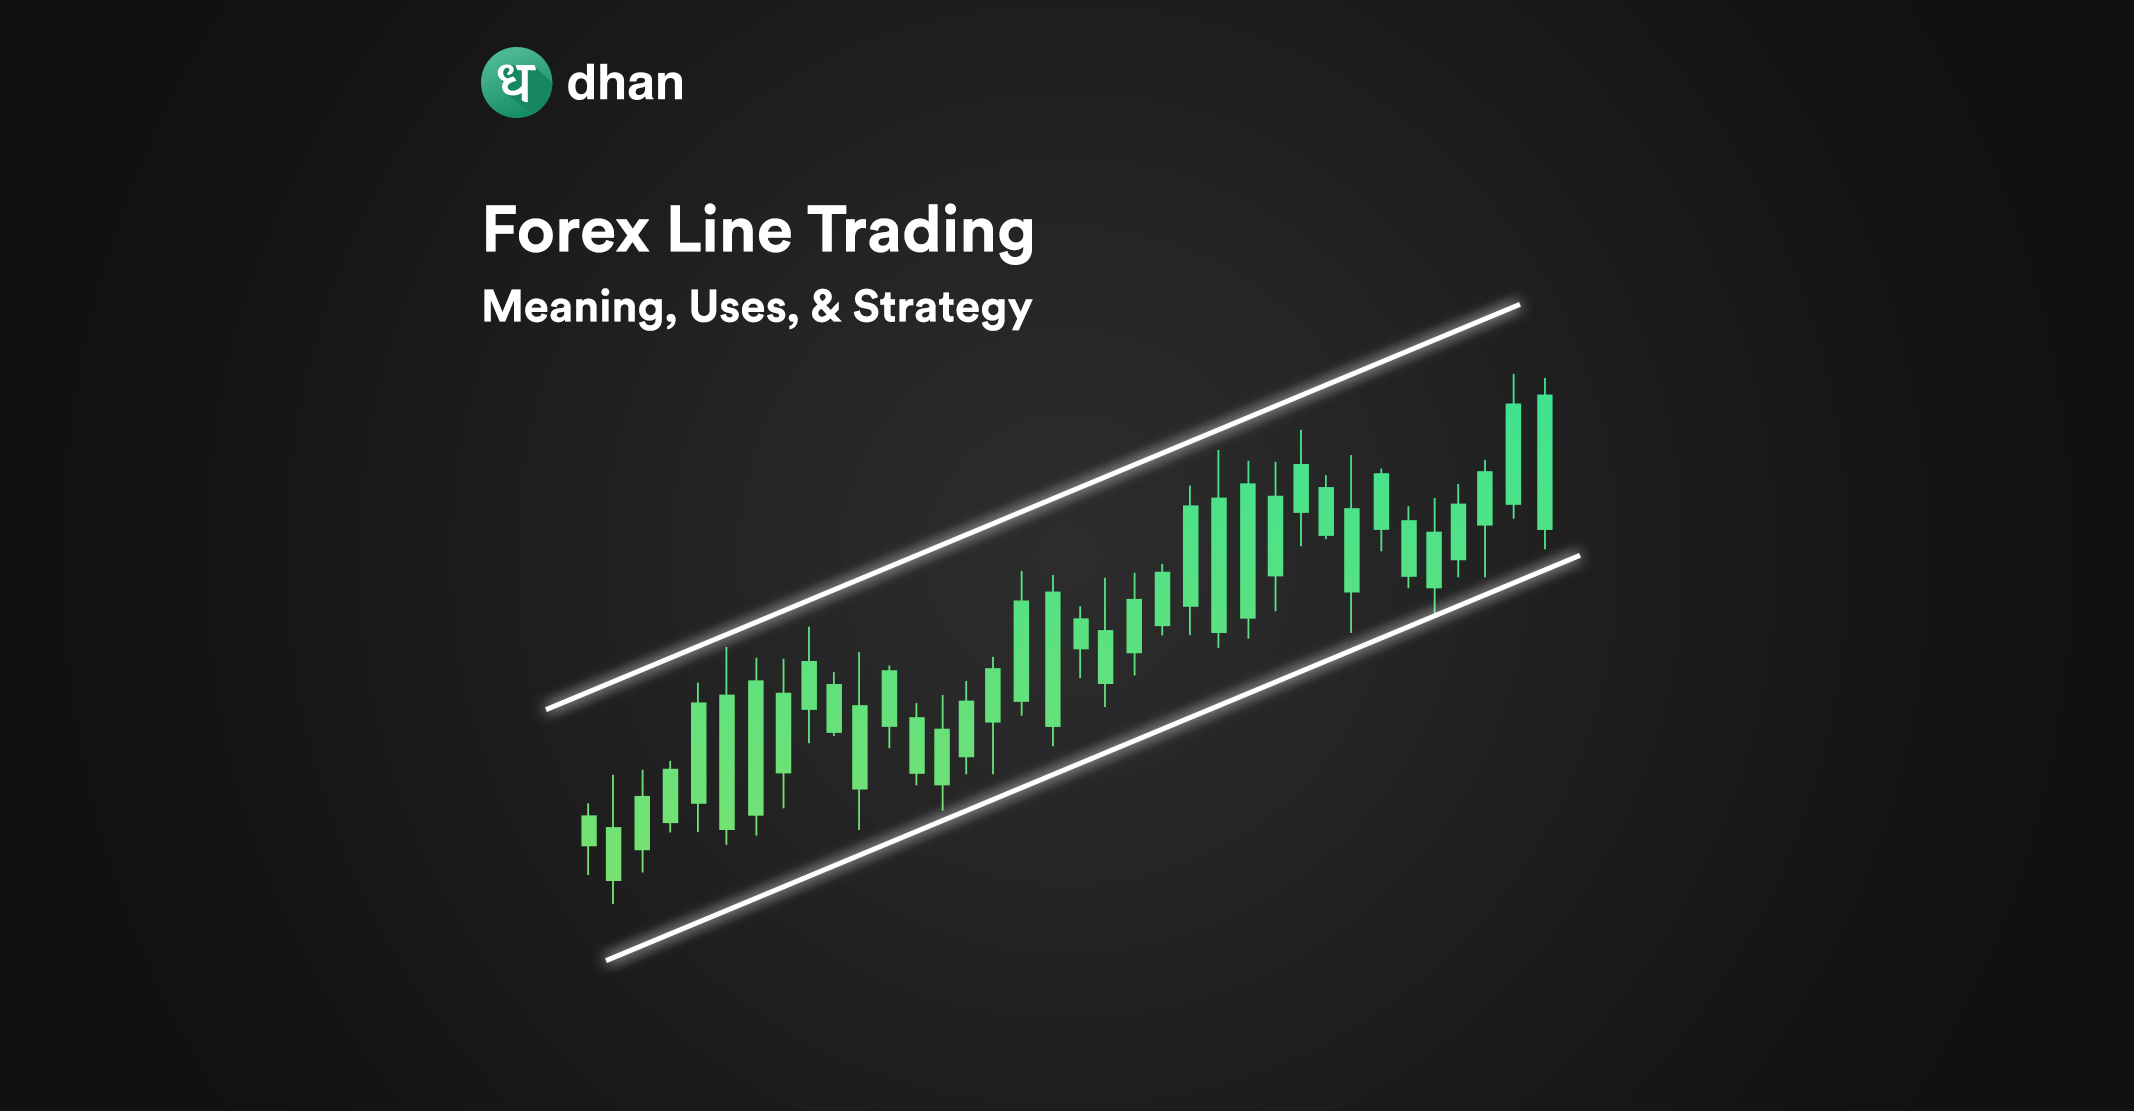
If you’re a trader exploring the world of online forex trading, you’ve likely come across various tools and techniques to navigate dynamic markets. One such tool for forex analysis is the forex line chart.
What is Forex Line Trading?
Forex line trading revolves around carefully examining and plotting trendlines on price charts, thereby connecting critical price points to forecast the trend’s direction and momentum.
Trend lines are one of the basic tools in technical analysis on charts. Each trend line is drawn to visualize the direction, strength, and momentum of a trend.
A break in the prevailing trend indicates a trading opportunity, and drawing appropriate trendlines will enable you to spot potential entry and exit points for a currency pair.
Your confirmation levels can be further solidified by adding technical indicators that work in conjunction with the trendlines.
Using the same principle, you can modify your positions by adding more forex lots or reversing the position entirely if the trend goes against your outlook.
In any case, the magic lies in understanding the trends and extracting the right inferences from each line to get the best out of your online forex trading.
Types of Trends in Forex Line Trading
Forex trading is heavily influenced by market trends. These trends are of three types:
- Uptrends
- Downtrends
- Sideways trends
Understanding these trends is crucial for traders to make informed decisions. Let’s explore each trend in more detail.
1. Uptrend
An uptrend is sustained upward movement in the price of a currency pair. It is characterized by a series of rising highs and rising lows on a candlestick chart.
Forex traders often use trendlines to visually represent the upward trajectory of an uptrend.
This type of forex trend line is drawn by connecting the higher lows on the chart.
Check out the image below to see what a forex line trading chart looks like for an uptrend.
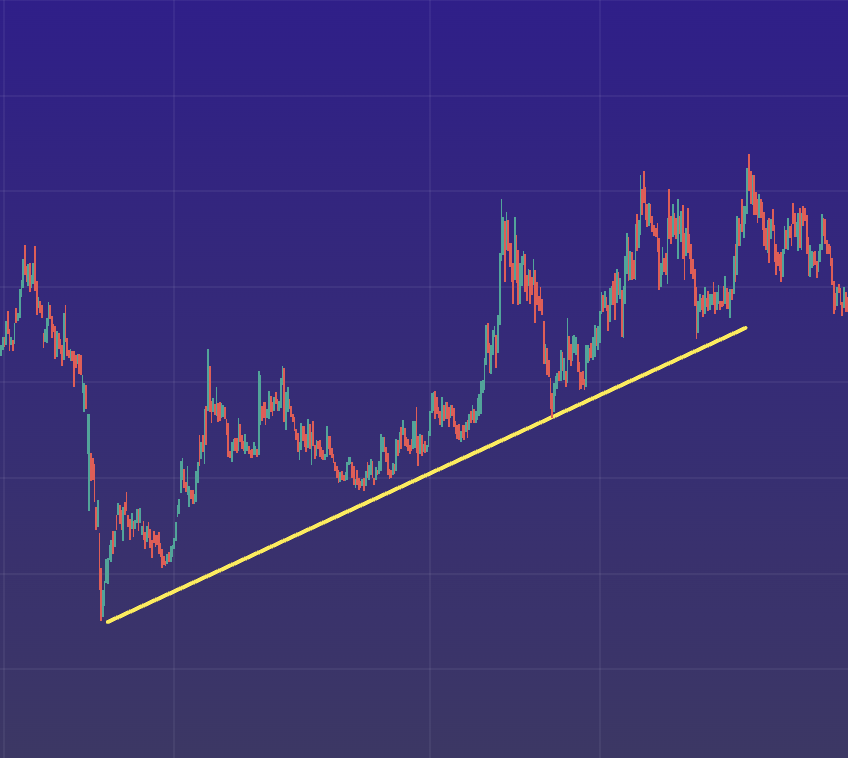
In an uptrend, the price tends to increase over time. Thus, most forex traders look to go long by buying up across various points of the upward trend where the price retraces or pulls back slightly.
2. Downtrend
A downtrend is the opposite of an uptrend. It indicates a prolonged downward movement in the price of a currency pair.
Every downtrend is characterized by a sequence of decreasing highs and decreasing lows on the price chart.
The trend line is drawn by connecting the lower highs on the chart. Check out the image below to know more.
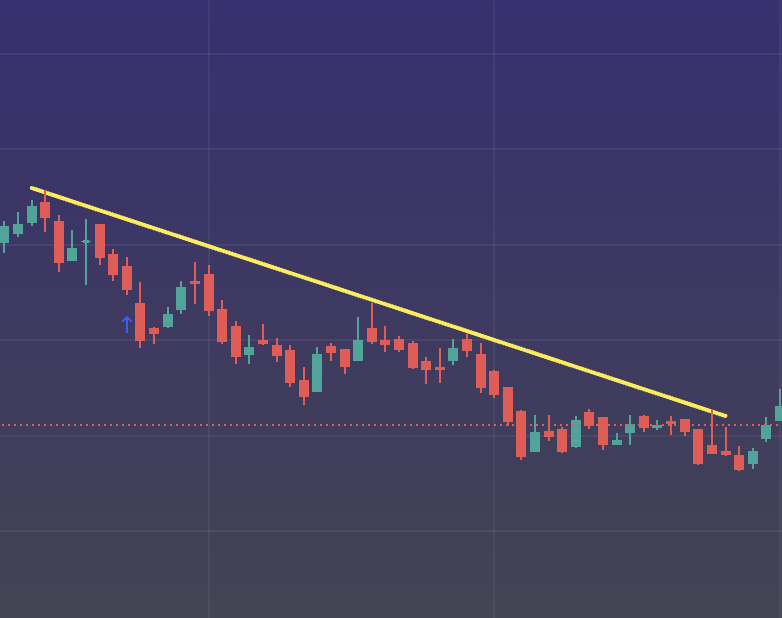
In a downtrend, sellers have the upper hand, which is why the price tends to decrease over time.
Forex traders will consider short-selling or selling at various points where the price retraces temporarily higher.
The logic? The overall downtrend will persist while forex line trading and lead to further price declines.
3. Sideways Trend
A sideways trend occurs when the price of a currency pair moves within a relatively narrow range without exhibiting a clear upward or downward direction.
This type of trend is characterized by horizontal price movement and is often represented by a flat trend line. That’s why sideways trends are also known as ranging trends, as they trade within a specific range.
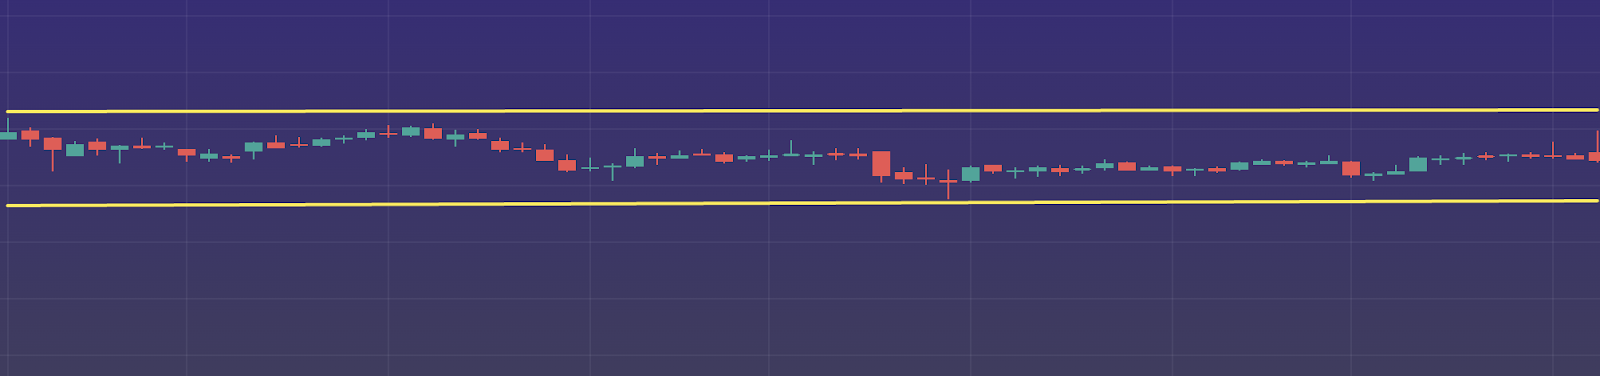
In a sideways trend, neither buyers nor sellers have a significant advantage, and the market is considered to be in a state of equilibrium.
During a sideways trend, forex traders may adopt range-trading strategies, which involve buying at the bottom of the range and selling at the top.
Uses of Forex Line Trading
Forex line trading offers several uses to enhance your trading approach. Here are some potential uses of forex line trading for you:
1. Identify Trends
Utilize forex line trading to identify trends in currency pairs by drawing trend lines on a price chart. This will help you determine the market direction and plan your trades accordingly.
2. Entry and Exit Points
You can use forex line trading to determine potential entry and exit points for your trades. By analyzing price movements and the interaction with trend lines, you can make more precise decisions on when to enter or exit the market.
3. Support and Resistance
Draw support and resistance lines using forex line trading to assess the strength and validity of trends. These lines act as reference points for potential price reversals, allowing you to adjust your trading strategy accordingly.
4. Risk Management
You can incorporate forex line trading in your risk management strategy by setting profit targets and stop-loss levels based on the support and resistance lines. This helps you determine the potential rewards and risks of each trade.
5. Trading Decision Validation
Validate your trading decisions using forex line trading. By observing how price interacts with the drawn trend lines, you can gain confidence in your analysis and make more informed trading choices during forex market hours.
Best Strategies for Forex Line Trading
Here are five effective strategies for forex line trading:
1. Trend Trading
Identify the prevailing trend in the market by analyzing price movements using trend lines, moving averages, or other technical indicators.
Look for opportunities to enter trades in the direction of the trend when the price retraces to the trend line or a support/resistance level. This technique is pinned to the assumption that the trend will continue.
2. Breakout Trading
Monitor price levels where significant support or resistance areas are formed.
When the price breaks above a resistance level or below a support level with strong momentum, consider entering a trade in the direction of the breakout.
Use appropriate trailing stop-loss orders to manage risk in case of false breakouts.
3. Support and Resistance Trading
Identify key support and resistance levels based on previous swing highs and lows or horizontal price levels.
When the price approaches these levels, anticipate potential reversals or breakouts.
Look for confirmation signals such as candlestick patterns or oversold/overbought conditions from oscillators to enter trades.
4. Fibonacci Retracement Trading
Apply Fibonacci retracement levels to identify potential areas of support or resistance within a trending market.
Look for confluence between these levels and other technical indicators such as trend lines or moving averages.
Use these levels to enter trades with the expectation of price reversals or continuations.
5. Price Action Trading
Analyze raw price data without relying on indicators to make trading decisions. Look for patterns such as bearish or bullish engulfing candles, doji candles, or inside bars that indicate potential reversals or continuations.
Combine price action signals with other technical analysis tools to increase the probability of successful trades.
Top Indicators for Forex Line Trading
As an active trader, you can customize Forex line charts with technical indicators like price, volume, and open interest.
These indicators are useful for analyzing short-term price movements and are commonly used.
In your Forex line trading journey, you’ll encounter two primary categories of technical indicators that assist in interpreting Forex line charts:
1. Overlays
These are indicators that are plotted directly on the price chart using the same scale. Examples include:
- Bollinger Bands
- Moving Averages
2. Oscillators
These are fluctuating indicators that plot above or below a price chart, oscillating between a local minimum and maximum. They provide useful insights into market momentum and potential reversals.
Examples include:
- MACD: Moving Average Convergence Divergence
- RSI: Relative Strength Index:
You have access to numerous technical indicators on tv.dhan.co. Choose the ones that work best with the way you trade.
These indicators can be integrated into automated trading systems. You can leverage our comprehensive platform to access many more such indicators and tools to upgrade your forex trading experience.
Conclusion
As you venture into the currency market armed with forex line charts, remember that the real value lies not just in the strategy but in its consistent and mindful application. Open an account with Dhan to start your forex trading journey.
Like this blog? Then you’ll love these: