A stock that goes up may come down shortly before. This is what retracement means. One way to identify retracement is to use a technical analysis tool as retracements are, at the end of the day, numbers that follow a pattern.
This is known as a Fibonacci Retracement in online stock trading. The tool is based on the Fibonacci Sequence’s basic tenets, according to which every number in the sequence is the product of its two numbers before it.
What is Fibonacci Retracement, and why does it matter to you as a stock market trader? The answer rests in understanding and applying the Fibonacci sequence to the markets.
The Fibonacci Sequence
The Fibonacci sequence is designed in such a way that a number is the sum of its two preceding numbers. Here’s the sequence in action:
0, 1, 1, 2, 3, 5, 8, 13, 21, 34, 55, 89, 144,…
Let’s pick a random number from this sequence, say 55. It is the sum of the two preceding numbers 21 and 34. Or, take 144. It is the sum of 55 and 89. Needless to say, this sequence can be extended to infinity.
Pick a number from the sequence above. Divide it by the previous number. You’ll get what’s known as the Golden Ratio.
- 55/34 = 1.618
- 89/55 = 1.618
Take a number from the sequence and divide it by the next number and you’ll notice a similar result again.
- 34/55 = 0.618 (61.8%)
- 13/21 = 0.618 (61.8%)
Take a number from the sequence and divide it by a number two places higher and you’ll notice a similar result again.
- 21/55 = 0.382 (38.2%)
- 34/89 = 0.382 (38.2%)
Repeat the same exercise by taking a number and dividing it by a number three places higher.
- 21/89 = 0.236 (23.6%)
- 34/144 = 0.236 (23.6%)
Leonardo Bigollo Pisano, an Italian mathematician, is credited with the discovery of the Fibonacci sequence, although the sequence or a form was used in ancient India. The mathematician was also referred to as “Fibonacci”.
Fibonacci retracement levels are calculated based on the high and low of a price movement, which can predict potential reversal levels. Traders often use Fibonacci levels with other technical indicators to confirm their trading decisions.
What is Fibonacci Retracement?
Fibonacci retracement levels in trading are horizontal lines that indicate potential areas where the price of a security may retrace and make a significant move. These levels, which represent the % retracement of the price move, are based on Fibonacci Sequence.
Traders usually rely on three key Fibonacci retracement levels, which are 61.8%, 38.2%, and 23.6%. The levels are calculated by measuring the distance between the high and low of a price movement and then applying the Fibonacci ratios to that distance to identify potential levels of support and resistance.
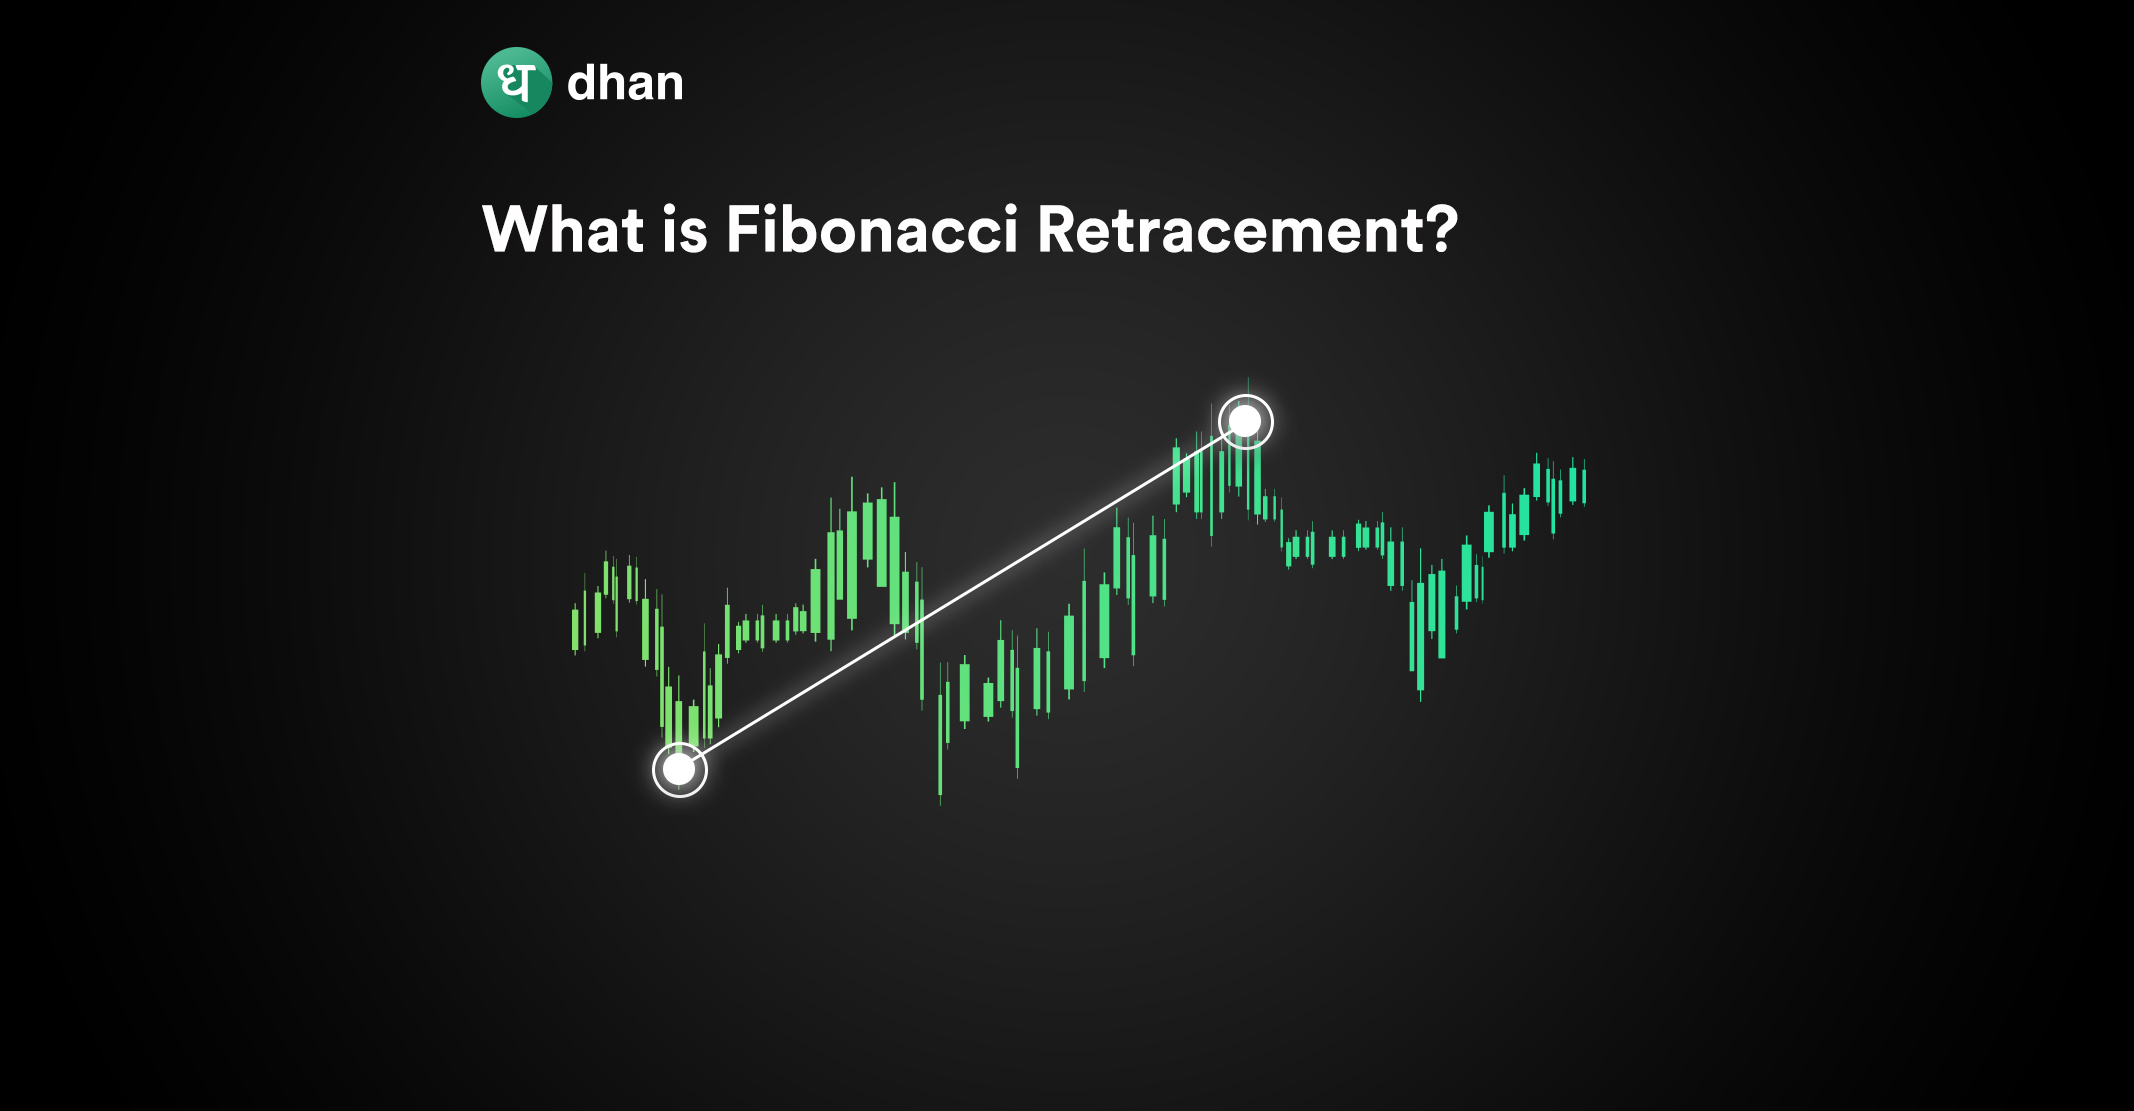
This is what the Fibonacci Retracement looks like on a chart:
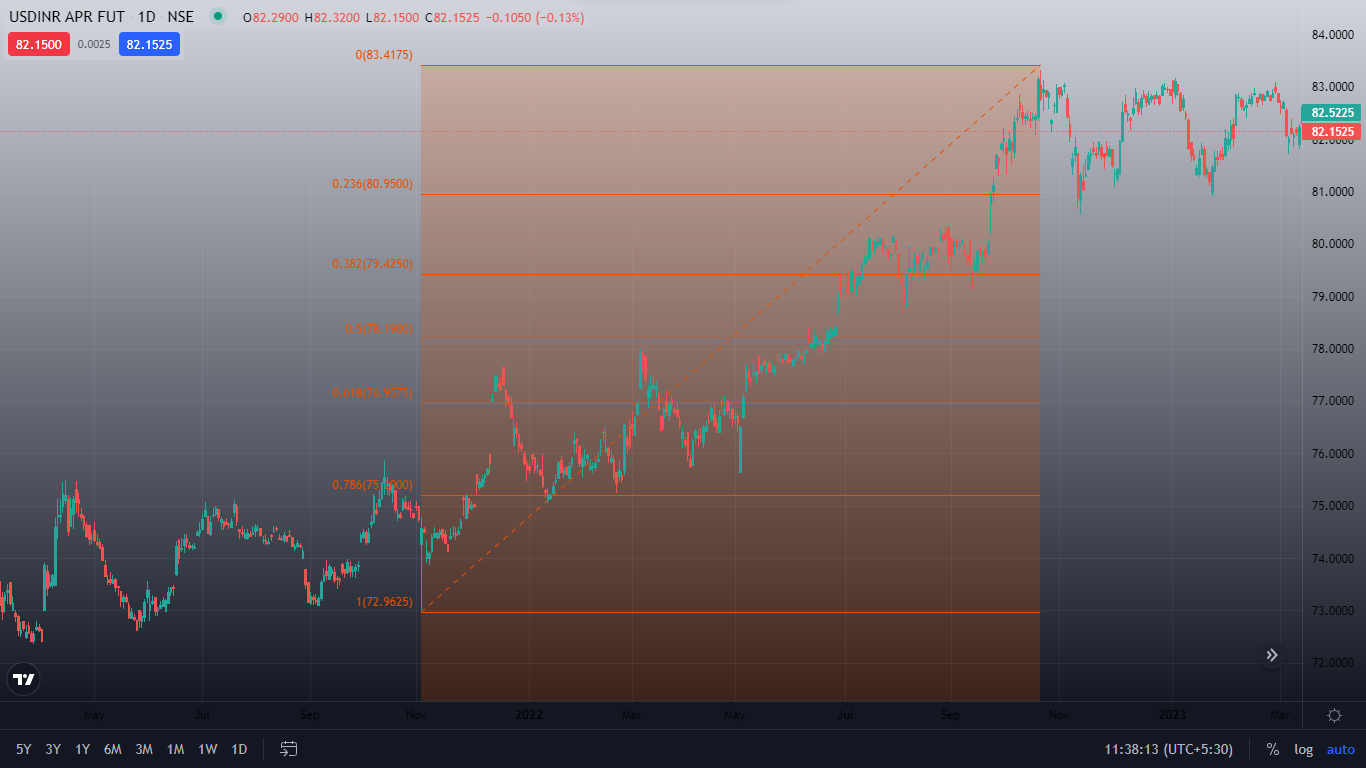
Fibonacci Retracement levels are interpreted as potential areas of support and resistance. When the price of an asset retraces to a Fibonacci level, it may encounter resistance or support, depending on the direction of the trend.
If the trend is bullish, the retracement levels may act as support, while if the trend is bearish, they may act as resistance.
There are many advantages of using Fibonacci Retracement in trading. One such advantage is that it helps traders identify potential support and resistance levels. This can help them make more informed trading decisions and reduce risk.
Fibonacci levels can also be used with other technical indicators, such as moving averages and oscillators, to confirm trading signals. Additionally, Fibonacci levels can be applied to any financial asset, including stocks, currencies, and commodities.
Fibonacci Retracement Strategies
Just using Fibonacci Retracement blindly won’t cut it. You will require proven strategies to make money in this game and Fibonacci Retracement is one of the best tools you can use. Here are some of the strategies to use that tool effectively:
1. Identifying Support and Resistance Levels
One strategy for using Fibonacci Retracement is identifying potential support and resistance levels. Traders can use the retracement levels to identify areas where an asset’s price may reverse.
For example, suppose the price of an asset is in an uptrend and retraces to the 50% Fibonacci level. In that case, traders may expect the price to bounce back from that level.
2. Identifying Trend Reversals
Another strategy for using Fibonacci Retracement is to identify potential trend reversals. Traders can look for divergences between the price and the Fibonacci Retracement levels.
For example, if the price is making higher highs, but the Fibonacci Retracement levels are making lower highs, this could signal a potential trend reversal.
3. Fibonacci Retracement with Other Indicators
Fibonacci Retracements can also be used with other technical indicators to confirm trading signals. Traders can use moving averages, oscillators, and other technical indicators to confirm that the price will likely reverse at a Fibonacci level.
For example, suppose the price is approaching a Fibonacci level, and the RSI is overbought. In that case, traders may expect the price to reverse.
Conclusion
We hope you now have a basic understanding of what is Fibonacci Retracement and how to use the Fibonacci series in the markets. It is one of the most common tools used by traders to determine support and resistance in the markets.