Measuring volatility can be a useful tool for understanding risk, value, and much more. Having an indicator that does it for you is even better. That’s what the Bollinger Bands indicator is all about.
What is the Bollinger Bands Indicator?
The Bollinger Bands is a volatility indicator that is used to identify whether the price of stocks, currencies, commodities, futures, or options is high or low across a period of time.
It is represented as an envelope above and below a Simple Moving Average (SMA) of the price. This envelope is known as the “bands”. The upper and lower bands are typically 2 standard deviations above and below the SMA.
Bollinger Bands were created in the 1980s by John Bollinger, who was an options and warrants trader at the time. For context, trading bands themselves weren’t an alien concept back then.
Traders used them quite frequently. However, Bollinger wanted to focus on volatility and how he could ask the market what was happening as opposed to telling the market what to do.
In the process, he experimented with various measures of volatility before choosing “standard deviation” as the cornerstone of his bands.
Standard deviations are known to be sensitive to extreme deviations, which can lead to a more nuanced understanding of not just volatility but also overbought and oversold price levels.
By the way, the bands Bollinger developed didn’t have a name until he went on a TV show and was asked what they were called. His reply? “Let’s call them Bollinger Bands”.
What you need to know is that the Bollinger Bands indicator can tell you whether a scrip or contract is oversold or overbought. What it can’t tell you is the entry or exit point for a trade.
You will have to combine Bollinger Bands with another technical analysis indicator to evaluate price action and get concrete buy and sell signals.
Bollinger Bands Calculation Explained
The formula for Bollinger Bands involves a Simple Moving Average and a standard deviation. Start by calculating the SMA for a set of periods (generally 20 days).
Move on to calculating the Standard Deviation for the same period. To get the upper band, add the standard deviation to the SMA. For the lower band, subtract the standard deviation from the SMA.
Typically, Bollinger Bands are plotted two standard deviations above and below a simple moving average. That’s all you need to know to calculate Bollinger Bands!
We've also covered other indicators like Average True Range and Average Directional Index.
How Does the Bollinger Bands Indicator Work?
You’ll see three lines when you use the Bollinger Bands indicator. The line in the middle represents a 20-day (or 21-day) SMA of the prices.
Furthermore, the line above is for the upper band that is plotted two standard deviations above the SMA. Finally, the line below is for the lower band that is plotted two standard deviations below the SMA.
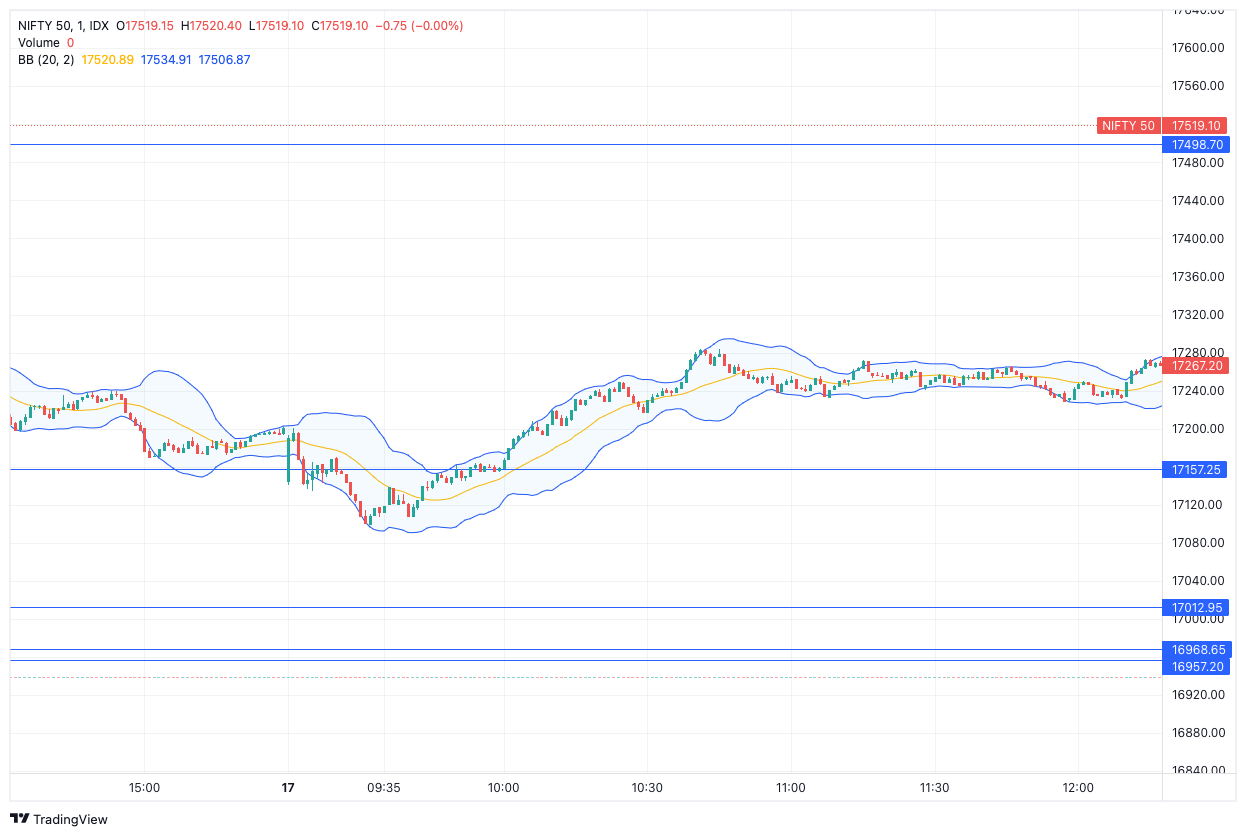
The cool part about Bollinger Bands is that the indicator can be used across any asset that you want to analyze. Visually, this is what a Bollinger Bands looks like.
These are the inferences you can draw from Bollinger Bands:
- If the upper band and lower band are a long way apart, there’s the presence of high volatility
- If the upper band and lower band are close together, there’s very low volatility
- If the price moves below the lower band, there’s a chance that it may bounce back
- If the price moves above the upper band, there’s a chance that it may retract to a lower level
The third scenario happens when the market is oversold. The fourth scenario happens when the market is overbought. Here’s the interesting part.
Expanding and contracting bands are expressed using the term “Band Width”, which is generally a percentage of the simple moving average.
The band width expanding and contracting denotes volatility. The creator of Bollinger bands believed that periods of low volatility are likely to be followed by periods of high volatility and vice versa.
These scenarios are known as the “Bollinger Band Squeeze”.
When a Squeeze happens, you can expect the volatility to rise or fall depending on the starting state of the bands. We’ll talk about the Bollinger Band Squeeze strategy in the next section.
Walkthrough of Bollinger Bands Trading Strategy
Meet Mr. Bol N Jer. He’s a trader who loves to use various indicators to sharpen his futures and options trading strategies. As it turns out, Bol N Jer wants to use Bollinger Bands to identify the volatility of currency derivatives.
He picks the USD-INR contract as an experiment. In theory, you’d expect a period of high volatility to follow after a period of historically low volatility with the help of the Bollinger Band Width.
That’s why Mr. Bol N Jer uses the indicator on Dhan’s TradingView charts to confirm this theory. The default setting for Bollinger Bands and Bollinger Bands Width is (20,2). The image below shows what he sees.

Turns out, the theory is more or less consistent. The purple box highlights the 5-year low volatility of the USD-INR currency futures. This period can be termed as “oversold”
The yellow box, which is plotted right after the purple box, highlights a period of very high volatility. This does, however, change towards the end of the yellow box.
Bollinger Bands Squeeze
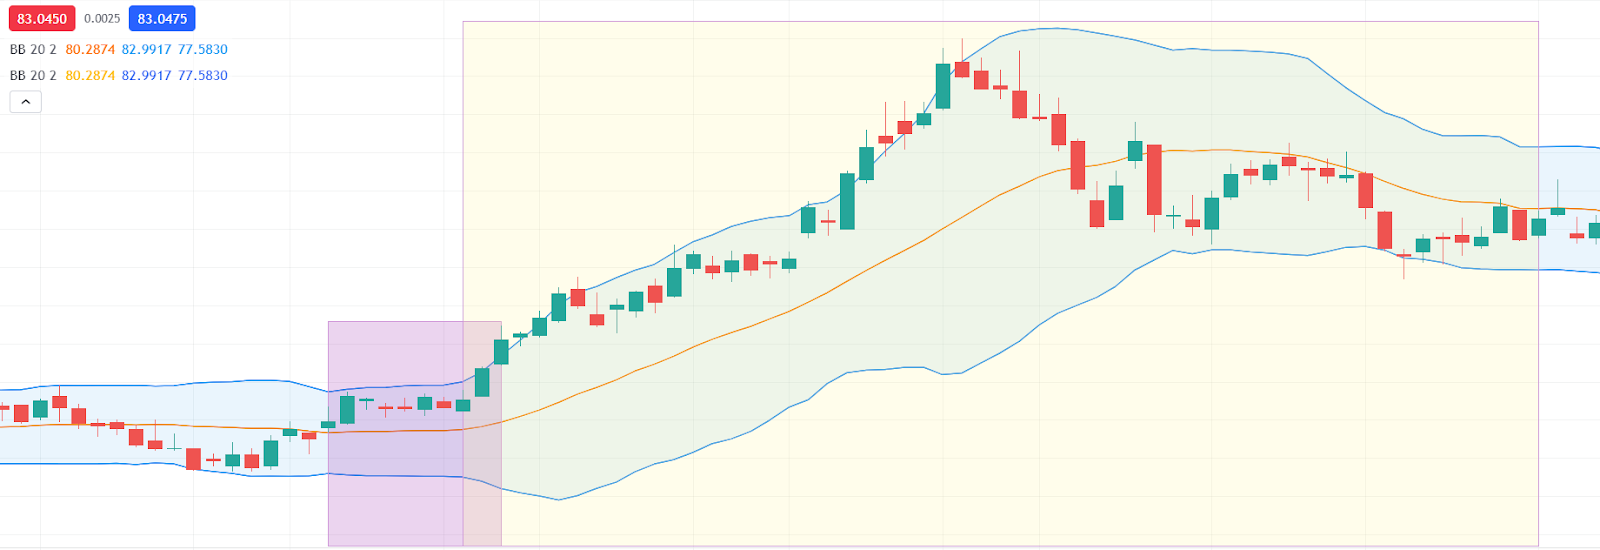
The Bollinger Bands Squeeze occurs in the purple box. Soon after, a “band break” happens. This is nothing but the movement of a candle above or below the Bollinger Bands.
If the candle moves above the upper band immediately after a Squeeze, it signals the beginning of a bullish move. If it’s below the lower band, it’s a bearish move.
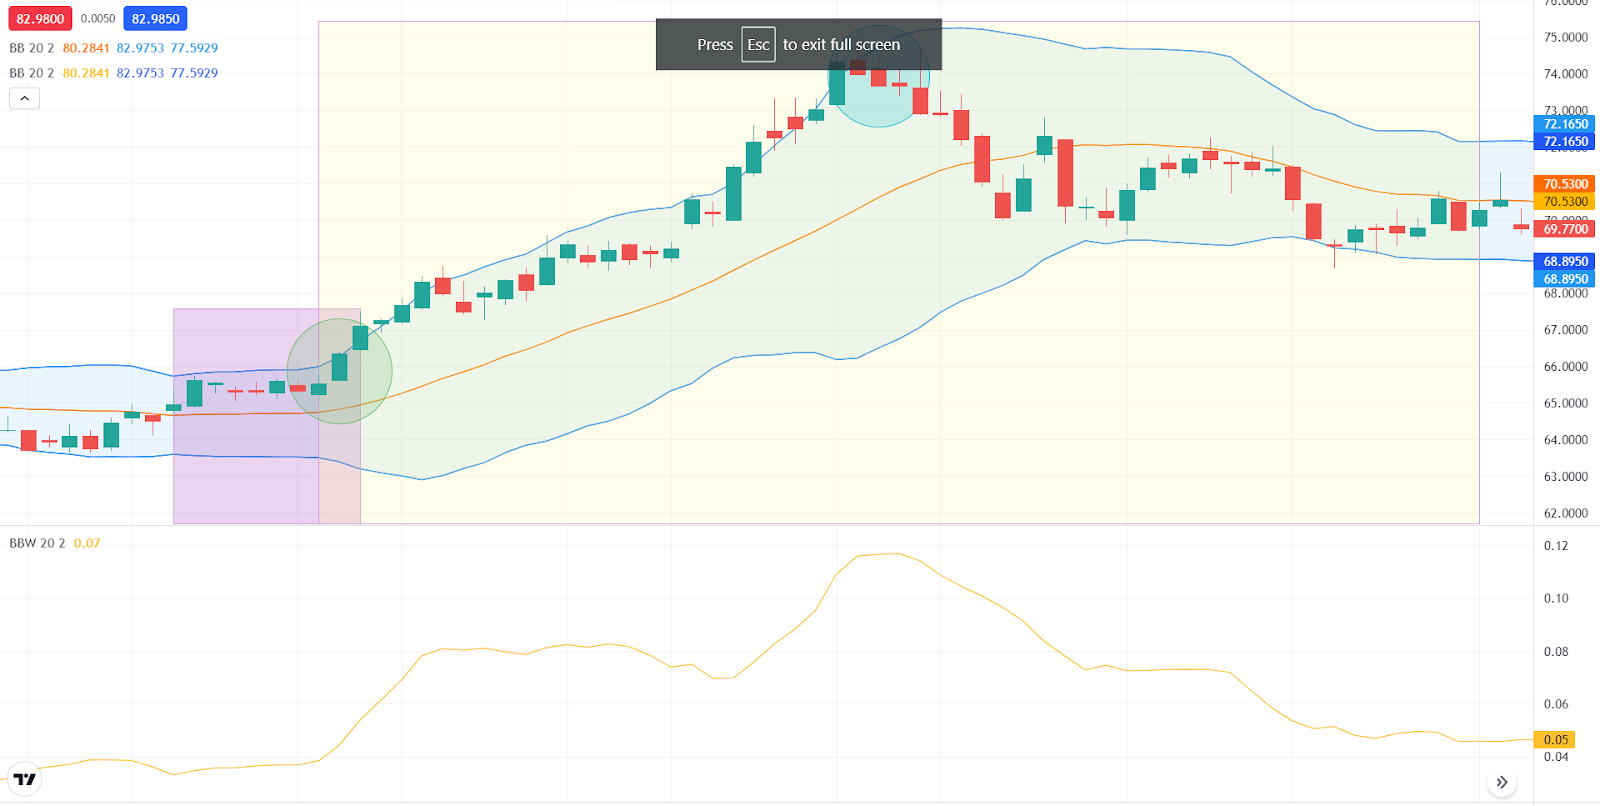
In this case, the candle breaks above the upper band. That’s where Mr. Bol N Jer enters the trade.
Bear in mind that a “fake break” may occur when a candle moves above the upper band but is unable to sustain the momentum.
The price continues to move and eventually, an entire candle breaks below the upper band. That’s when Mr. Bol N Jer exits the trade. Once again, fake breaks may occur in such scenarios as well.
As you can tell, a Bollinger Bands trading strategy is useful for identifying volatility, not entry and exit points. This is the reason why it must be used in conjunction with other technical indicators.
Pros & Cons of Bollinger Bands Indicator
| Pros of Bollinger Bands | Cons of Bollinger Bands |
| Indicates low and high volatility | Can’t indicate entry and exit points |
| Can be used for all segments | Has to be used with another technical indicator |
| Depict current market movements accurately | Can’t forecast future movements as a lagging indicator |