What is Swing Trading?
Swing trading is a short-term strategy involving buying a financial instrument and selling it within days, weeks, or months to make small, incremental gains.
Gains as a result of this strategy can range from 5% to 7% per trade. You might be tempted to think that this is paltry in comparison to, say, long-term investing where the returns could go beyond 12-15%.
But a swing trader can make 5% to 7% per trade, meaning their overall returns could be even higher when taking all trades into account. This is great but what about the elephant in the room?
We’re talking about the “swing” in swing trading. You see, price fluctuations are a common theme in the financial markets.
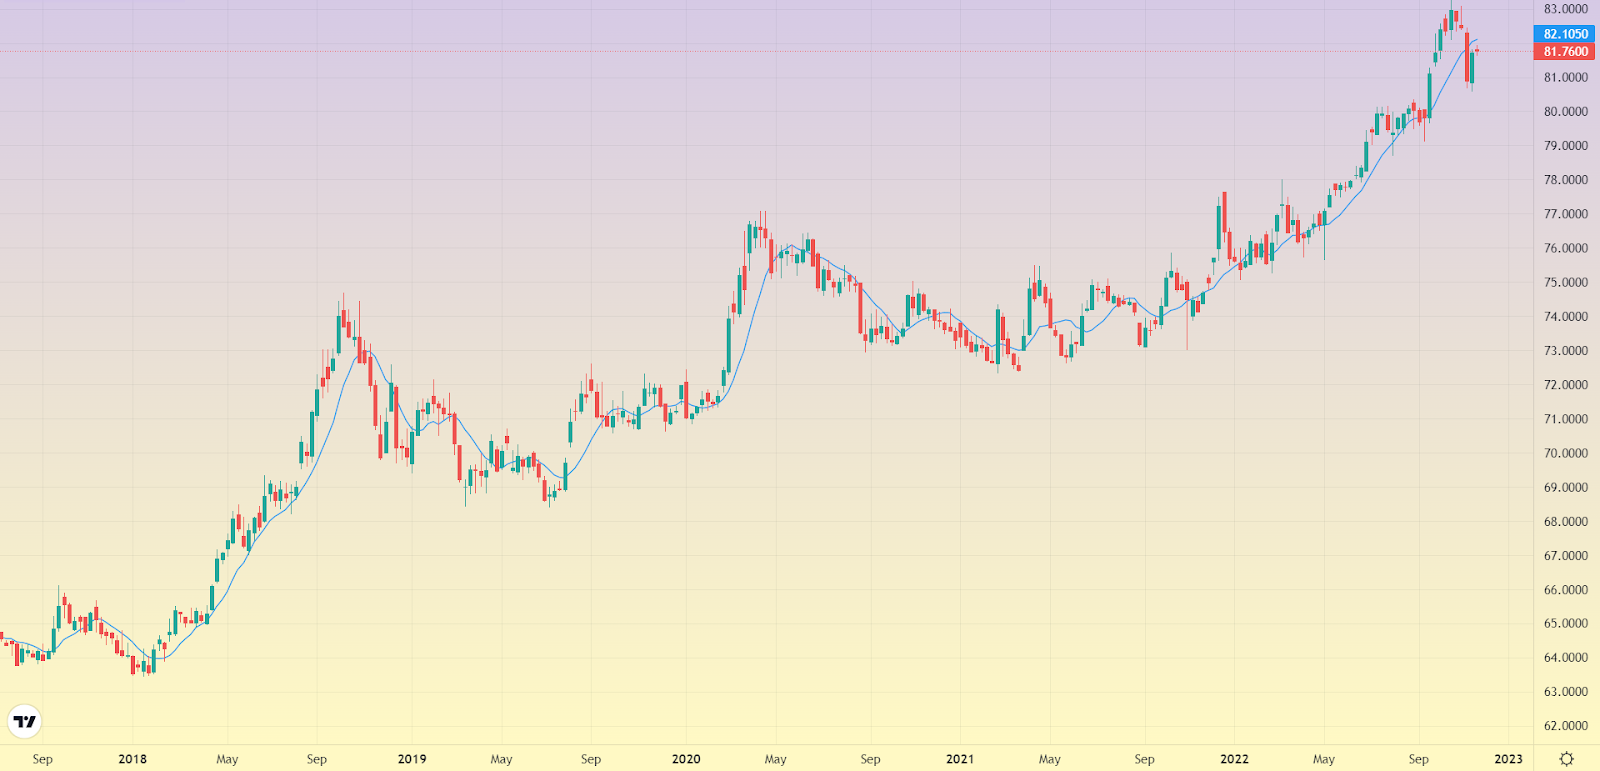
Take any security’s chart and you’ll notice the fluctuations playing out in spurts or consistently across a period of time. We’ve added an image below to help you visualize.
These fluctuations are known as swings and can generate a window of opportunity where there’s money to be made.
The goal of swing trading is to capture these swings to generate incremental profit per trade. Thus the name “swing trading”.
Swing trading blends the high-intensity approach of intraday trading with the casual, laid-back approach of long-term investing, making it convenient for a variety of market participants.
However, you must note that every swing trader’s philosophy may be different. As a result, one trader may ride a swing for 7 days while another may exit within a month or two.
How Does Swing Trading Work?
The two key ingredients that you need to make swing trading work are volatility and liquidity. The other components are technical indicators and solid trading strategies.
If there’s no swing in prices, how will you benefit from it? That’s why volatility is the first caveat.
However, there’s a difference between good volatility and too much volatility. Good volatility happens when the market is relatively strong and flush with liquidity (we’ll get to that later).
Instead of putting yourself in the shoes of a swing trader, imagine the difference between eating one piece of cake and twenty pieces of cake. Nothing good can come out of the latter.
Similarly, too much volatility has the potential to ruin swing trades. Healthy volatility levels the playing field. The other component we spoke about briefly is liquidity.
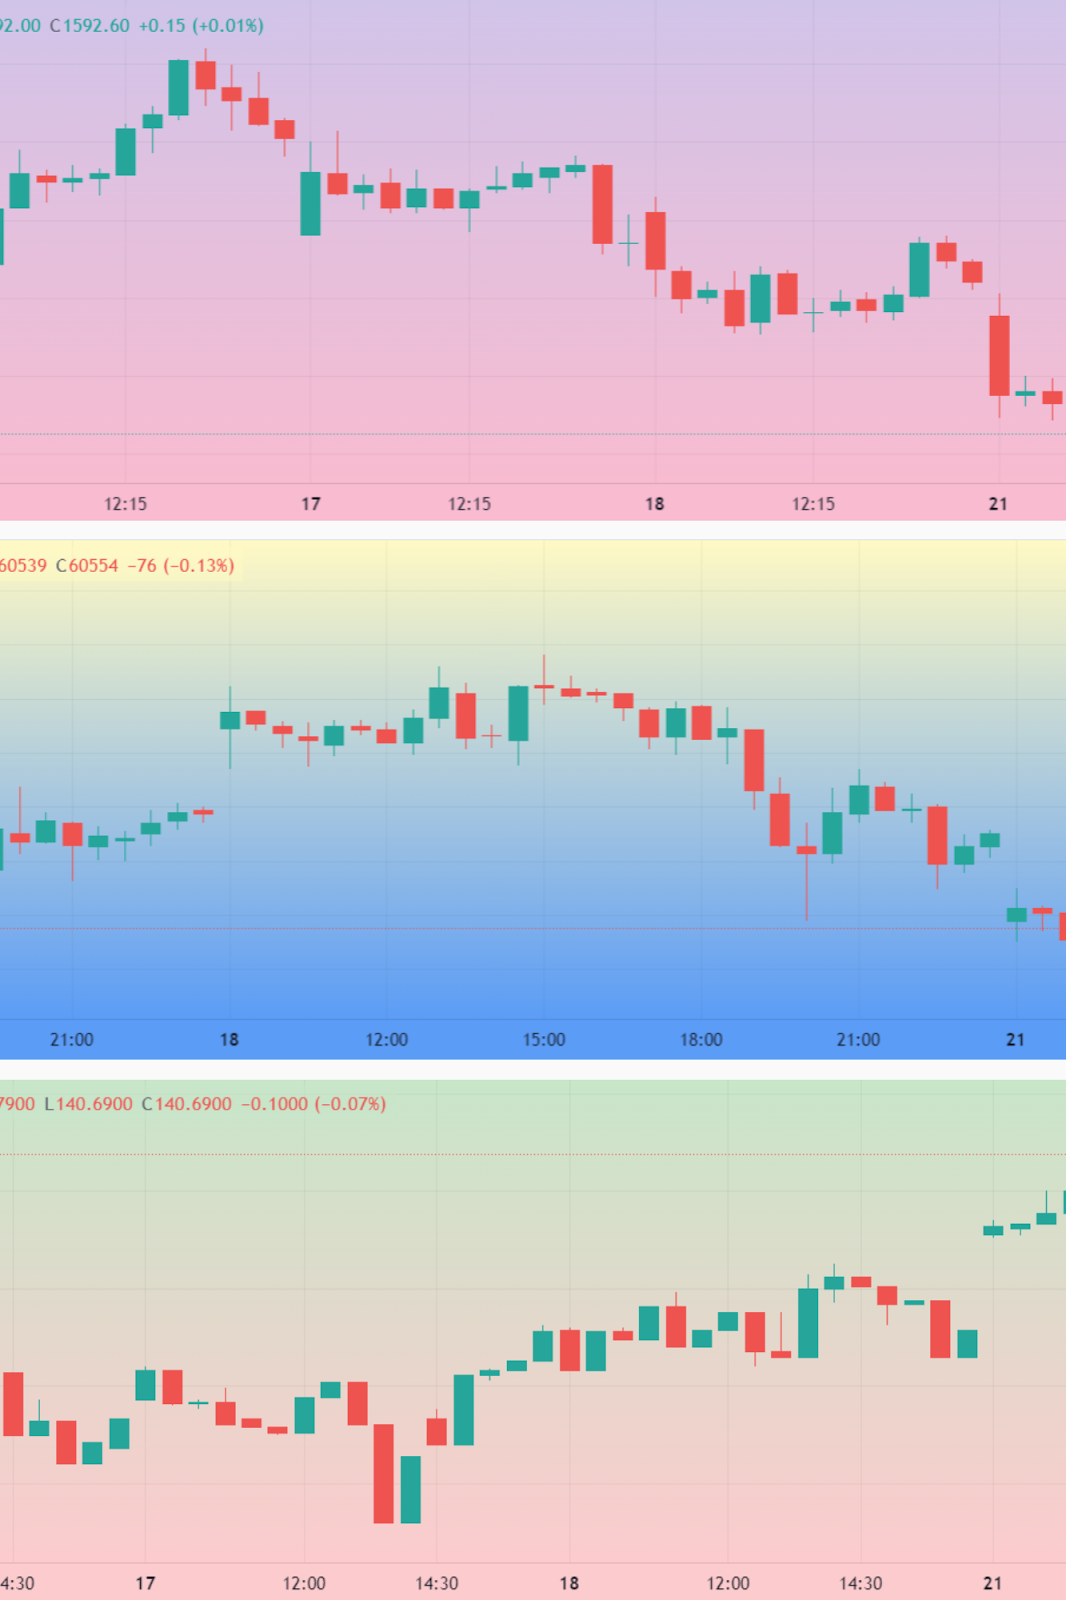
Liquidity is what defines whether or not you can sell a stock or derivative contract quickly in exchange for cash. If you can’t exit a position, what’s the point, correct?
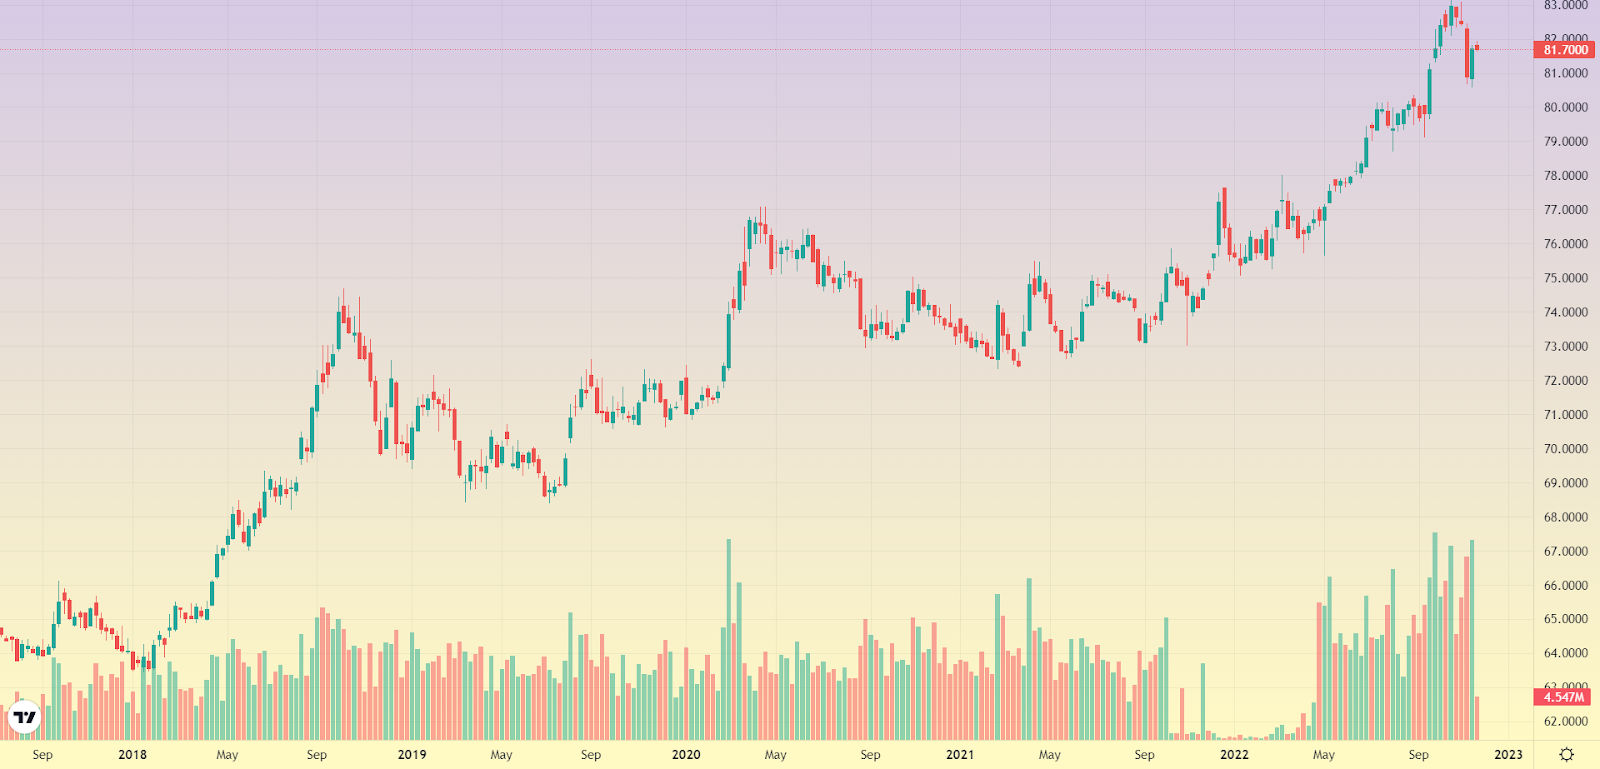
Here’s a visual example of flush vs dry liquidity. The yellow box highlights good liquidity while the blue box indicates low (dry) liquidity.

You could also say that liquidity is directly proportional to the volume because the latter is a measure of the scrips/contracts exchanging hands.
Common examples of highly liquid securities are as follows:
- Large-cap stocks
- Crude Oil
- Natural Gas
- Gold
- USD-INR futures
Once these two key ingredients are in place for a security, it’s time to evaluate the best indicators for swing trading.
Best Indicators for Swing Trading
A technical indicator is designed to help you trade by analyzing or forecasting trends, volume, and other important factors.
The process of using technical indicators to analyze a security is known as technical analysis.
Considering these are super important for swing traders, we’ve compiled a list of the best indicators for swing trading.
- Relative Strength Index (RSI)
- MACD
- Moving Averages
- Volume
- Bollinger Bands
1. Relative Strength Index (RSI)
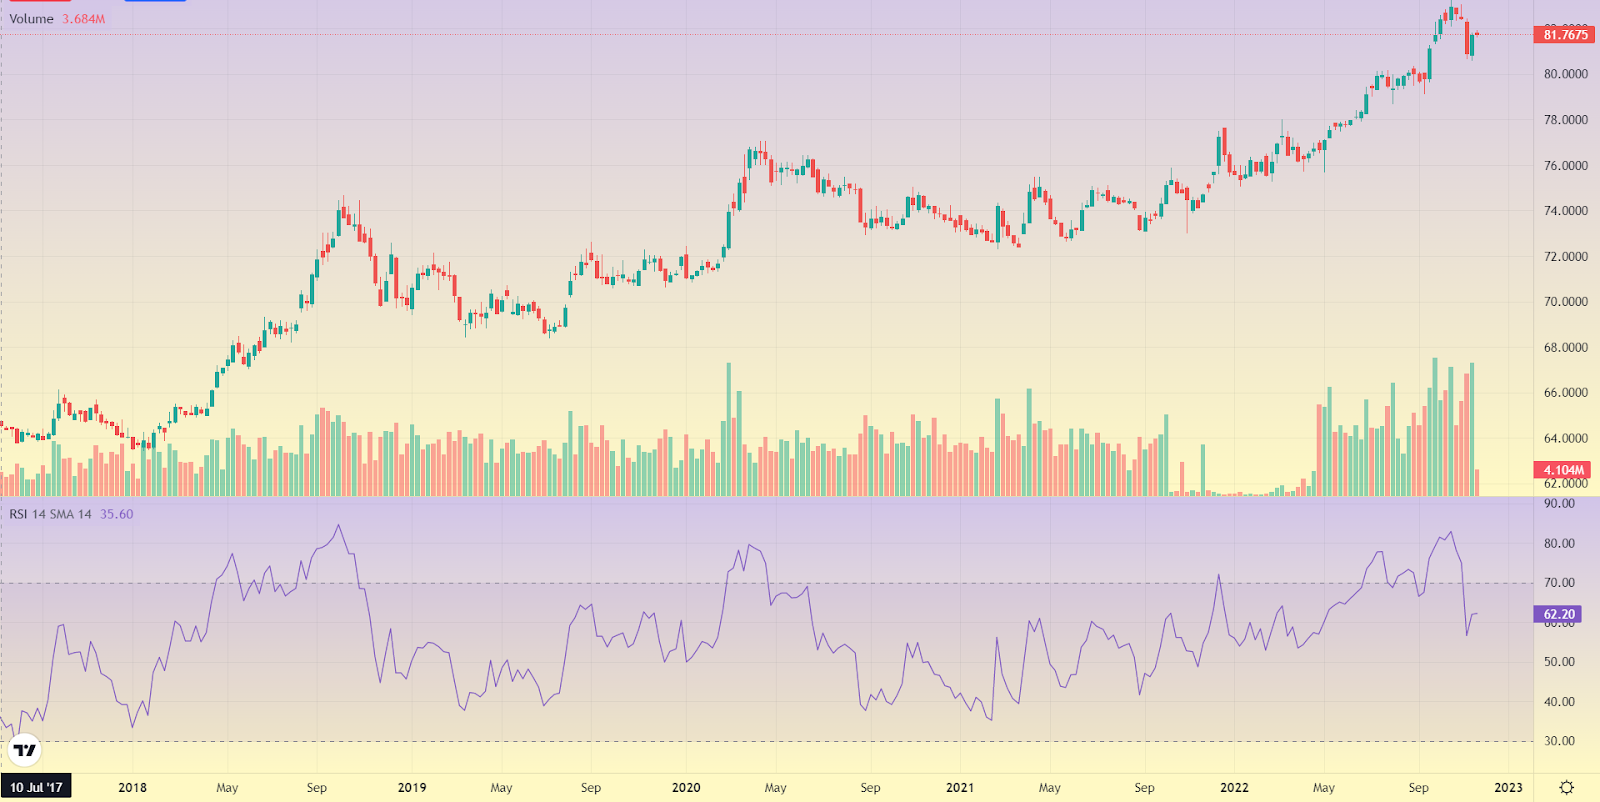
The RSI is a momentum oscillator that’s used to identify general trends for swing trading. You’ll get a value from 0-100 if you use the indicator.
If the RSI value is above 70, then the security is overbought. If it’s less than 30, then it’s oversold. Furthermore, there’s a concept known as RSI Divergence that’s specially useful for swing trading. Here is a video that explains RSI Divergence:
Here’s what RSI looks like on a chart, shown via currency futures in the following screenshot.
2. Moving Average Convergence/Divergence (MACD)
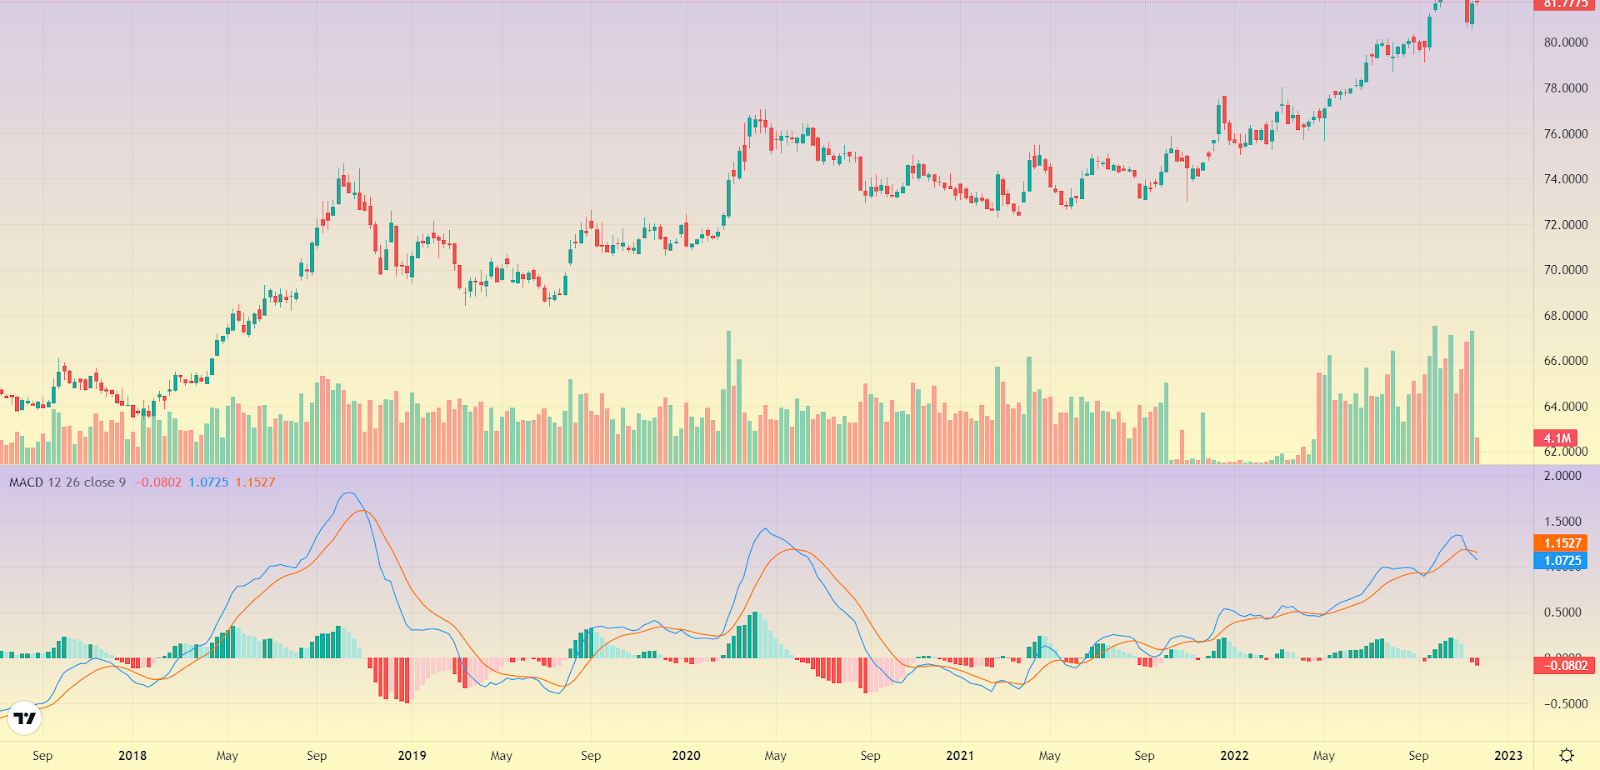
MACD is a momentum indicator that’s used to generate signals for swing trading. This simply means that MACD can act as a trigger for buying and selling a security.
Once you select the MACD indicator on candlestick charts, you’ll see a line and a histogram that will rise or fall, signaling bullish or bearish momentum.
The following screenshot shows what MACD looks like on a chart.
3. Moving Averages
Moving Averages are a technical indicator used to figure out what direction a security’s price is headed toward. As you can tell, this can be super useful for swing trading.
In terms of simplicity, this indicator takes the cake as:
- Rising Moving Averages indicate that a security is making a bullish move
- Falling Moving Averages indicate that a security is making a bearish move
4. Volume
If there was ever an indicator that’s crucial to swing trading, then it’s volume. You see, there’s a strategy called Price Action where a swing trader looks at nothing but the price of a security before trading.
While that’s a simple version of the strategy, the more nuanced approach to it is to look at volume on top of the price. Volume is the rate at which a security changes hands.
If there’s high volume, then the security is desirable – many traders are buying and selling it, meaning it’s ideal for swing trading.
However, if there’s no volume then the security may not be the right fit for a swing trade. Either way, this is what the volume indicator looks like on a candlestick chart when you’re swing trading.
5. Bollinger Bands
The Bollinger Bands Indicator measures volatility and can tell you whether a security is overbought or oversold. That’s not all.
There’s also a phenomenon called “Bollinger Bands Squeeze” that signals the oncoming of explosive volatility.
That’s why it’s used for swing trading, typically in conjunction with other indicators like the RSI which we spoke about earlier.
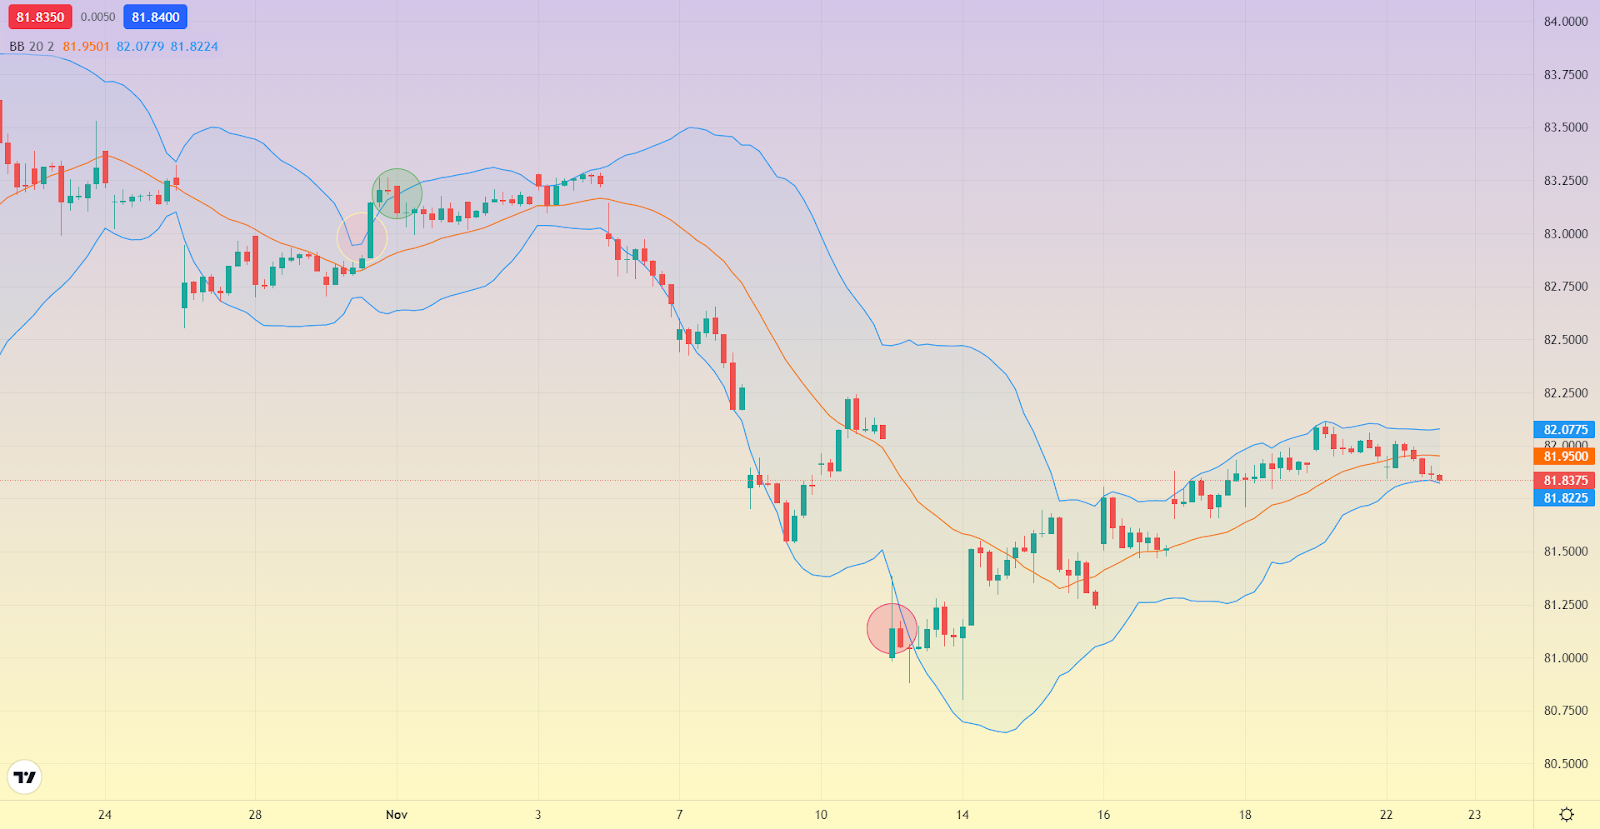
You’d be interested in seeing what Bollinger Bands looks like on a chart. It’s made up of three lines – the upper, middle, and lower bands.
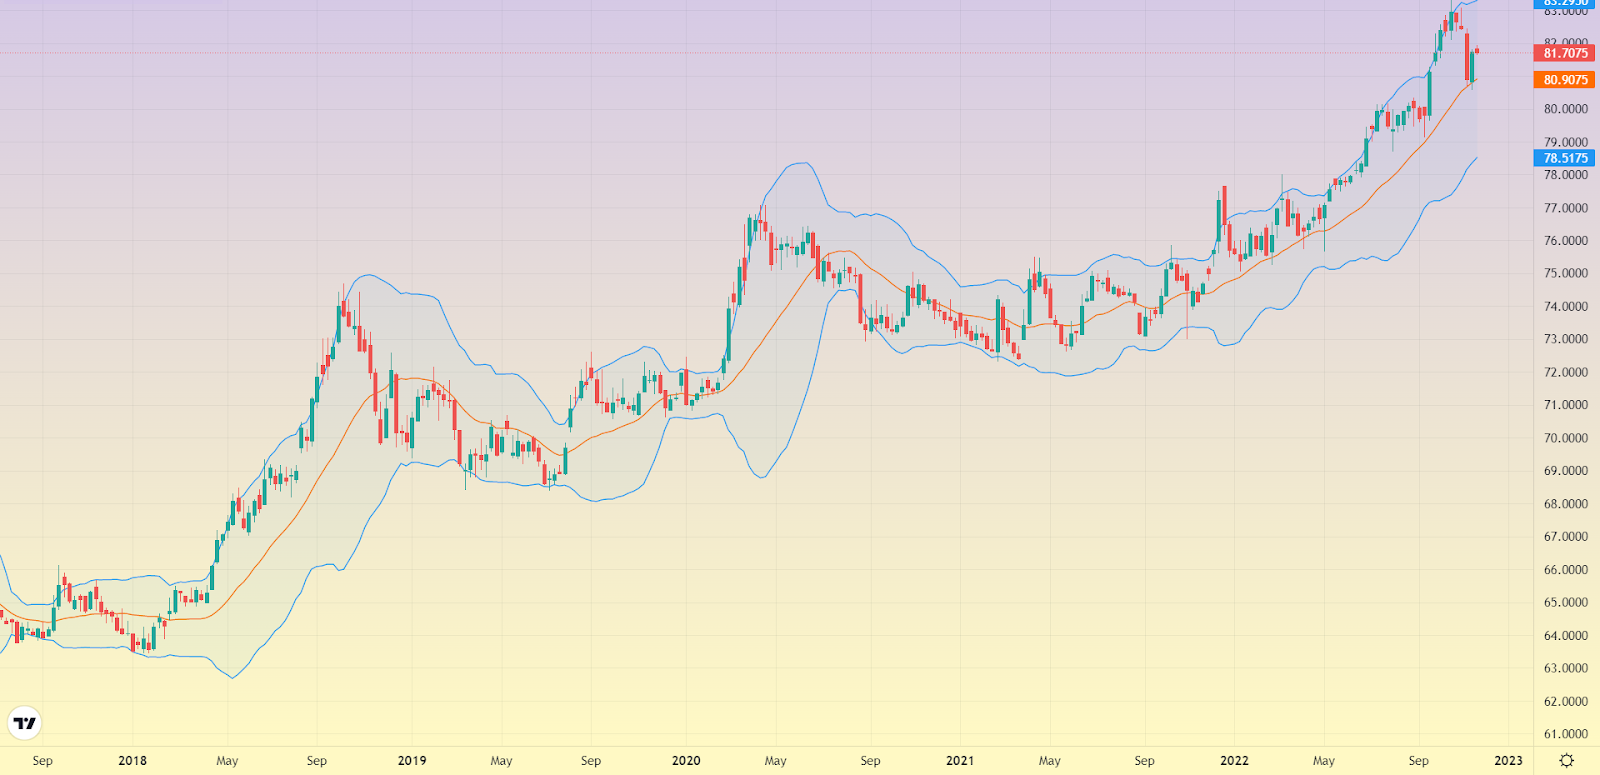
To understand what each band signifies, read this blog: The Complete Guide to Bollinger Bands Indicator
Example of Swing Trading
Meet Mr. Shwing Es Khing. He’s good at swing trading currency pairs, especially USD-INR. One could say that he loves swing trading and believes it to be the best strategy for wealth creation.
After having breakfast, Mr. Khing notices that his trading system is going berserk – he’s getting alert after alert because a specific price level has been triggered in the USD-INR futures contract.
Turns out, the Bollinger Bands Indicator has spoken – while volatility is relatively low, it is expanding and multiple candles have broken above the upper band.
This indicates that the price of USD-INR may fall. See the image below to know more.
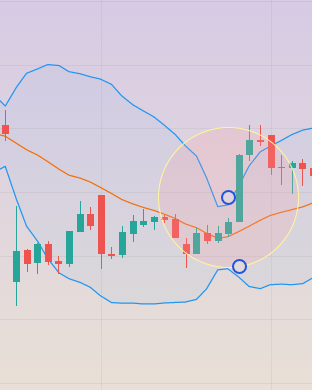
For Mr. Khing, this is good news. He’s a swing trader and steadily expanding volatility like this could only mean one thing – more price swings!
Mr. Khing sets the chart timeframe to 60 minutes, which, by the way, is a common setting used by swing traders. On top of that, he adds a couple more indicators to solidify support and resistance.
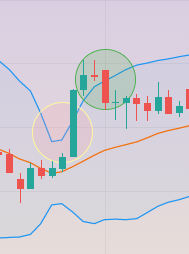
Being the shrewd trader that he is, Mr. Khing decides to “short” the contract at 81.6950, highlighted as the Green Circle in the image above.
Shorting means selling a security you don’t have. This is legal but comes with a caveat - you’ll have to offset the trade by buying the same quantity of contracts/shares later on.
Great – he’s booked a profit of Rs. 81,695 by selling what he doesn’t have. This implies that Mr. Shwing Es Khing has to make an opposite trade, meaning he will have to buy the same quantity of contract(s).
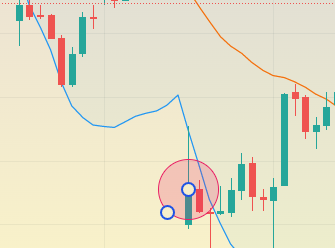
He listens to the markets keenly with his indicators and on 11th November, there’s another breakout below the lower band. The implication is that the price of the contract may rise now.
That’s when he decides to buy the USD-INR contract. This time, Mr. Khing has to pay Rs. 80,965. As a result, his net profit from this swing trade is Rs. 81,695 – Rs. 80,965 = Rs. 730. This may seem tiny but imagine registering a profit of Rs. 730 at scale.
Here’s the entire lifecycle of Mr. Shwing Es Khing’s swing trade of the USD-INR contract in the image below.
P.S: We’ve excluded margin and leverage to make the example simple. You can read about how both work here:
Pros & Cons of Swing Trading
| Pros of Swing Trading | Cons of Swing Trading |
| Simpler than day trading | Prone to overnight and weekend risk |
| Potentially lucrative in the short term | May miss long-term gains and trends |
| Uses technical indicators & analysis | Timing the market can be difficult |
Building the Right Mindset for Swing Trading
Any trader can tell you that building the right mindset is crucial for being successful in swing trading.
Success goes beyond analyzing charts and identifying trading opportunities – it’s about figuring out how to be disciplined, patient, and emotionally resilient.
These qualities are incredibly useful when the market moves against you. We’ve discussed the importance of building the right mindset for swing trading. Let us now get into the finer details of it.
1. Think Long Term
While swing trading focuses on short-term moves, it’s important to maintain a long-term perspective. Recognize that individual trades are just parts of a larger trading plan.
Losing a lap does not mean you’ll lose the entire race. That’s why it is better to focus on the overall profitability of your strategy as opposed to the outcome of each individual trade.
2. Patience and Discipline
Any form of trading requires patience. Swing trading is no different.
It’s essential to wait for the right setups and not force trades out of impatience or fear of missing out.
Stick to your predefined trading rules and strategies, and avoid chasing after every market fluctuation. Discipline yourself to enter and exit trades based on your predetermined criteria, right from your profit target to trailing stop loss.
3. Set Realistic Goals
The first step to being realistic about swing trading is to understand that not every trade will be a winner. Losses are a natural part of trading, and few losing trades should not lead you to impulsive decision-making.
Focus on the process, continuously learn from both winning and losing trades, and aim for consistent profitability in the long run.
4. Learn, Unlearn, and Relearn
The market is ever-changing and you as a swing trader need to evolve, adapt, and overcome. Be open to learning new techniques, exploring trading strategies, and staying updated with trends.
5. Plan for Risk
A strong risk management mindset is essential for swing trading. Two pointers here. Preserving capital is important. Losses are inevitable. Your risk management technique will try to bridge the gap between the two.
Difference Between Positional Trading and Swing Trading
While going through this blog about swing trading, you must’ve noticed a couple of things. First – swing trading involves taking delivery of shares. Second – swing trades can last for months.
Because of these two factors, in particular, it wouldn’t be surprising that many people become confused between positional trading and swing trading.
Truth is, positional trading is just another term for long-term investing. As you can tell, long-term investing involves taking delivery of shares and can last easily for months.
However, the primary difference between positional trading and swing trading is conviction.
A positional trader focuses on the long term (fair value) and will be unbothered about short-term price swings, whereas a swing trader focuses specifically on short-term volatility to make money.
It’s like riding a bicycle versus riding a Ferrari. Both get you from Point A to Point B. But one takes a slow and steady approach while the other travels at the rate of knots.
We’ve covered all the differences in this blog: Swing Trading vs Long Term Investing
The following table contains a summary of the differences between positional trading and swing trading:
| Positional Trading | Swing Trading |
| Long term overview | Short term overview |
| Fundamental analysis | Technical analysis |
| No short term profit book | Short term profit booking |
| 10-16% long term returns | 5-7% returns per trade |
Things to Remember When Swing Trading
Applying any strategy in the real world has its pros and cons. Moreover, it has implications in the form of commitment (time, effort, and both).
When you’re swing trading stocks, for example, you’ll have to ensure that you have a trading setup that’s designed to carry out smooth and efficient short-term trades.
In fact, you should know the following things before you get started with swing trading:
- Risk Profile
- Technical Analysis
- Position Size
- Market Conditions
1. Risk Profile
Your risk profile is what determines your ability to participate in the markets. It’s a measure of the risk you can handle, more simply, the amount of money you can afford to lose.
While there are multiple factors that determine risk profile, age and income are known to be the primary drivers. Think of the following personas:
- Mr. Shwing Es King aged 29 with an income of Rs. 50 LPA.
- Mr. Karan C aged 21 with an income of Rs. 5 LPA.
Who do you think can afford to lose more? The thing is, any answer would be incorrect because we don’t know their liabilities (family, rent, loan, etc).
That’s why it’s important to thoroughly analyze your risk profile before entering the markets, not just while swing trading.
2. Technical Analysis
Across this story about what is swing trading, we’ve discussed the role of technical analysis – it’s the bedrock of the strategy. That’s why it’s important to understand how technical analysis works.
Broadly speaking, you’ll have to employ technical indicators like Anchored VWAP, Bollinger Bands, RSI, and others.
P.S: Technical analysis has got everything to do with trends, patterns, momentum, volume, and much more, but nothing to do with fundamentals. This is an important distinction.
Read this story to know why: Difference Between Fundamental and Technical Analysis
3. Position Size
Your position size will be a product of your risk profile. However, you could have a predetermined risk percentage per swing trade or for your overall capital.
For example, Mr. Shwing Es Khing could have a starting capital of Rs. 10,00,000 and could risk:
- x% of his capital per trade
- Whatever his risk profile determines
4. Market Conditions
We’ve spoken about how too volatile or too weak markets are less than ideal for swing trading. Just like spring is the ideal season for going on vacations, you’ll have to find the “spring” of the markets.
That said, there are traders who enter swing trades during extremely volatile markets. But these are generally seasoned practitioners of the trade.
P.S: Some swing traders also like to keep an eye on the US market as a leading indicator for the Indian market. You can check global indices on Dhan!
Is Swing Trading a Good Strategy?
Swing trading is a strategy that falls between intraday trading where positions are squared off in the same trading session and long-term investing where positions are held for a year or longer.
It has its pros and cons when it comes to wealth creation and execution. Compared to intraday trading, swing trading is a low effort but the profits it may generate are relatively less per trade.
However, swing trading is typically known to be a good strategy to follow for those who want to transition from long-term investing into pure trading principles like day trading or scalping.
Happy Trading!
By the way, margin funding or Margin Trading Facility is one of the best features a swing trader can access. The following video can tell you more about it.