What is the Average Directional Index (ADX)?
The Average Directional Index (ADX) is a technical indicator that is used to measure the strength of a price trend over a period of time. Doing so allows traders to identify entry and exit points for every trade.
Every technical analysis indicator has a story and so does ADX. The indicator is a part of a larger directional index developed by J. Welles Wilder.
By the way, Mr. Wilder also developed the Average True Range (ATR), an important component of ADX that we’ll speak about later.
The goal of ADX is to show you where the market is heading so that you can move in the same direction. Because it is trend agnostic, ADX is classified as a non-directional indicator.
If you’re wondering what that means – a trader who uses non-directional indicators moves with the market, regardless of whether it’s a positive or negative trend.
With that being said, ADX is derived from a combination of a positive directional movement line (PDI) and a negative directional movement line (NDI). PDI is used to measure a bullish trend while NDI is used to measure a bearish trend.
The combination and a bit of math lead to an ADX value that falls between 0 to 100. This is the value that depicts the strength of a trend. Here’s how to interpret the ADX values:
- < 25: Weak trend
- > 25: Strong trend
ADX is the go-to trend indicator for many traders and it can be used to understand the price trend of stocks, commodities, currencies, and other financial securities.
Formula to Calculate Average Directional Index
The ADX is calculated by taking the mean or average of at least 14 observations. This simply means that you’ll need to calculate the Directional Index (DX) for 14 values (at least). You can, of course, select a time period of your choice.
The first step is to calculate the Positive Directional Movement Line (PDI). Do this by subtracting the previous high from the current high to get the Positive Directional Movement. We’ll call this PDM.
Divide PDM by the Average True Range and multiply the result by 100 to get the PDI. Mathematically, it looks like this:
PDI = (Current High – Previous High / ATR) x 100
Next up, you’ll have to calculate the Negative Directional Movement Line (NDI). Do this by subtracting the current low from the previous low to get the Negative Directional Movement. We’ll call this NDM.
Divide NDM by the ATR and multiply the result by 100 to get the NDI. Mathematically, it looks like this:
NDI = (Previous Low – Current Low / ATR) x 100
Once you’ve got the PDI and NDI for one set, calculate the DX using this formula:
DX = (PDI – NDI / PDI + NDI) x 100
Repeat this for the rest of the 13 values. Once you have all 14, you’re ready to calculate the ADX!
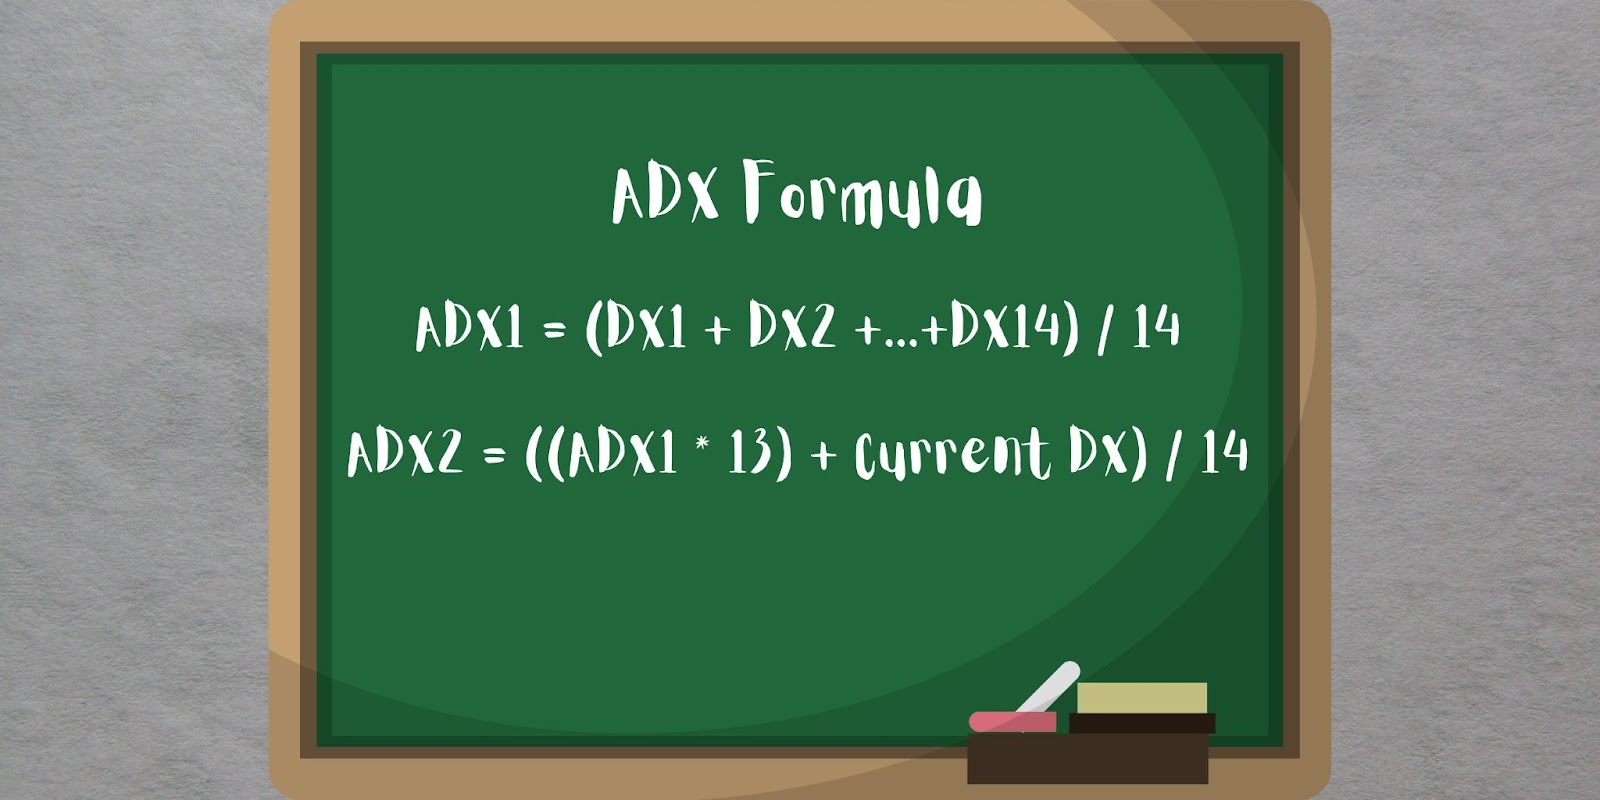
The Average Directional Movement Index formula is the average (mean) of a set of DX values across a specific period of time. Thus, the formula to calculate ADX mathematically is as follows:
ADX Indicator Formula = (DX1 + DX2 +…+DX14) / 14
This is the formula you’ll use when you calculate the ADX for the very first time. You can get the ADX from the second time onward using this formula:
ADX = ((ADX1 * 13) + Current DX) / 14
In case you don’t know what ATR is, check 👉 Definition of Average True Range
How Does Average Directional Index Strategy Work?
The ADX will give you a result that lies between 0 to 100. You can interpret the trend based on the results.
- If the ADX value is less than 20, there’s no trend you can chase.
- If the ADX value is less than 25, then the trend is weak.
- If the ADX value is higher than 25, then the trend is strong.
- Once the ADX value (rapidly) rises from its lows, the market is considered to be moving toward a strong trend.
- Once the ADX value (rapidly) retracts from its highs, you may want to reconsider your position because the trend is tapering off.
Bear in mind that the ADX is a trend strength indicator made up of PDI and NDI, representing a positive and negative trend direction respectively.
Example of ADX Strategy
Here’s an ADX strategy in motion. Meet Mr. Av Raj. He’s a non-directional commodity trader who relies on the ADX to help him analyze securities.
The clock strikes 9 AM, which means the commodity market hours have officially begun! Mr. Av Raj is on his web trading platform and uses charts to analyze Crude Oil.
He notices that the ADX value of Crude Oil futures is below 20. This means Mr. Av Raj doesn’t have any trend to go on. That’s why he moves on to another trade.
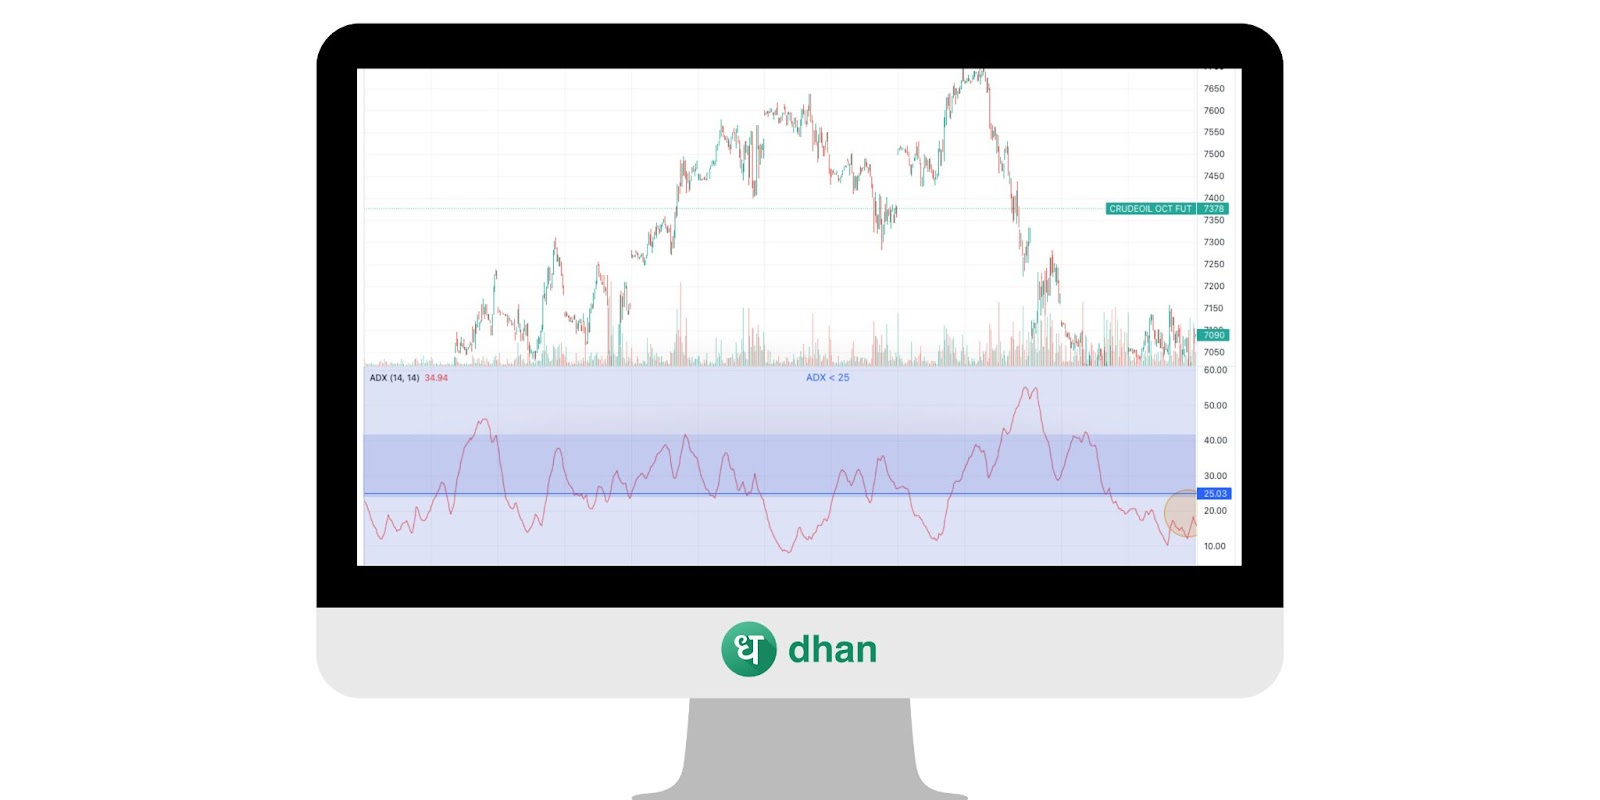
The second session of the commodity market begins and Mr. Av Raj notices that there’s something different about Crude Oil futures. The ADX value is now over 25.

What does Mr. Av Raj do? He allows the trend to breathe a little while he goes and makes his coffee. As soon as he’s back, the ADX value begins to rise further. This is when Mr. Av Raj makes a trade.
A few sessions pass and now Mr. Av Raj is on his commodity trading app. He notices that the ADX value has fallen by 4-5 units. This is his signal to exit or at least revisit his trade. That’s what he does.
Average Directional Index Values & Meaning
| ADX Value | Meaning |
| 20 or less | No trend |
| 20-25 | Emerging trend |
| 25-40 | Trend confirmed |
| 40+ | Strong trend |
| 50+ | Very strong trend |
| 70+ | Power trend (rare) |
Conclusion
The ADX is an indicator that allows you to understand the strength of a trend. Using it, you can decide whether to move with a trend or not. However, you should know that ADX is a lagging indicator.
What this means is simple – ADX won’t give you real-time trend strengths. What you’ll get is a trend strength that’s post hoc. Either way, it’s known to be a useful indicator.
Best part? You can access it for free with TradingView on Dhan! Not on Dhan? Open Demat Account
Loved this? Read more:
- Best Forex Trading Strategies for 2022
- What’s UPI: A Game-Changing Technology?
- What a Pip in Forex Means
FAQs
Q. What are the 3 lines in the ADX indicator?
J. Welles Wilder’s Direction Movement Index comprises three lines – the ADX Line, PDI Line, and NDI Line. The ADX indicates the strength of the price trend while the Positive and Negative Directional Indicators measure the uptrend and downtrend.
Q. What is a good average directional index?
An Average Directional Index value that is higher than 25 indicates a solid trend presence. If the value is above 40, the trend is known to be strong. Any ADX value above 50 indicates a very strong trend.
Q. How do you calculate the average directional index?
Calculate the ADX for a set of 14 values with the formula (DX1 + DX2 +…+DX14) / 14.