Harmonic patterns are powerful indicators used by traders to identify potential market reversals. These patterns are a result of the Fibonacci sequence.
This guide will walk you through the essential harmonic patterns, providing valuable insights into how to identify, validate, and execute trades based on these formations.
What are Harmonic Patterns?
Harmonic patterns are a set of advanced technical analysis tools used in trading forex derivatives, stocks, futures, options, and commodities.
These patterns resemble a geometric price pattern series. This, in turn, allows traders to find reversal points.
Harmonic trading patterns are based on Fibonacci retracement and extension levels, which are ratios derived from the Fibonacci sequence.
As a trader, you can use harmonic patterns to gain insights into trades’ potential entry and exit points.
These patterns are named after various animals or shapes, such as the Butterfly, Bat, Crab, Gartley, and more.
Each pattern has specific criteria that need to be met for it to be valid. Let’s discuss the criteria in the next section.
How to Draw Harmonic Patterns?
Drawing harmonic patterns on a price chart requires a good understanding of the specific rules and guidelines for each pattern. Here are the general steps to draw harmonic patterns:
- Identify the Swing Points: Locate major swing highs and lows on the price chart. These will be used to draw the pattern.
- Determine the Pattern Type: Identify which harmonic pattern (e.g., Gartley, Butterfly) you are going to draw based on the swing points and Fibonacci ratios.
- Draw the Pattern: Use drawing tools on your charting software to plot the pattern’s legs and ratios. The pattern should resemble a specific geometric shape.
- Measure the Ratios: Use Fibonacci retracement and extension tools to measure the precise ratios between the pattern’s legs.
- Check Confluence: Look for additional confluence factors like support/resistance levels, trendlines, or moving averages that validate the potential reversal zone.
- Set Entry and Stop-loss Levels: Determine where you will enter the trade if the pattern completes, as well as where to place your stop-loss order to limit potential losses.
- Monitor Price Action: Wait for the price to reach the potential reversal zone and observe how it reacts. Look for reversal candlestick patterns or other signals to confirm the trade.
- Plan your Exit: Define your profit target or trailing stop strategy to manage the trade once it’s in your favor.
List of All Harmonic Patterns
Harmonic patterns are specific price formations that adhere to the Fibonacci ratios and have the potential to signal trend reversals in financial markets. Here’s a list of some common harmonic patterns:
1. Fibonacci Retracement Pattern
This pattern involves drawing lines on the chart using specific Fibonacci ratios (38.2%, 50%, and 61.8%) to identify potential support and resistance levels.
It serves as a basis for recognizing possible reversal zones in the market. Remember to combine it with other tools for more reliable trading decisions.
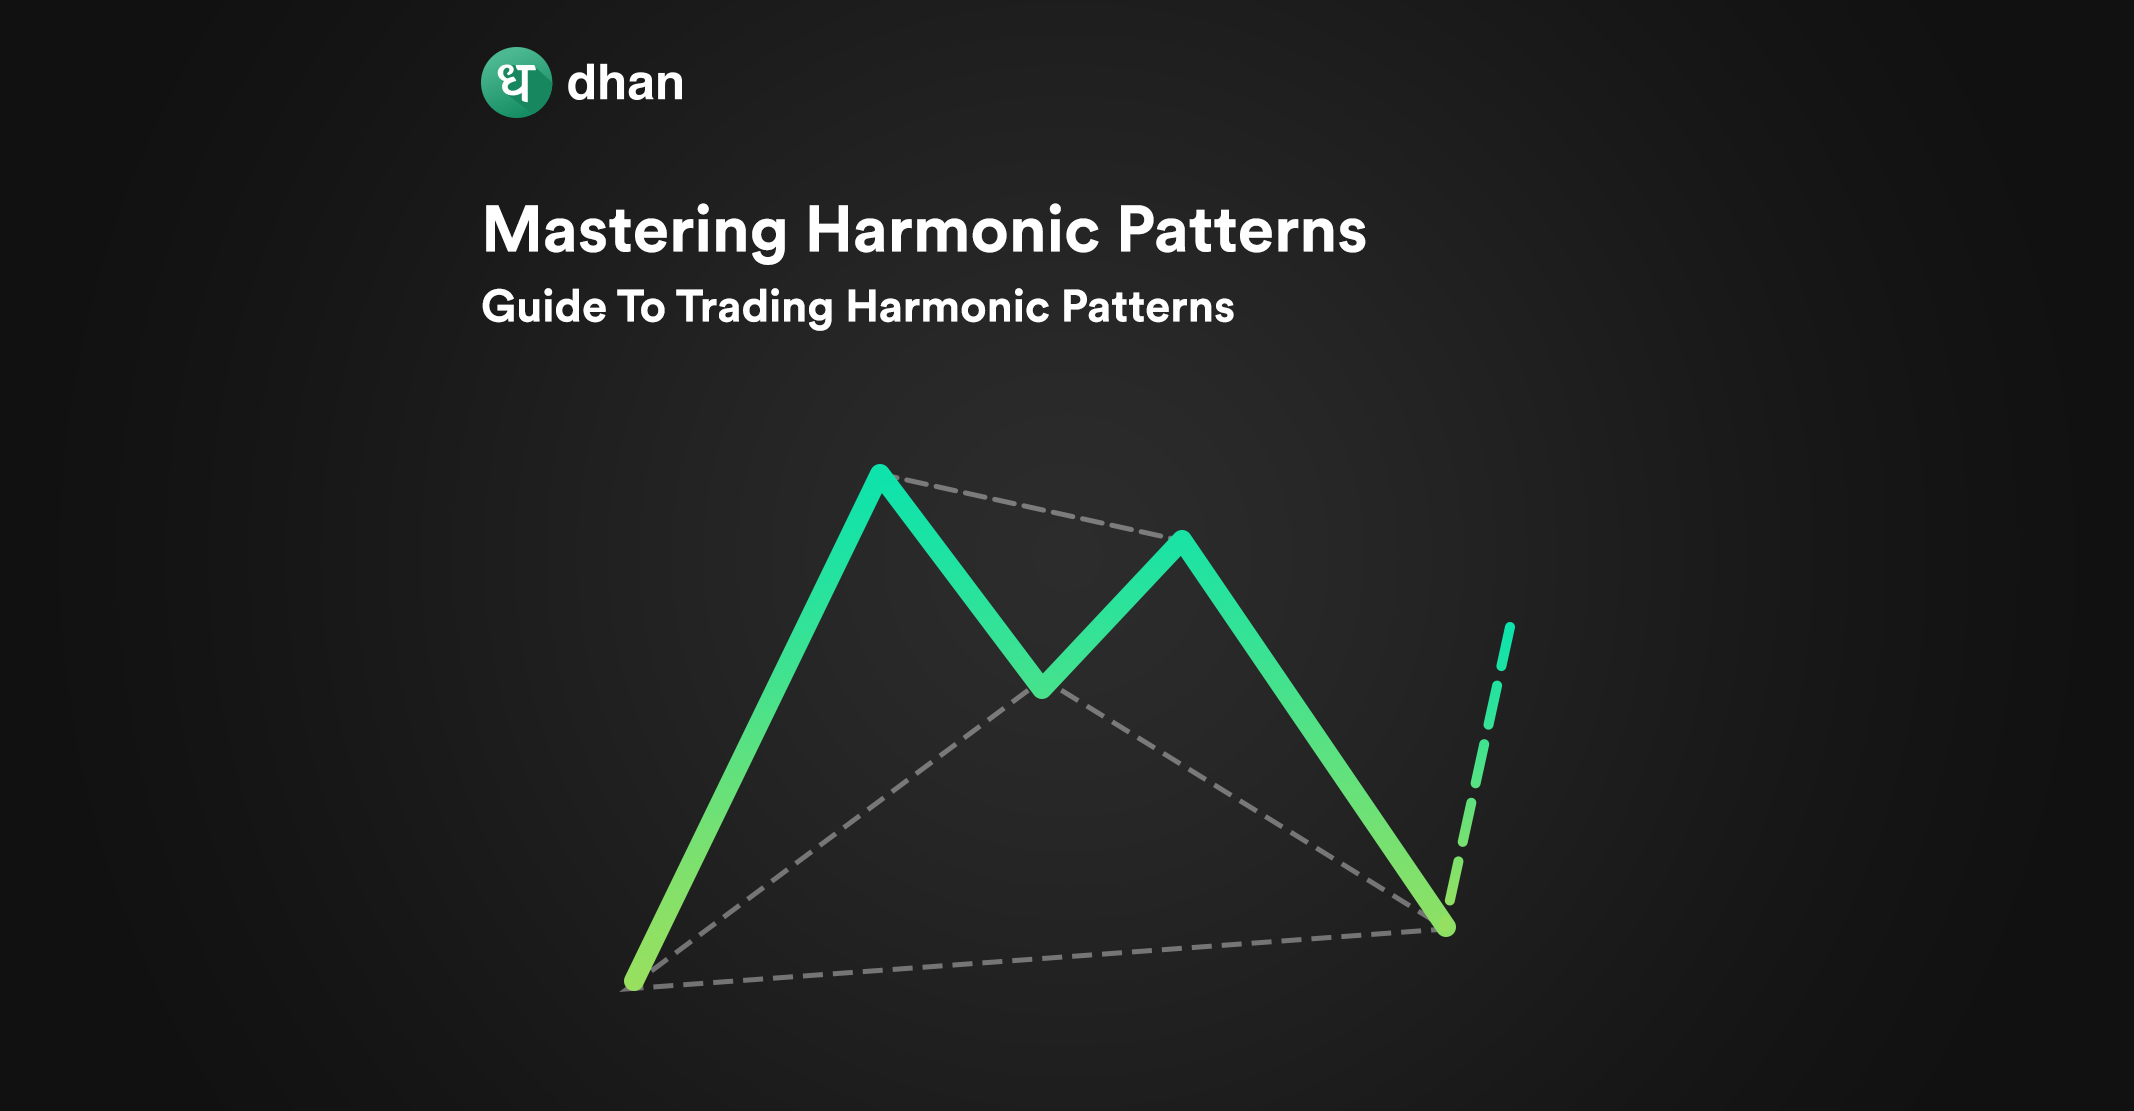
2. Gartley Pattern
The Gartley pattern, which looks like an “M” or “W” on the chart, is used for potential trend reversal signals. It involves four price swings and specific Fibonacci levels.
By identifying these levels, you can spot potential entry and exit points in the market.
Keep in mind that using other indicators alongside the Gartley pattern can help confirm your trading decisions for more accuracy.
3. Butterfly Pattern
In the Butterfly Pattern, you’ll identify four distinct price swings forming specific Fibonacci levels. It resembles the Gartley pattern but has different Fibonacci ratios.
This harmonic pattern suggests potential trend reversals, indicating buying or selling opportunities. Look for an “M” or “W” shape on the price chart to recognize this pattern.
4. Bat Pattern
In the Bat pattern, as a trader, you’ll identify four price swings on the chart. These swings form specific Fibonacci levels, defining potential reversal zones.
The pattern looks like an “M” (for bearish) or “W” (for bullish). When the pattern completes, it suggests an opportunity to enter a trade in the direction of the anticipated reversal.
5. Crab Pattern
This pattern is the most effective to use when trading. In the Crab pattern, you’ll spot 5 price swings on the chart.
It’s a complex harmonic pattern with unique Fibonacci ratios. The pattern indicates potential reversal zones and can help you identify entry points for trades.
The first and third price swings typically follow the common 38.2% and 61.8% Fibonacci retracement levels, while the second leg retraces beyond the starting point.
The fourth swing extends to the 161.8% Fibonacci extension level of the first three swings. The pattern completes with the fifth swing, ideally aligning with the 161.8% extension of the XA leg.
Difference Between Each Harmonic Pattern
| Pattern | Key Characteristics | Trading Strategy |
| Fibonacci Retracement | Uses Fibonacci levels (e.g., 38.2%, 50%, 61.8%) to identify support/resistance levels. | Traders look for price to bounce off these levels to enter trades. |
| Gartley Pattern | Consists of four distinct price swings, forming an “M” or “W” shape. | Entry at completion point “D” with stop-loss below “X” and targets set. |
| Butterfly Pattern | Similar to Gartley but more extended; often seen as “M” or “W” patterns. | Trade entry at point “D” with well-defined stop-loss and profit targets. |
| Bat Pattern | Typically has a shallower retracement in the XA leg, followed by BC and CD legs. | Traders enter at point “D” and manage risk with stop-loss orders. |
| Crab Pattern | Involves deep retracements in the XA leg, followed by BC and CD legs. | Entry at point “D,” often with more conservative risk management. |
Why Use Harmonic Patterns?
Harmonic patterns offer a structured approach to technical analysis, combining Fibonacci ratios with specific price formations.
These patterns can help you identify potential reversal points and entry/exit levels in financial markets.
Every harmonic pattern provides a visual framework for understanding market psychology and price movements, enhancing your trading decisions and allowing you to better navigate risks such as whipsaw in trading.
By incorporating harmonic patterns into your analysis, you can gain a valuable edge in spotting potential trading opportunities and improving the accuracy of your trades.
Conclusion
Harmonic trading patterns are built using the Fibonacci principle and, as a result, resemble each other in many ways.
That’s why you may notice several similarities between the various types of harmonic patterns.
In any case, mastering harmonic patterns can help you devise better trading strategies and narrow down appropriate entry and exit points.
Combining these patterns with a solid risk management system can help you trade with a well-rounded approach.
Live this? Then you’ll love these blogs: