Technical analysts have long employed price patterns to analyse the current and forecast future movements. Technical analysis of the stock market determines price support and resistance, range, and trends of the stock market using a variety of charts and statistical data. This strategy simply considers the price of the stock, not the company’s operations.
What Is Technical Analysis?
Technical analysis indicates the supply and demand that influences share prices by examining past price data. Institutions, mutual funds, and hedge funds are known to be influential players in the market.
Technical analysis uses various charts and indicators to visually track the activity of influential players to pinpoint price areas of strong interest for both buying and selling. Patterns of price show that history tends to repeat itself.
📌 Also Read: How to Trade Effectively by Trading Directly from Charts?
How to Use Technical Analysis on Charts?
Technical analysis is versatile and the best part is that there is something for everyone, meaning technical analysis can be as complex or as simple as you want it. The examples below illustrate 4 basic principles of chart analysis.
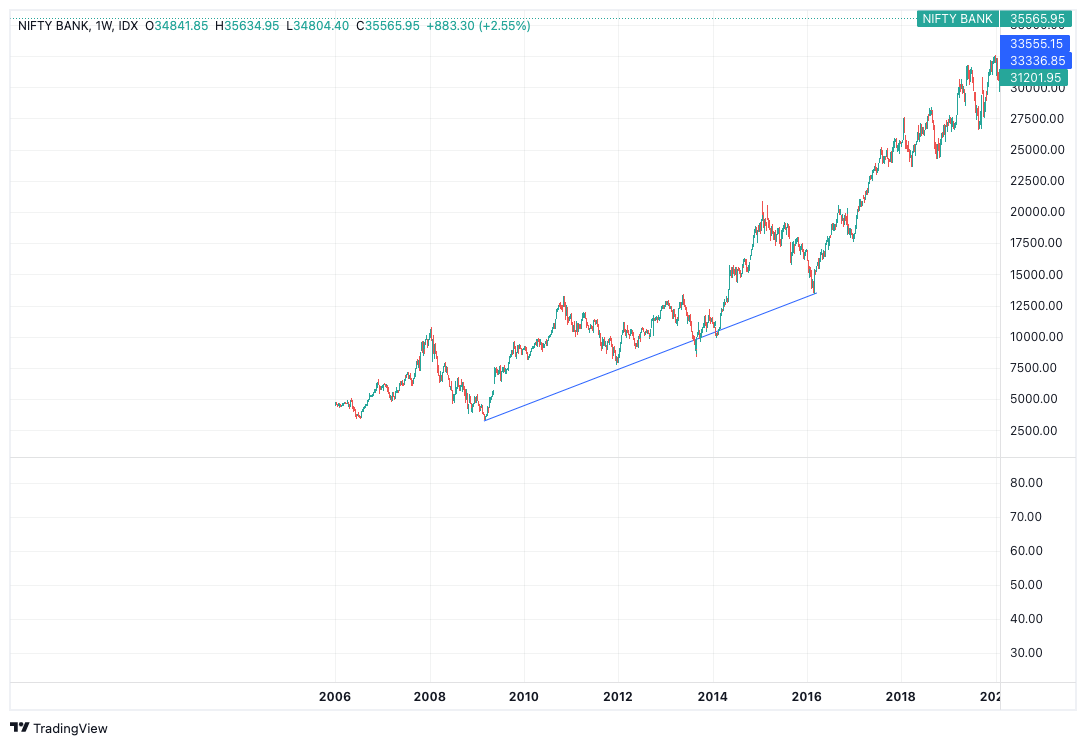
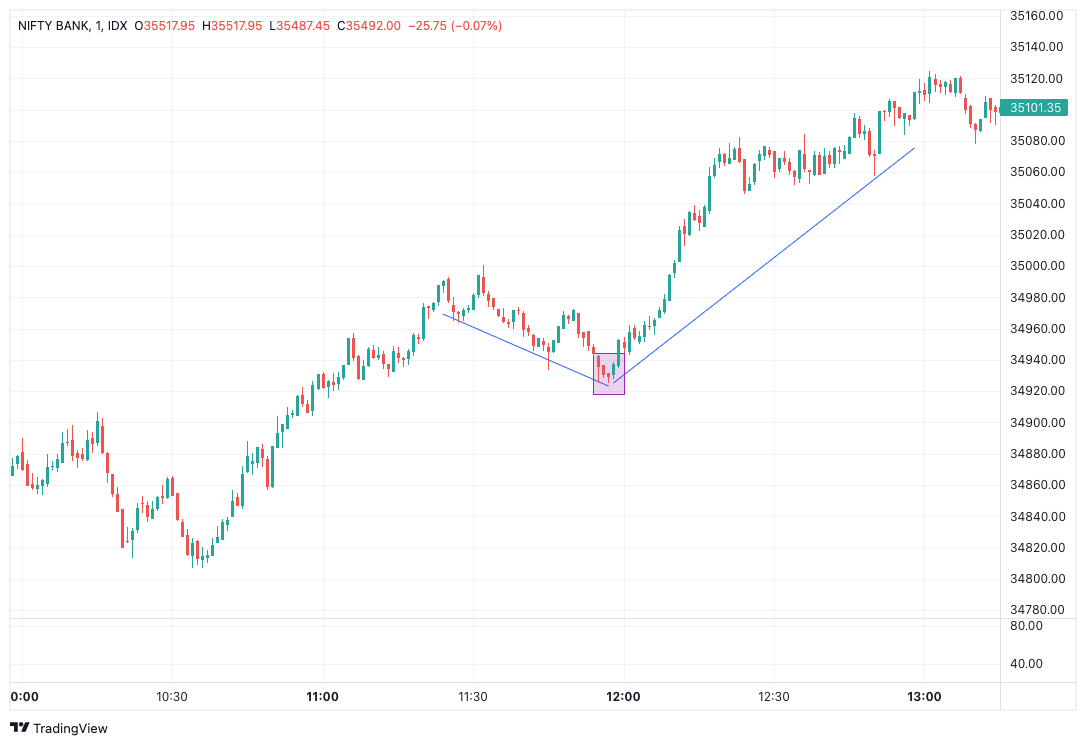
Trendlines 📈
As price or financial patterns are defined using a sequence of curves and/or lines, understanding and drawing trendlines is beneficial. The relevance of this is to help technical analysts identify areas on the price chart where there is resistance as well as the areas where there is support. Trendlines are drawn as straight lines linking a series of highs called falling peaks (highs) or a series of laws known as ascending troughs.
Continued Pattern 📈
A continuation or continued pattern is a price pattern that indicates a momentary break in an established trend. It’s impossible to predict whether a trend will continue or reverse while it’s forming.
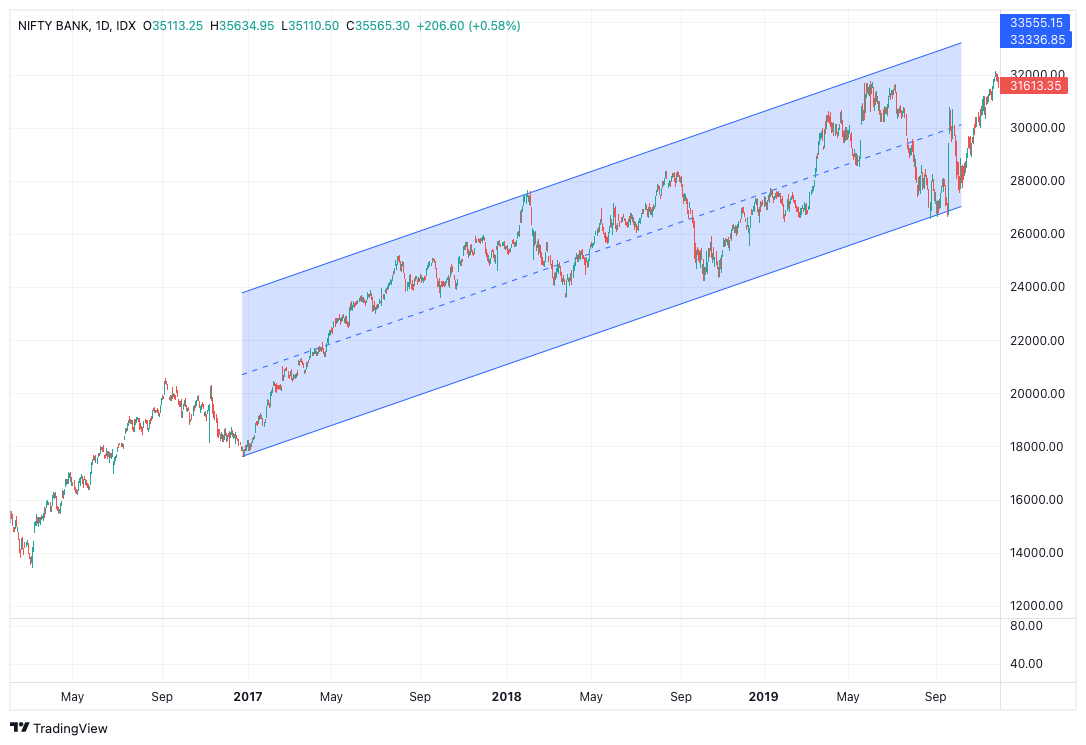
The following are examples of some popular continuation patterns:
- Two trend lines that are placed so that they are converging are used to create the pennants.
- Two trend lines that exist parallelly are used to draw flags. Wedges are made up of two converging trend lines that are both oriented up or down.
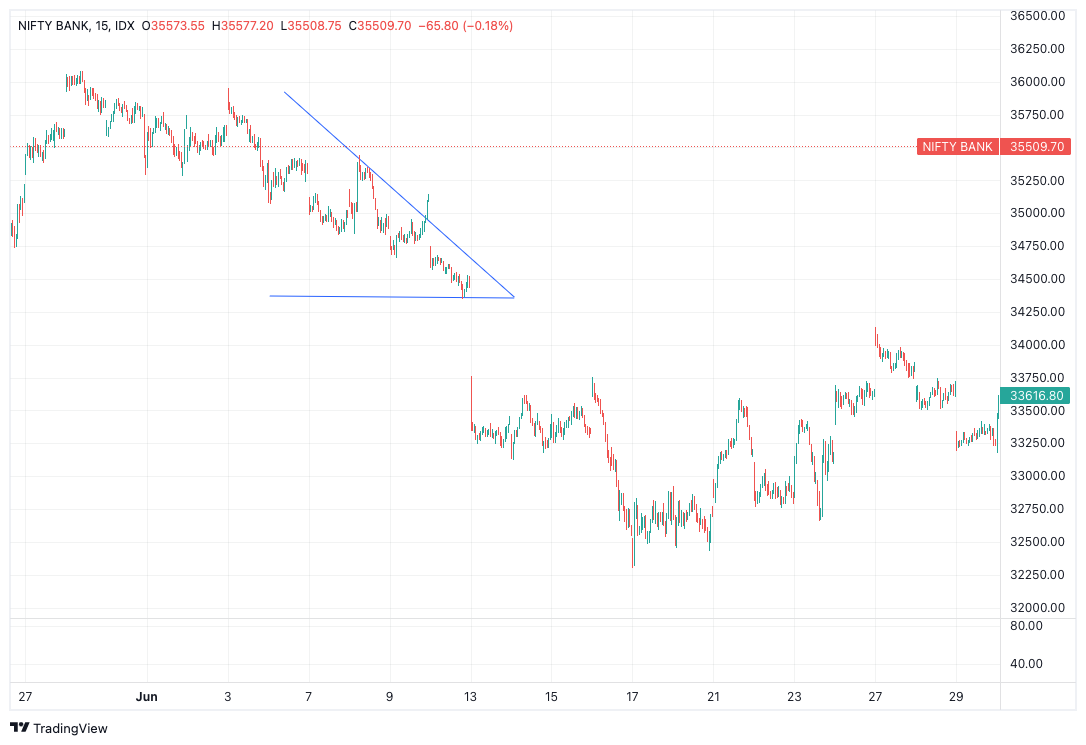
Triangle Pattern 📈
One of the most popularly utilised chart patterns is the triangle. Triangles are often used in chart bottles for technical analysis. This is because compared to any other patterns, triangles seem to come out most frequently. There are many different kinds of possible triangles. The most commonly seen ones are descending triangles, ascending triangles, and asymmetrical triangles. The duration for which the triangle chart patterns appear varies from a few weeks to even several months.
Reversal Pattern 📈
A reversal pattern is a type of pricing pattern that indicates a change in the existing trend. These patterns are read in two ways – either a bull has completely exhausted its options or a bear has completely exhausted its options. It indicates that a new element is coming up from the other side that is going to affect the current trend in such a way that the trend is going to shift and move in a different direction. For example, an upswing fueled by bullish exuberance may stop, indicating equal pressure from the bulls as well as pressure from the bears until the latter eventually take over. As a result, the market’s trend has shifted to the negative.
Conclusion
Technical analysis can be useful to anyone who trades in stocks, commodities, currencies, and other online trading avenues. In fact, technical analysis can help you make better judgments about how much risk to take in exchange for how much possible profit can be made.
Now that you know how to use technical analysis on charts, evaluate the following stocks and see how you fair.
- List of Nifty 50 Stocks
- List of Nifty Bank Stocks
- List of Fin Nifty Stocks
- Top 5 Banking Stocks
- Top 5 Pharma Stocks
- Top 5 EV Stocks
📌 You can also read:
- Difference Between Fundamental and Technical Analysis
- Swing Trading vs Long Term Investing: What’s Better?
Disclaimer: This blog is not to be construed as investment advice. Trading and investing in the securities market carries risk. Please do your own due diligence or consult a trained financial professional before investing.

Comments are closed.