The Supertrend indicator presents a straightforward way to analyze the price of a financial instrument. This article will explain what is Supertrend indicator is, its significance, formula, methods, and more. Bonus: we’ll also tell you how to access this indicator on TradingView Charts live for free.
What is a Supertrend Indicator?
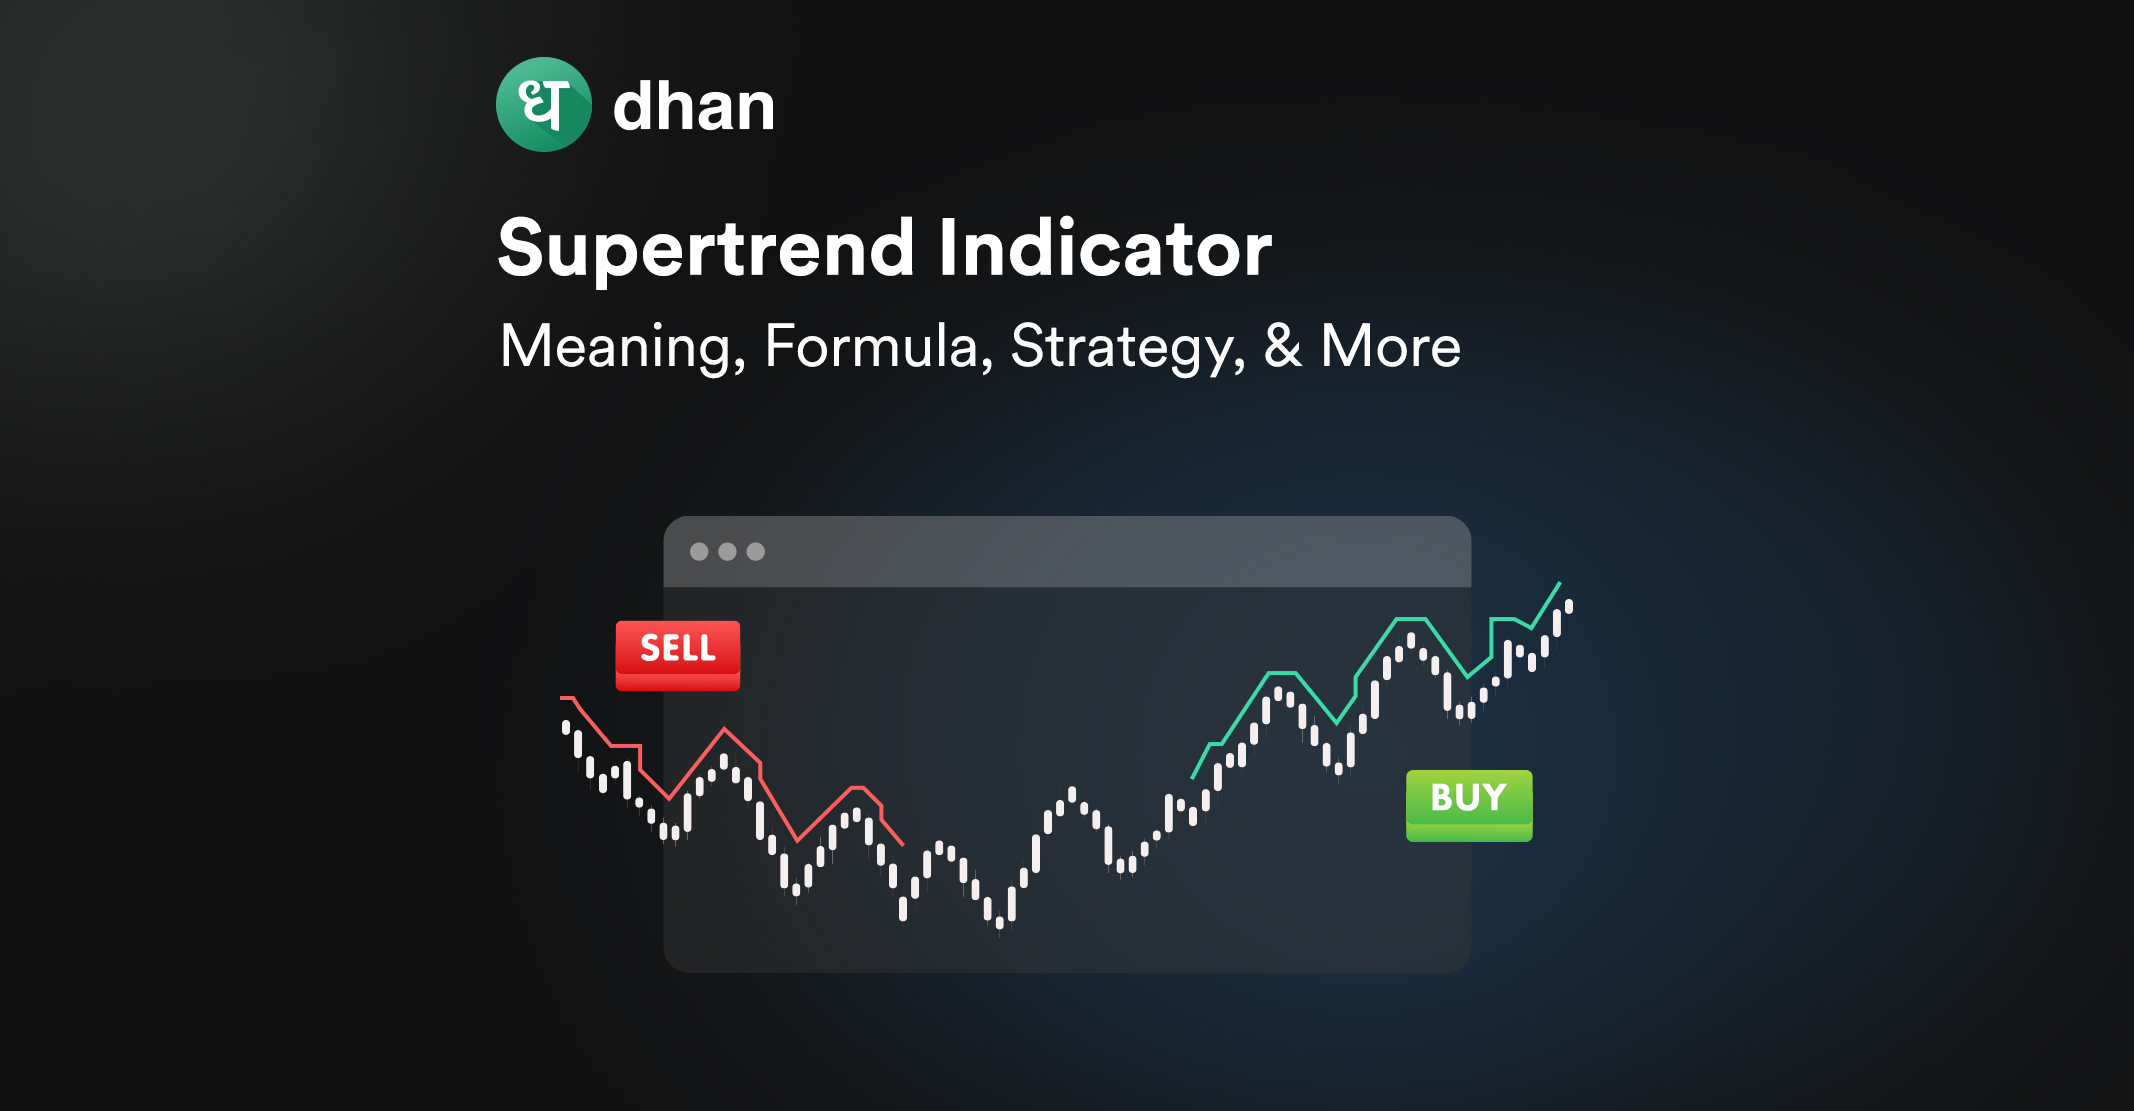
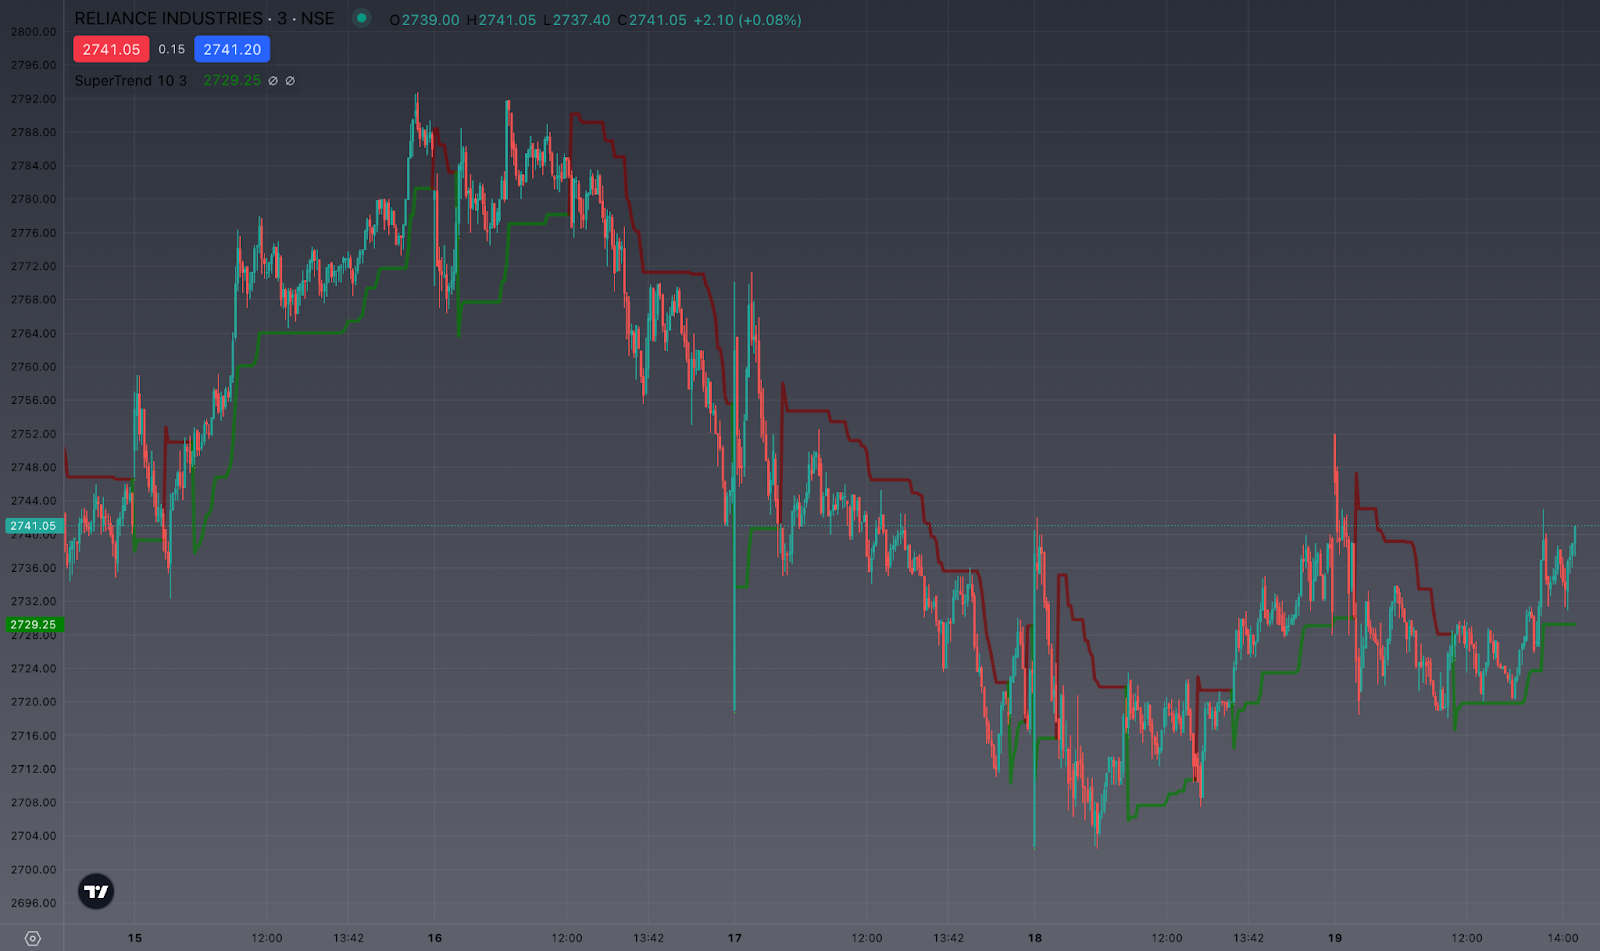
The Supertrend Indicator is a technical indicator used to identify the direction of price trends in financial markets. On a candlestick chart, the Supertrend indicator is seen as a line, above or below the price of the instrument.
When the technical indicator line is green, it suggests an uptrend, while a red line indicates a downtrend.
This straightforward visual representation helps traders make informed decisions about buying or selling assets based on the prevailing trend direction.
The following image will show you what Supertrend looks like on a Dhan TV chart:
Supertrend Indicator Formula
The Supertrend indicator can be easily calculated using high, low, Average True Range, and a multiplier.
Supertrend Indicator Formula:
- Down = [(High + Low / 2) – Multiplier] x ATR
- Up = [(High + Low / 2) + Multiplier] x ATR
The Supertrend line can be calculated for each period, and it changes based on the price action, ATR, and the chosen multiplier.
The multiplier is a parameter you choose that adjusts the sensitivity of the Supertrend. Common values include 1, 2, or 3. That said, the optimal choice depends on your strategy.
Moreover, you do not have to make any manual calculations – there are charting systems like TradingView Charts on Dhan that do it for you!
How to Interpret Supertrend Indicator Signals?
Interpreting Supertrend Indicator signals is essential for you to make informed decisions. Here’s how you can interpret it:
1. Uptrend Signal (Buy Signal)
The Supertrend Indicator’s green line signifies an uptrend. When the closing price moves above this line, it triggers a buy signal. This suggests an opportune moment to enter a long position or maintain an existing one.
The Supertrend’s color change to green indicates the market’s bullish sentiment, making it a favorable condition for buying assets or holding onto long positions.
2. Downtrend Signal (Sell Signal)
When the Supertrend line is red, it signals a downtrend. A sell signal occurs when the price closes below this red Supertrend line.
Traders interpret this as an opportune moment to enter a short (sell) position or exit existing long positions, anticipating further price declines in the ongoing bearish trend.
3. Counter-Trend Trading
It’s typically said that one should avoid trading against the prevailing Supertrend signal. In simpler terms, don’t buy when the Supertrend is clearly red (indicating a downtrend) or sell when it’s green (indicating an uptrend).
Trading against the signal increases the risk of losses, so it’s generally wiser to align your trades with the Supertrend’s direction for better odds of success. That said, there are many traders who use Supertrend as a contrarian indicator.
4. Reversal
You should stay in a trade as long as the Supertrend signal remains valid. This means holding a position in the direction of the trend until there is a signal indicating a trend reversal or a shift in the Supertrend color.
Exiting a trade prematurely can result in missed profit opportunities, so it’s crucial to follow the indicator’s guidance until conditions change.
5. Combine with Other Indicators
Combine the Supertrend Indicator with other technical indicators like Moving Averages, Bollinger Bands, and more to confirm trading signals.
By cross-referencing multiple indicators, traders gain more confidence in their decisions, reducing the risk of false signals.
This approach enhances the effectiveness of the Supertrend Indicator and helps traders make more informed and reliable trading choices.
Best Supertrend Indicator Settings
The Supertrend indicator’s best settings can vary depending on your trading style and the market you’re trading. However, a common starting point is:
- Period for Average True Range (ATR): 14
- Multiplier: 2.0
For many traders, these Supertrend indicator settings are a decent baseline, but your approach, time frame, and market volatility may require adjustments.
It’s essential to backtest different settings to find what works best for your trading approach.
Supertrend Trading Strategy
When using a Supertrend trading strategy, here are some steps you can follow to increase your trading decisions potentially:
1. Select the Right Time Frame
Begin by choosing a timeframe that aligns with your trading goals. Shorter time frames, like 15 minutes, are suitable for day trading, while longer time frames, such as daily or weekly, are better for swing trading or investing.
By the way, there’s someone on Dhan using an unconventional timeframe on charts. Read all about it here: Moved to the 63 minutes time frame
2. Determine the Supertrend Parameters
Set the parameters for the Supertrend Indicator. This includes specifying the period for calculating the Average True Range (ATR) and the multiplier. Common settings are a 14-period ATR and a multiplier of 2.
3. Entry Points
For a long (buy) position, consider entering when the price closes above the Supertrend line in an uptrend. Conversely, for a short (sell) position, look to enter when the price closes below the Supertrend line in a downtrend.
4. Setting Stop-Loss and Take-Profit Levels
Implement risk management by placing stop-loss orders below the Supertrend line for long positions and above it for short positions. Determine your take-profit levels based on your risk-reward ratio and market conditions.
5. Trailing Stops
To maximize profits, consider using trailing stops. Adjust your trailing stop-loss order as the price moves in your favor, locking in gains while allowing room for potential further price increases.
Risk Management Using Supertrend
Risk management using the Supertrend Indicator involves setting stop-loss orders based on Supertrend signals.
For long positions, place a stop-loss just below the Supertrend line, and for short positions, place it just above.
This strategy helps limit potential losses if the market reverses, ensuring that you exit trades before significant adverse movements occur.
Adjust your position size to align with your risk tolerance, and consider trailing stop-loss orders as the trend progresses to protect profits.
Using Supertrend for risk management helps you maintain discipline and protect your capital in volatile markets.
Pros & Cons of Supertrend Indicator
Here’s a table summarizing the pros and cons of the Supertrend Indicator:
| Pros | Cons |
| Simple to understand and use | Lagging indicator, not predictive |
| Provides clear trend signals | Whipsaw during sideways markets |
| Helps identify entry and exit points | May generate false signals |
| Adaptable to various timeframes | Requires fine-tuning of parameters |
| Effective in trending markets | Does not account for the fundamentals |
| Works well with other indicators | Not suitable for all market types |
| Aids in risk management | Potential for missed big trends |
Remember that the effectiveness of the Supertrend Indicator can vary depending on market conditions and individual trading strategies.
You should consider these pros and cons in your decision-making process and may choose to use them alongside other technical and fundamental analysis tools.
Conclusion
The Supertrend Indicator is a powerful tool that can elevate your trading game, offering valuable insights for decision-making. It helps you identify and use a market trend in your favor.
However, remember that success in trading requires a combination of knowledge, strategy, and discipline. Always do your own due diligence before using any indicator for trading.