Water is wet, the sky is blue, there’s money in the markets and volatility too. Fun rhymes aside, every financial securities market is prone to volatility.
Those who understand it can benefit from it. That’s why there are technical indicators built specifically for measuring volatility like the ATR indicator.
What is the ATR Indicator?
The ATR is a volatility indicator that stands for the Average True Range Indicator. A trader using ATR can understand the missing volatility between two sessions when there is essentially no trading.
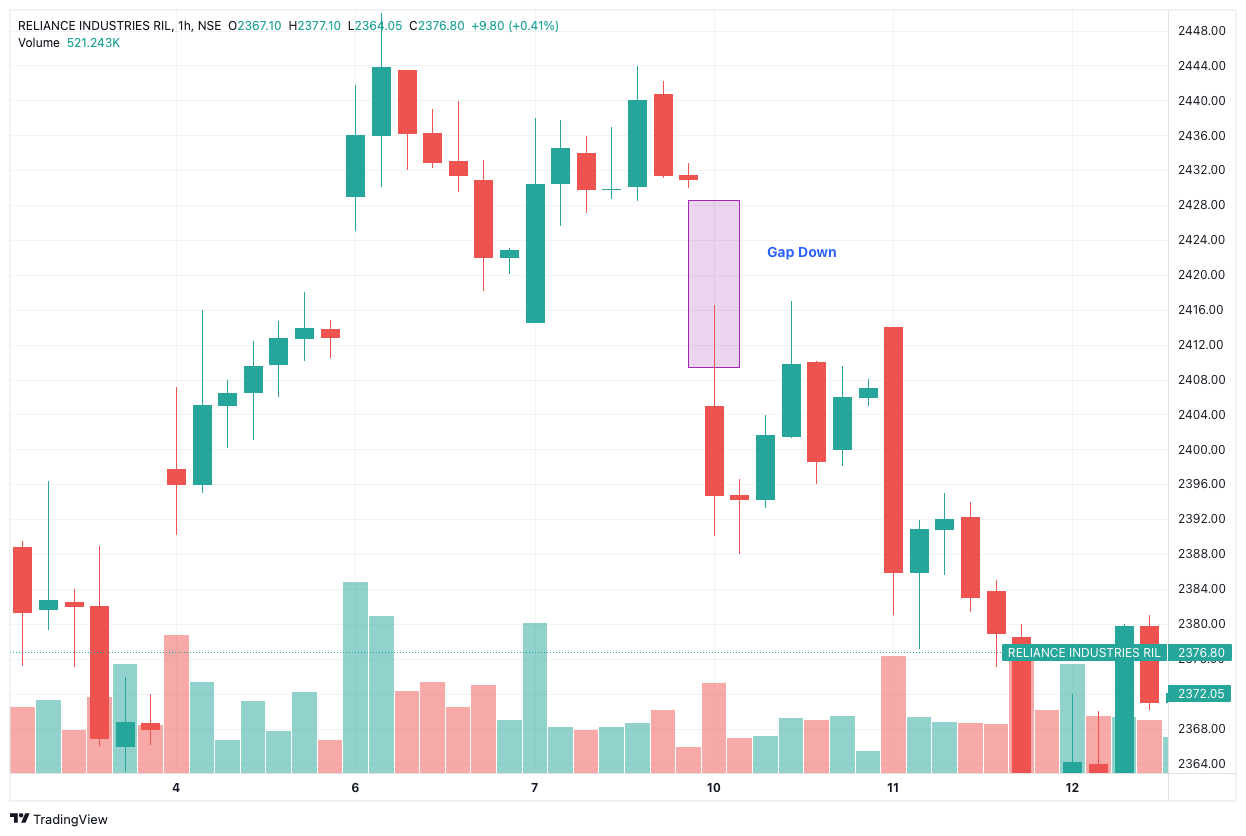
Missing volatility is known as a “Gap”. There are many types of gaps that you may notice while trading. The two most common ones are Gap Up and Gap Down.
A Gap Up occurs when a security opens at a higher price than the previous day’s close.
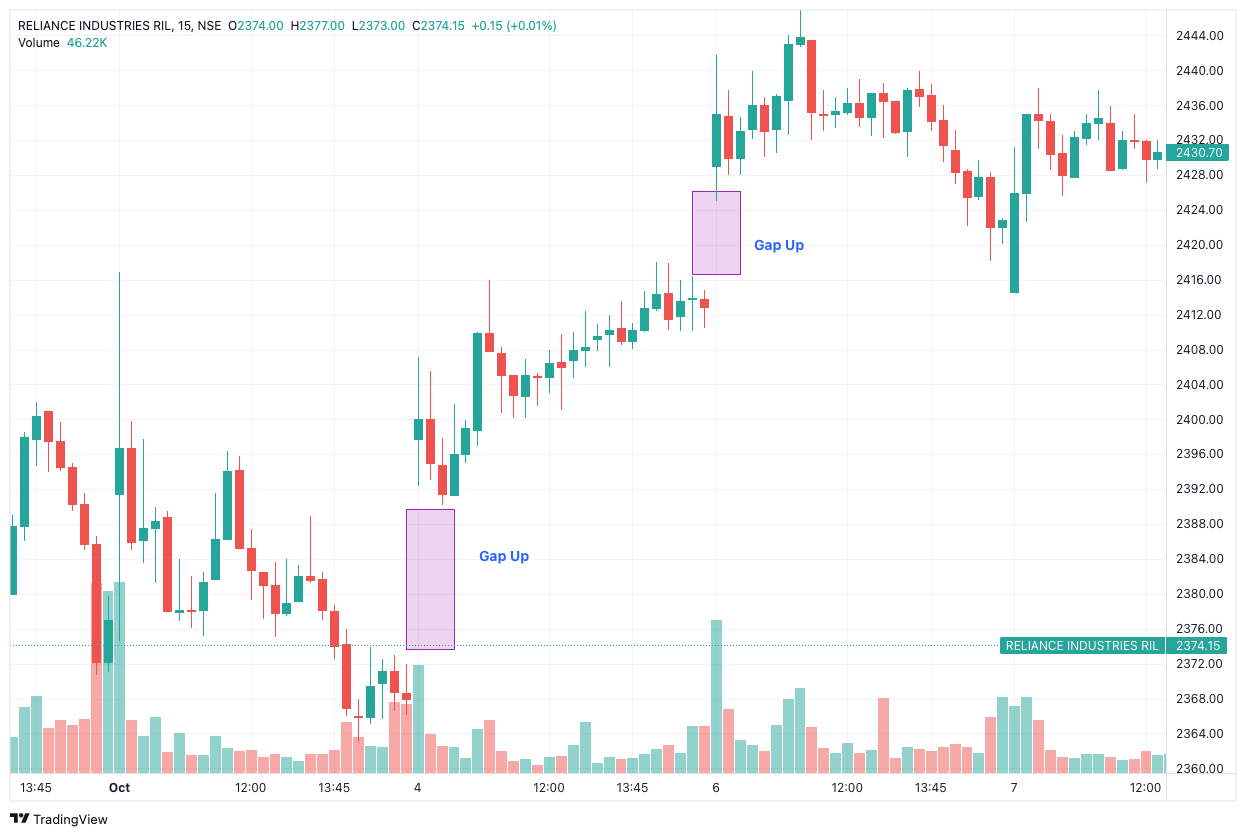
A Gap Down happens when a security opens lower than the previous day’s closing price.
That’s not all. Securities, especially commodities, are known to make “limit moves”. This scenario happens when the price of a security moves up or falls below the limit set by exchanges (for that day).
The ATR indicator will allow you to bridge gaps and limit moves to plan trades. The ATR achieves this through the calculation of True Ranges and their average.
What the ATR won’t tell you about is the price or trend direction. It’s just not what the indicator was built to do.
Furthermore, J. Welles Wilder developed the ATR for the commodities market but it can be used for stocks, futures, options, and currencies as well. See the ATR in action in the image below.

The red line in the lower half of the image shows the ATR value. You may have noticed “ATR 14” right next to the value, which indicates that the ATR indicator is calculated based on 14 periods.
Periods in this instance mean the timeframe that can be whatever you want them to be – 1 minute, 30 minutes, 1 day, and more. That said, 14 is the sweet spot for calculating ATR.
How to Calculate ATR Indicator Formula?
There are three components required for the ATR calculation. The first is the number of periods (n) which is generally 14.
You have the liberty to choose a timeframe based on what you’re analyzing, but remember that a longer timeframe can give you better trading signals.
Next is the True Range (TR) that can you can obtain with three methods:
- Current High – Current Low
- Current High – Previous Close
- Current Low – Previous Close
The highest of these TR values will be used for calculating the ATR. Let’s take a step back and acknowledge what the ATR indicator means.
It’s the average of true ranges over a period of time, which is important because the first ATR value is calculated as the average of the first set of TR values.
You can do the ATR calculation using the following formula for the 2nd ATR value onwards:
ATR Formula Calculation = {[First ATR x (n-1)] + Current TR} / n
This calculation will give you values that are classified as high or low, which are purely subjective. The reason for this is simple – ATR is used to measure volatility, not direction.
It’s a simple barometer that says high value = high volatility, low value = low volatility.
This is unlike the Average Directional Index Indicator which tells you trends are weak or strong if the values are lower or higher than 25.
But there is a silver lining. In fact, there are two. ATR can help you determine a stop loss and position size for every trade.
ATR Stop-Loss Explanation
The ATR stop-loss technique uses a 2x to 3x multiple of the ATR value to determine a suitable exit point for every trade. However, the conservative (generally accepted) range is 2x.
If you go long, you can set a stop loss to exit a trade once it goes 2x below your entry price.
If you go short, then you’ll have to set a stop loss 2x above your entry price.
Let’s take a look at both scenarios. Assume that a share’s Last Traded Price (LTP) is Rs. 80,000 and the ATR is 170. A 2x multiple of the ATR is 340. This means…
- ATR Stop Loss When Going Long: Rs. 79,660
- ATR Stop Loss When Going Short: Rs. 80,340
While we’re on the topic, let’s also talk about position sizing. You can use ATR in two ways to determine position size.
1. (Risk % X Total Capital) / 2ATR
2. (Risk % X Total Capital) / (2ATR x LTP)
P.S: You can use stop loss as well as trailing stop loss on Dhan.
Conclusion
The ATR Indicator does a good job of determining volatility. It can also help you set a trailing stop loss and figure out the position size for every trade.
At the same time, it is a lagging indicator that can’t determine the direction of prices or trends.
Either way, the ATR indicator is used by many to analyze stocks, commodities, currencies, futures, and options. You can use it too on Dhan for free along with hundreds of other technical indicators!
Like this? Then you’ll love these blogs on technical indicators: