Volatility is pretty much a part and parcel of any securities market, be it stocks, commodities, derivatives, or currencies. That’s why it is useful to listen to and understand the market as opposed to telling it what to do.
One way to understand this volatility is with the Bollinger Bands indicator. The bands can also tell you whether a security is overbought or oversold.
While the BB indicator is super popular, there’s a component to it that can be useful to identify breakouts.
That’s known as a Squeeze or colloquially, the “Bollinger Bands Squeeze”. In this story, we’re going to walk you through the basics of the Squeeze and how it works. But first, let’s rewind a bit.
A Recap of the Bollinger Bands Indicator
Imagine a line that’s plotted based on the Simple Moving Average (SMA) of a security’s price, typically over 20 periods. The periods themselves can be anything from minutes to years while the SMA line will look like a… line.
Let’s say you add a band at the top and bottom of this line, each of which has a width of two standard deviations. This combination of an SMA line and bands is known as the Bollinger Bands indicator. It looks like this on a chart.

The goal of using the Bollinger Bands indicator is to understand the passage of volatility across a period of time.
The creator of the BB indicator, John Bollinger, developed the indicator with a singular purpose – asking the market what’s happening by combining bands with standard deviation.
As a result, the indicator was born, and with it, the ability to identify whether an asset is overbought or oversold. Identifying the outcomes is possible with these visual cues:
- Bands far apart: high volatility
- Price below band: possible advance
- Price above band: possible decline
- Bands narrow: low volatility
The BB Squeeze comes into play in the final scenario when the bands are narrow/tight.
What is a Bollinger Bands Squeeze?
There may be a situation where the Bollinger Bands may be quite narrow, which means they are very close to each other and the SMA line. This is known as the Bollinger Bands Squeeze.
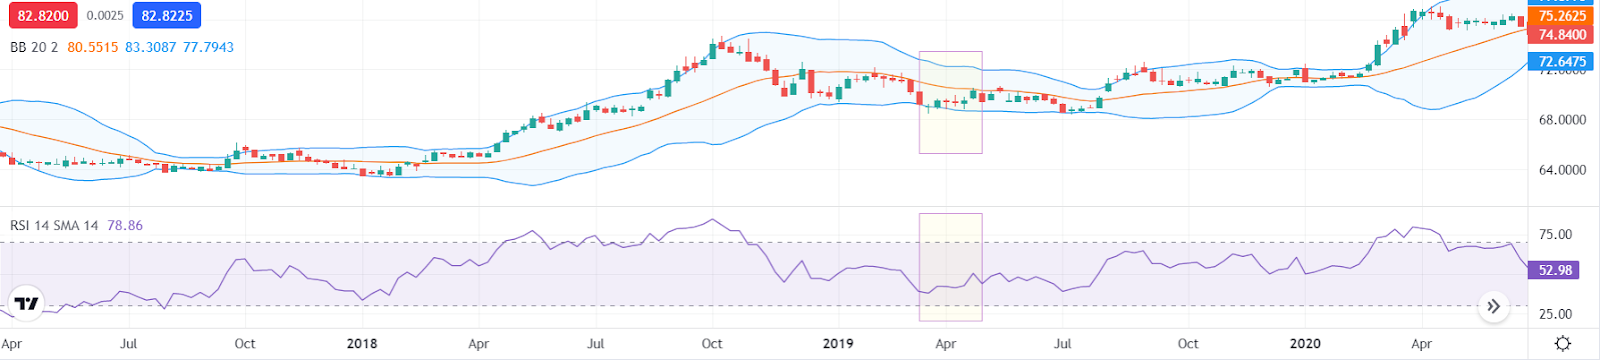
The onset of a Squeeze is often followed by high volatility. Take a look at the image below to understand this visually. The purple box is the period of historically low volatility followed by a period of expanding volatility in the yellow box.
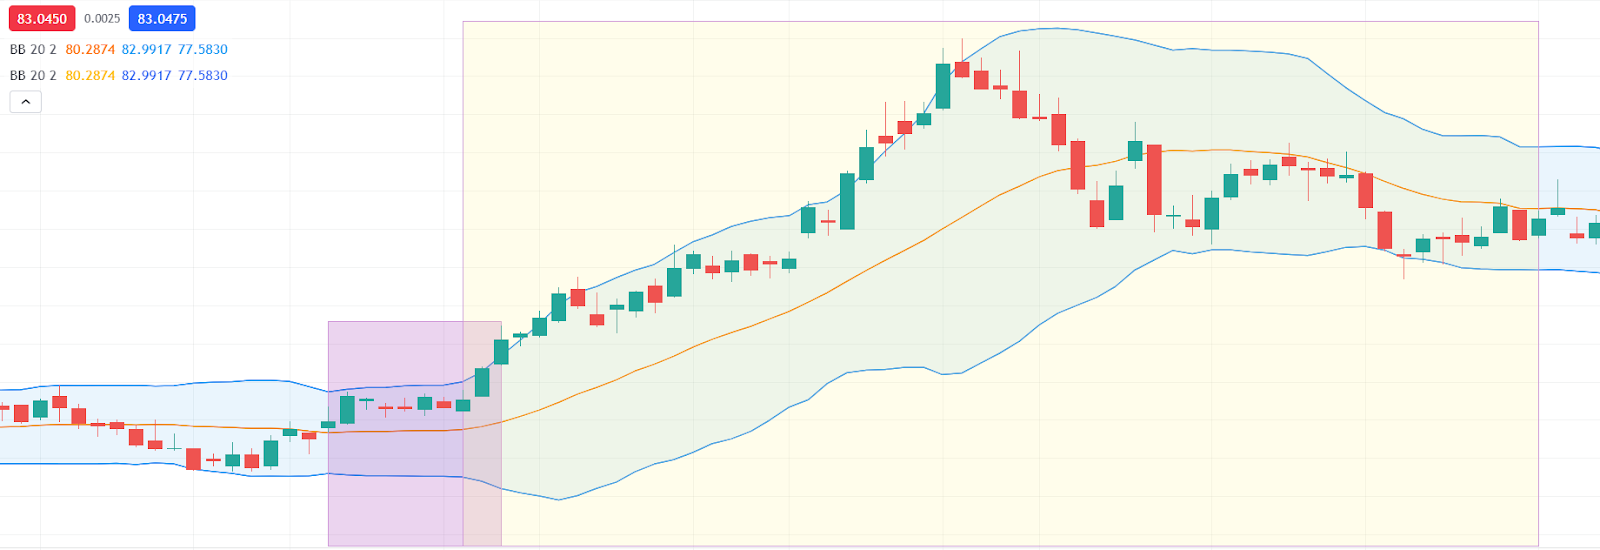
The significance of the Bollinger Bands Squeeze is that it is a trading signal. You can use it to plan your next move. One potential way to do this is to observe how the bands behave during a burst of volatility.
When there’s a breakout of the bearish kind, the upper band may move upward. Similarly, the lower band will move downward during a breakout of the bullish kind. But these are probable, not possible outcomes.
In order to make optimal use of a Squeeze, you’ll have to use Bollinger Bands with another indicator. This will help you combine your understanding of volatility with the trend direction.
By the way, there’s something known as a “Head Fake” which happens when the price of a security moves in one direction, only to reverse towards another direction moments later. This can happen during a Bollinger Bands Squeeze as well.
That’s why it’s important to be extremely careful and not enter trades, especially without a stop-loss. After all, knowing that there’s volatility but not knowing what to do with it can be a dilemma. Adding another technical indicator solves this.
Bollinger Bands Squeeze Strategy with RSI
Combining the Bollinger Bands indicator during a Squeeze with another technical indicator can help you identify the right entry and exit points. Before we move on to the indicator combination, here’s an interesting inference that’s commonly accepted.
A Bollinger Squeeze is known to be followed by a breakout above or below the band. A breakout above the upper band implies that the price is about to decline while a breakout below the lower band means that the price is about to rise.
Adding the Relative Strength Index (RSI) can help solidify an inference into a possible Bollinger Band Squeeze strategy. It’s a momentum oscillator that’s designed to identify the speed and trend of a security’s price.
The RSI does so with the help of high and low bands that are pegged to two extreme values (high and low). The trend will “oscillate” in this envelope of bands. This is what a chart looks like with the RSI indicator switched on!

The RSI indicator is the brainchild of J. Welles Wilder, who also developed the Average Directional Index and Average True Range indicators.
Using the RSI, you can get insights into “divergences” and “failure swings”:
- Divergence: The movement of price away from the indicator
- Failure swings: The price failing to hit a new high during a bullish trend or a new low in a bearish trend
Furthermore, you’ll get a value between 0 to 100 when using the RSI. Anything above 70 indicates that the security is overbought while anything below 30 indicates that the security is oversold. While a range of 40 to 50 acts as support.
In the image below, an RSI value above 70 is marked in the purple circle while an RSI value below 30 is marked in the blue circle.

Moving on, combining the Bollinger Bands indicator with the RSI during a Squeeze can help you consolidate or dismiss trends. Consider a scenario where the price has gone above the upper band of BB. Technically, this means that the security is overbought.
To be sure, you can run an RSI on it. If the RSI value is above 70, it indicates that the security is likely overbought, meaning a savvy trader would short the security or sell their existing holding.
On the flip side, if the price goes below the lower band of the BB indicator but the RSI value is still above 30, then the security may not be oversold. This means a savvy trader will hold on to any “buy” decisions. Here’s the Bollinger Bands Squeeze

Example #1: Price breaks out above upper Bollinger Band after Squeeze. RSI is also above 70.
Example 2: Price breaks below the lower Bollinger Band but RSI is still above 30.
Beware of the Bollinger Bands Headfake
The “headfake” is a false trading signal that’s generated by Bollinger Bands Squeeze and its parent indicator. When there’s a breakout above or below any Bollinger Band, there’s potential for incoming bullish and bearish trends.
This is true in principle but the price may move in the other direction in reality. That’s why you should be prepared to deal with headfakes if you’re relying solely on the Bollinger Bands Squeeze.
One way to overcome a headfake is to use Bollinger Bands with RSI, as shown in the example above. You could use other indicators as well such as the MACD. Either way, every technical indicator has its pros and cons.
Conclusion
Bollinger Band Squeeze Indicator is used to forecast a change in incoming volatility after a period of historically low volatility.
More specifically, when the volatility reaches a 6-month and the Bollinger Bands are also at a 6-month minimum distance apart, a Squeeze is triggered.
With it, you can infer that there’s incoming volatility and possible (not probable) outcomes.
To be more sure, you’ll have to combine the Bollinger Bands indicator with another technical analysis indicator RSI, which can consolidate your observations and help you develop a more comprehensive Bollinger Band Squeeze strategy.
More awesome blogs: