While traditional candlestick charts have been a popular method for charting price movements, Kagi charts offer a unique alternative for uncovering trends. Kagi charts are a versatile tool to represent price movements for shares and stocks.
Unlike traditional charts that rely on time intervals, Kagi charts change direction only when the price movement reaches a certain threshold, resulting in a cleaner and more straightforward representation of price movements. If you’re wondering what is a Kagi chart, read on!
What is a Kagi Chart?
Kagi charts are a type of chart used for technical analysis of stocks, futures, options, commodities, and currencies. Developed in Japan in the late 1870s, these charts were originally used to track the price of rice. Rice, as you may know, was a major source of trade in Japan during the 19th century.
The word Kagi means “key” in Japanese and in many ways, the chart itself is viewed as the key to detecting changes in market sentiment. Once gauged, the market sentiment can influence buy and sell decisions, which is the primary use case of technical analysis on charts.
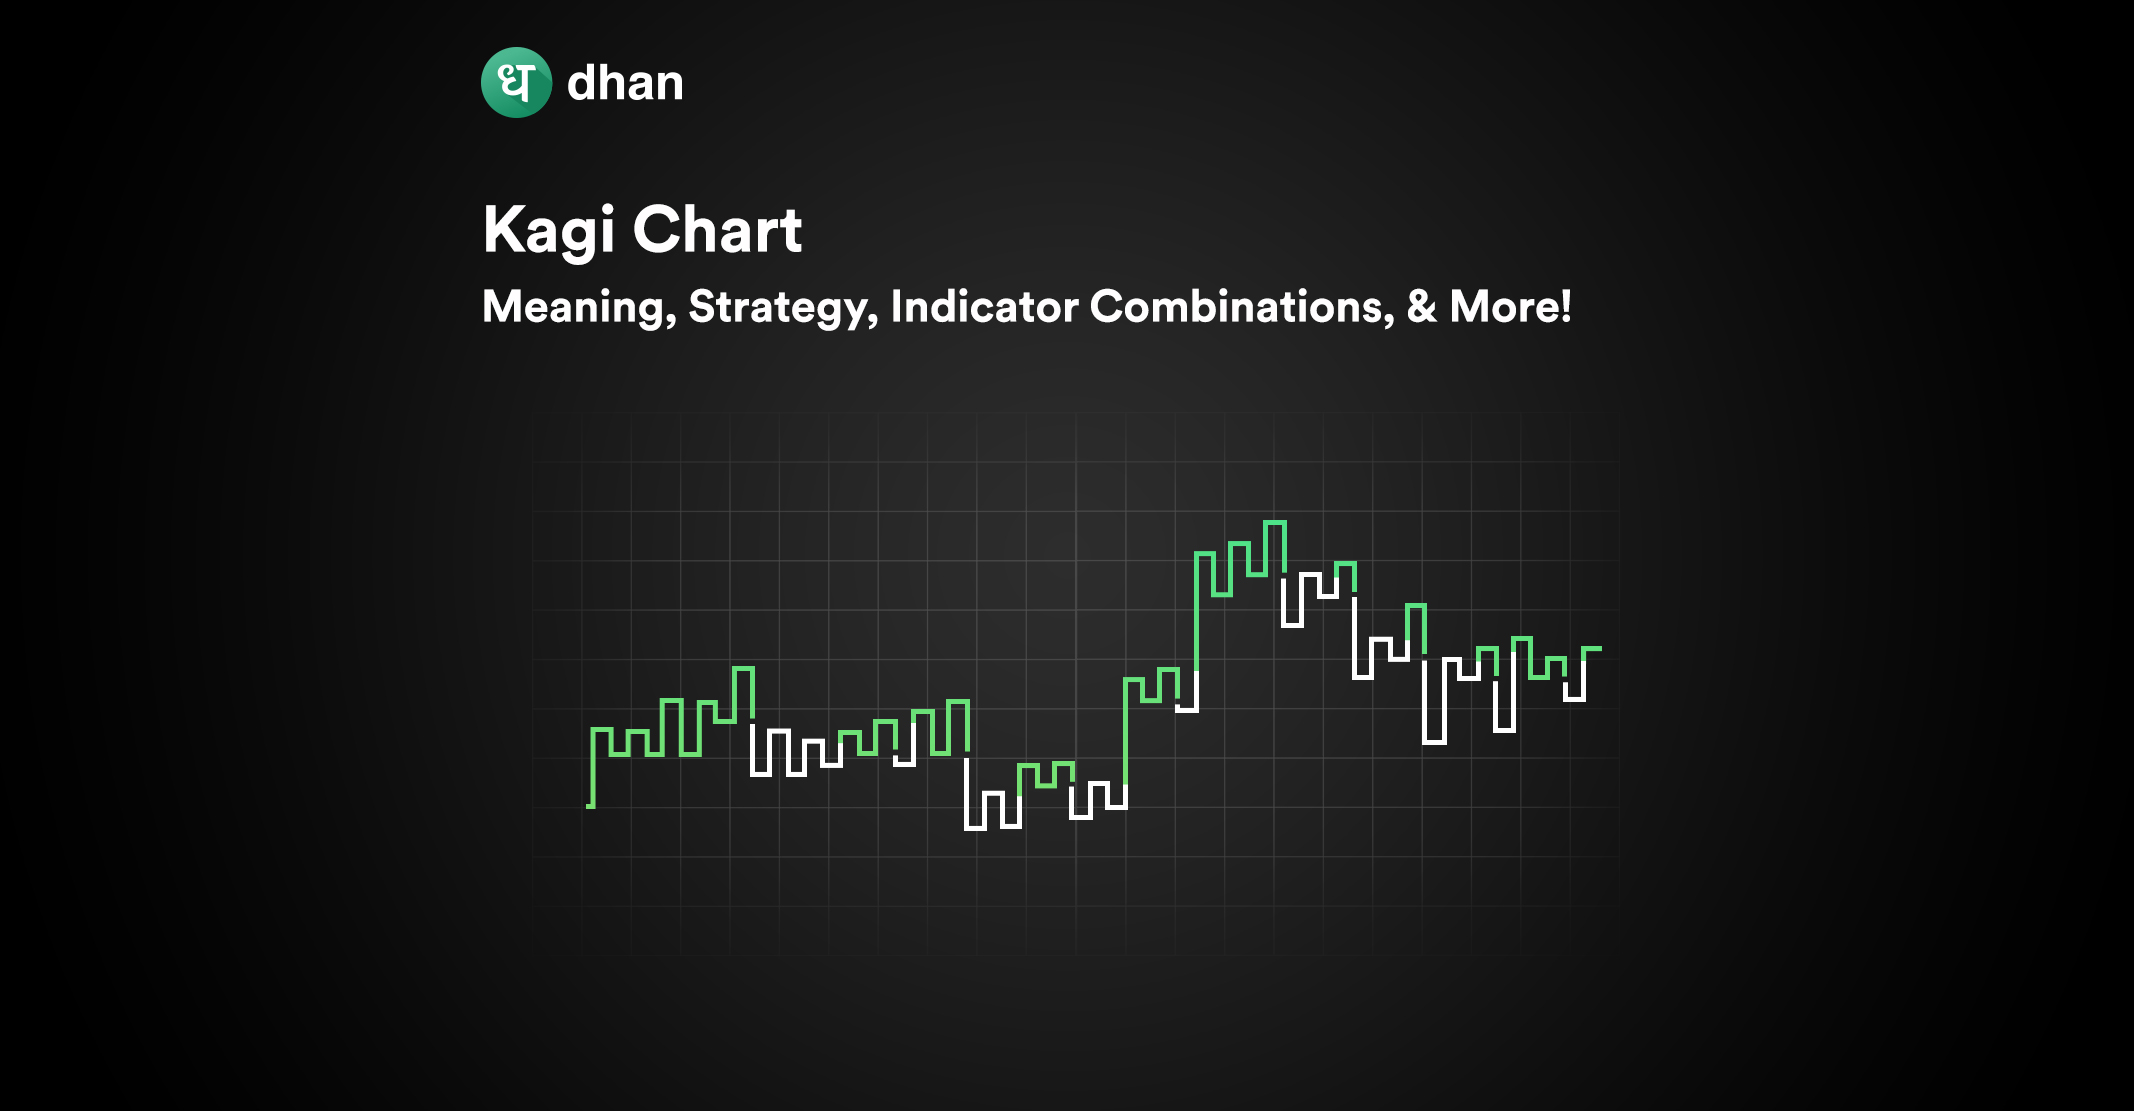
Steve Nison popularized the Kagi chart in the Western world. It is now a commonly used tool for traders who appreciate its benefits in comprehension and evaluating stock price movements. The following image will show you what a Kagi chart looks like.
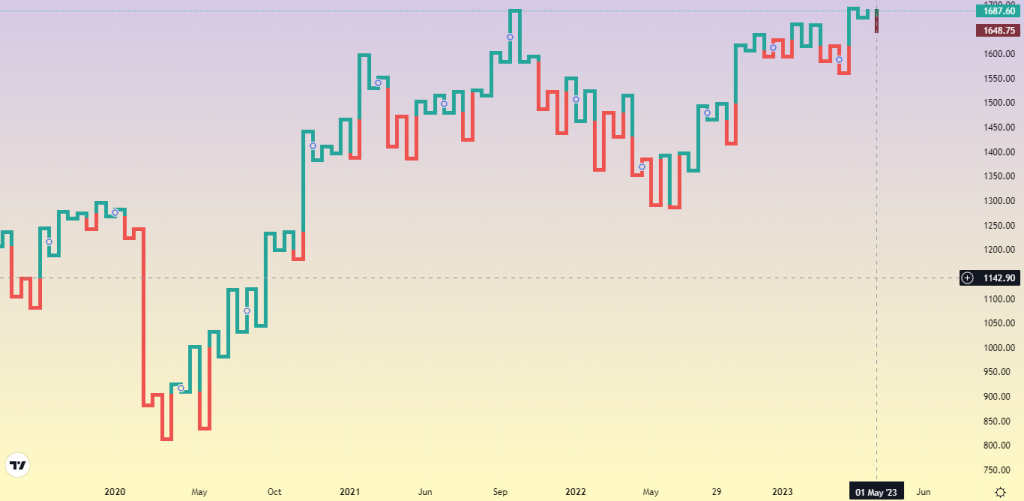
Kagi charts are used to identify buy and sell signals based on the changing thickness of a vertical line. If the line turns thick (upward), it is a buy signal; if it turns thin (downward), it is a sell signal. This is triggered when a new high or low is made. More on that later.
How to Read a Kagi Chart?
The lines on a Kagi chart increase or decrease as the price moves by the reversal amount. You have the option to set a reversal amount that can either be the Average True Range (ATR) or an absolute price change.
Once the price hits or crosses the reversal amount, the chart will move downwards (in red). In fact, a line on the Kagi chart will only change once there is a significant price reversal based on volatility (ATR) or price (traditional).
When the reversal amount is reached, the line will form a shoulder, then a waist, and then track downwards. Check the following image to understand what a green and red Kagi line looks like.

The direction of the line and its thickness are the most important details to note. Traditionally, traders buy when the lines change from thin to thick.
You must be wondering why a trader might opt for a Kagi chart. Truth is, Kagi charts reduce noise and isolate the trend, allowing you to view direction more clearly. Thus, Kagi charts are simple and show trends, patterns, and outcomes.
5 Kagi Chart Trading Strategies
You as a trader can use several trading strategies with Kagi charts, depending on your individual preferences and risk tolerance. Here are a few examples.
1. Trend Following Strategy
This strategy involves looking for trends and entering trades in the direction of the trend. Traders can use Kagi charts to identify whether the market is in an uptrend or downtrend and then use other technical indicators to confirm the trend and determine entry and exit points.
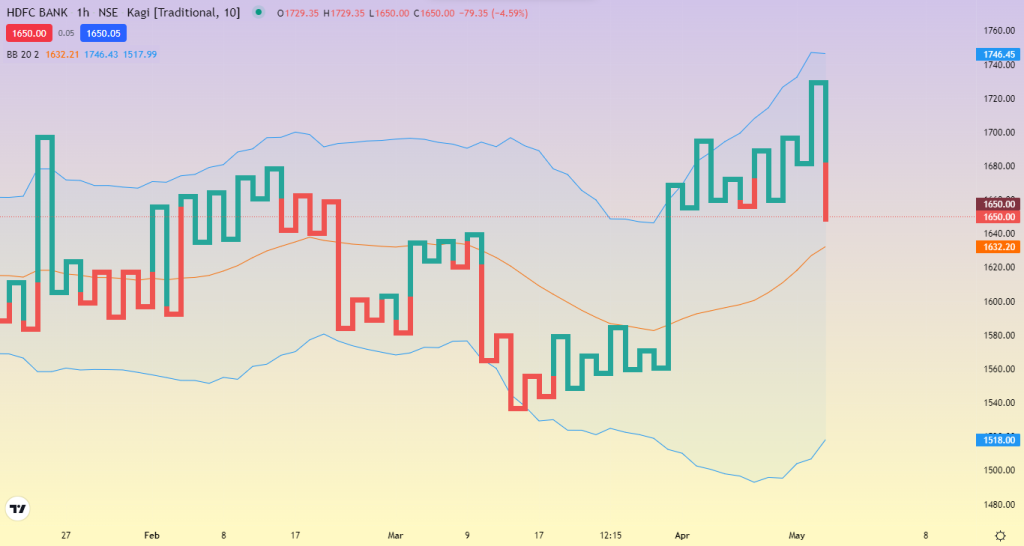
While the Kagi chart itself may not be enough to confirm trends, using a technical indicator with it could prove useful. For example, combining the Bollinger Bands with Kagi charts.
2. Breakout Strategy
This Kagi chart trading strategy involves looking for price breakouts and entering trades when the price breaks above or below a key level of support or resistance. You can use Kagi charts to identify potential breakouts by looking for changes in the direction and thickness of the lines. You could also combine it with the Relative Strength Index (RSI) indicator.
3. Support and Resistance Strategy
This Kagi chart trading strategy involves identifying key support and resistance levels and entering trades when the price bounces off these levels. You can use Kagi charts to identify these levels by looking for areas where the lines change direction. Adding Fibonacci Retracement to the mix is also an option.
4. Reversal Strategy
It involves looking for trend reversals and entering trades when the trend changes direction. Traders can use Kagi charts to identify potential reversals by looking for changes in the direction and thickness of the lines.
5. Combination Strategy
Kagi charts and other technical indicators can be combined to confirm trends and identify trading opportunities. We’ve already spoken about a few examples in the paragraphs above. Traders can use moving averages, MACD, and RSI indicators to confirm trends and determine entry and exit points based on Kagi chart signals.
Benefits of Using a Kagi Chart
Kagi charts offer several benefits over other types of charts.
1. Reduces Noise
For starters, Kagi charts reduce noise by not paying attention to unimportant price moves. This makes Kagi charts simple and easy to understand, as no noise interferes with seeing the overall trend. Think of it as looking at the sea and ascertaining if the tide is going in or out.
2. Clarity
Kagi chart patterns provide a clear and simple view of price movements, making it easy to identify trends and patterns.
3. Objective
They are based solely on price movements, making them less subjective than other types of charts that may incorporate other factors.
4. Dynamic
It adjusts to changing market conditions, allowing traders to adapt to market volatility and make informed decisions. Kagi charts also make it easier to identify support and resistance levels, and they can be used to create automated trading systems via stock trading APIs.
5. Time Efficiency
It requires less time to analyze than other types of charts, making it a popular choice for traders who value efficiency.
Conclusion
Kagi charts can be a valuable tool for you as a trader if you want to analyze the markets, identify trends, and make informed trading decisions.
With its unique vertical line representation and simple signal system, Kagi charts offer several benefits over other chart types, such as reduced noise and improved trend identification.
Furthermore, traders can develop effective trading strategies by combining Kagi charts with other technical indicators. But Kagi charts will be only as good as your settings. If the ATR/Traditional settings are improper, the charts may fail.
What you also need to remember is your risk tolerance and use the right kind of trading platform like Dhan to start trading online.