If you’re a trader, you’ve likely come across a variety of technical indicators, chart patterns, and candlestick formations when you trade stocks online.
One such tool is the Heikin Ashi candlestick. But what exactly are Heikin Ashi candles, and how can they be used to develop effective trading strategies?
In this article, we’ll help you understand the meaning of Heikin Ashi candles, examine their strengths and weaknesses as a trading tool, and look at some common technical indicator combinations that can be used for better insights into the market.
What is Heikin Ashi Candle?
Heikin Ashi, a term derived from Japanese, translates to “average bar.” This innovative technique was developed to offer a clearer view of price movements, making it easier for traders to analyze market trends.
With roots in the 17th-century Japanese rice market, Heikin Ashi candles have evolved to become a valuable asset in modern-day swing trading, trend trading, or intraday trading.
While traditional candlesticks use actual prices to plot their components, Heikin Ashi candles employ a unique averaging approach, resulting in a smoother visualization of price action. Check out the following image to know what Heikin Ashi candles look like on a chart.
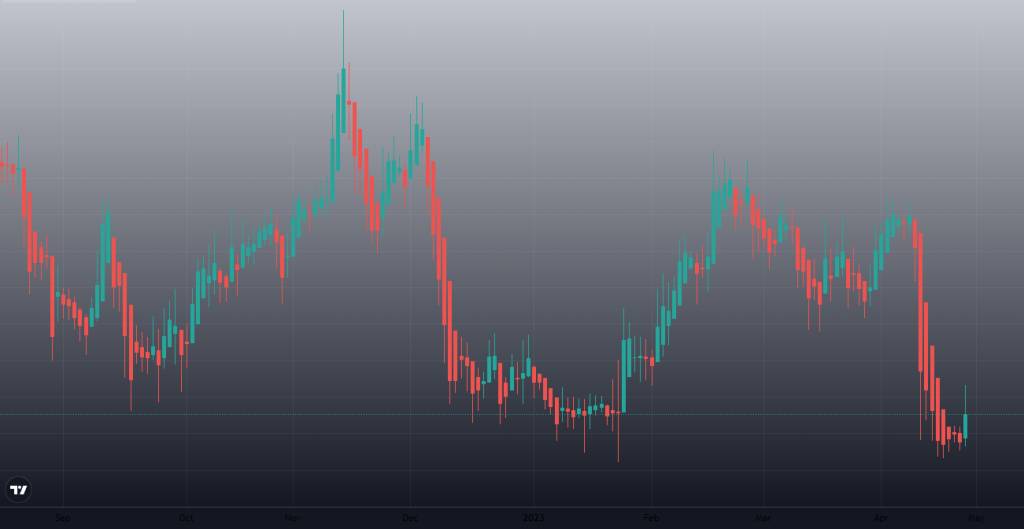
Compare the image above with the following candlestick chart.
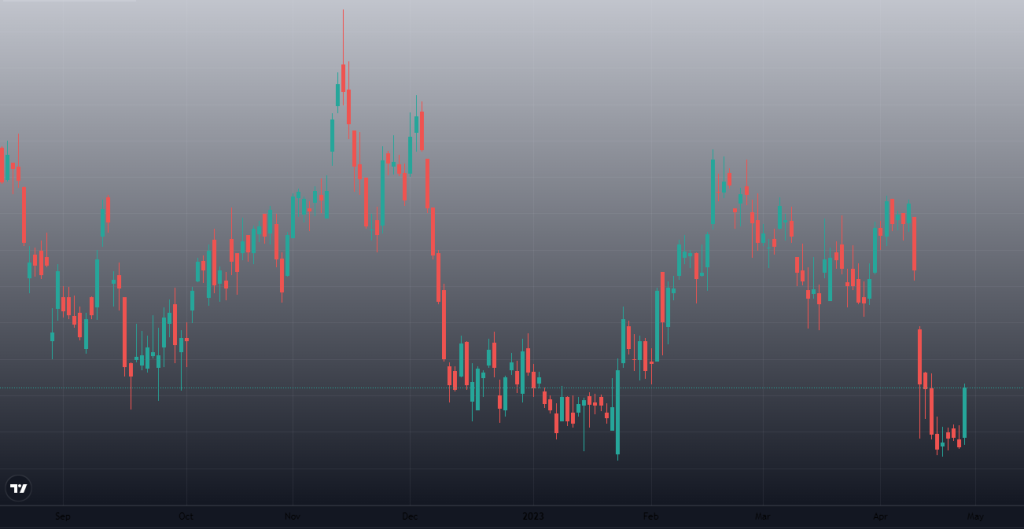
As Gen Z would say, “Same, same but different”. Heikin Ashi averages the prices leading to smoother, more continuous candles compared to regular candlesticks. This has its pros and cons but the distinction can help you identify trends and reversals with greater ease.
Why? Because Heishi Ashi candles reduce the impact of market noise.
You as a trader can enhance your stock, commodity, or forex trading strategies by understanding the components of Heikin Ashi candles, which are composed of four key components that provide a unique way of interpreting price action in financial markets.
- Open: The Heikin Ashi open is the midpoint of the previous candle’s open and close prices. This averaging technique lends continuity to the chart, facilitating a better understanding of the ongoing trend.
- High: The Heikin Ashi high is the maximum value among the current period’s high, open, and close prices. By selecting the highest value, this approach emphasizes the strength of the bulls during an uptrend.
- Low: The Heikin Ashi low is the minimum value among the current period’s low, open, and close prices. This component highlights the bearish forces in a downtrend, helping traders gauge selling pressure.
- Close: The Heikin Ashi close is the average of the current period’s open, high, low, and close prices. This balanced representation of price action allows traders to assess the market’s overall sentiment during a specific period.
How to Read Heikin Ashi Candle Patterns?
Interpreting Heikin Ashi candle patterns requires understanding the unique characteristics of these candles and their relationship to traditional candlestick charts.
Identifying Trends
- Uptrends: Heikin Ashi charts signal an uptrend when a series of green candles with small or no lower wicks appear, indicating strong bullish momentum.
- Downtrends: A downtrend is represented by a succession of red candles with small or no upper wicks, signifying dominant bearish forces.
- Consolidation: When Heikin Ashi candles alternate between green and red with longer wicks, it suggests a consolidation phase, highlighting indecision in the market.
Reversal Patterns
- Bullish Reversal: A bullish reversal is characterized by a green Heikin Ashi candle following a series of red candles, often accompanied by a longer lower wick, signifying a potential shift from bearish to bullish sentiment.
- Bearish Reversal: Conversely, a bearish reversal is marked by a red candle succeeding a string of green candles, typically with a longer upper wick, suggesting a possible transition from bullish to bearish momentum.
Advantages and Disadvantages of Using Heikin Ashi
While Heikin Ashi charts can offer unique insights to you, it’s important to consider both the advantages and disadvantages of using this charting method.
Pros
- Simplified Trend Identification: Heikin Ashi streamlines trend detection by averaging price data, making it easier to spot and follow market trends.
- Reduced Noise: By smoothing price action, Heikin Ashi minimizes market noise, allowing you to focus on significant movements and avoid distractions.
- Improved Risk Management: Heikin Ashi enhances risk management by providing clearer entry and exit signals, enabling traders to set better stop-loss and take-profit levels.
Cons
- Potential Lag in Signals: The averaging process may introduce a lag in signals, leading to delayed entries or exits in fast-moving markets.
- Not Suitable for All Trading Styles: Heikin Ashi may not be ideal for short-term traders or scalpers, as it focuses on longer-term trends and may not capture minor fluctuations effectively.
Heikin Ashi Trading Strategies
Heikin Ashi trading strategies offer traders a different perspective on the markets and can be used in a variety of ways, such as:
- Basic Trend-following Strategy: The Heikin Ashi strategy can be used in a simple trend-following approach. Identify strong uptrends or downtrends by observing the color and wick formations of Heikin Ashi candles, and capitalize on the momentum by trading in the direction of the trend.
- Reversal Trading Strategy: Incorporate Heikin Ashi charts to spot potential reversals in the market. Detect bullish or bearish reversals by analyzing the change in candle color and wick length, and take advantage of these shifts to enter or exit trades timely.
- Breakout Trading Strategy: Maximize the effectiveness of Heikin Ashi charts by combining them with other technical indicators such as support and resistance levels. Identify breakouts from consolidation phases and enter trades in the direction of the breakout for increased profit potential.
Combining Heikin Ashi with Other Technical Indicators
When it comes to Heikin Ashi candles, knowing the best indicator to use with Heikin Ashi charts can help traders make more informed decisions.
Moving Averages
- Simple Moving Average (SMA): Enhance your trading strategy by combining one of the best indicator to use with Heiken Ashi, the SMA. This duo helps confirm trends and potential reversals, allowing for more precise entry and exit points.
- Exponential Moving Average (EMA): Pairing Heiken Ashi with EMA offers a faster response to price changes, reinforcing trend identification and providing additional support and resistance levels.
Oscillators
- Relative Strength Index (RSI): Combine RSI with Heiken Ashi to gauge overbought or oversold market conditions, strengthening entry and exit signals.
The following video will give you a complete walkthrough of the RSI indicator.
- Stochastic Oscillator: Merging Stochastic Oscillator with Heiken Ashi enhances momentum assessment, facilitating better trade execution.
Chart Patterns
- Support and Resistance: Integrating support and resistance levels with Heiken Ashi allows for a comprehensive understanding of potential breakout points and trend reversals.
- Fibonacci Retracements: Combining Fibonacci Retracements with Heiken Ashi enhances your ability to identify critical support and resistance levels, optimizing trade management.
Conclusion
Heikin Ashi charts offer a valuable tool for trend analysis and decision-making in trading. You can enhance your trading experience with Heikin Ashi charts free of charge on Dhan.
Combined with other technical indicators, Heikin Ashi candles have the potential to elevate your trading performance and risk management, making them indispensable in today’s trading landscape.
Like this? Then you’ll love: