There are several methods of finding support and resistance. Some traders use technical indicators that look like a line or a histogram on charts. Others use geometry.
That’s right – geometrical shapes can be used to trade on charts to identify support and resistance.
One example of it is the Gann Box. If you’re wondering what is Gann box, it brings together geometry and the relationship between time and price to determine where a financial security may be headed.
WD Gann, a renowned market analyst, developed the tool for technical analysis along with Gann Fan. Yes, it’s geometric. It’s also versatile. But what is the Gann Box really? Read on to find out.
What is Gann Box?
The Gann Box is a technical analysis tool used for analyzing price movements and forecasting potential price levels in financial markets.
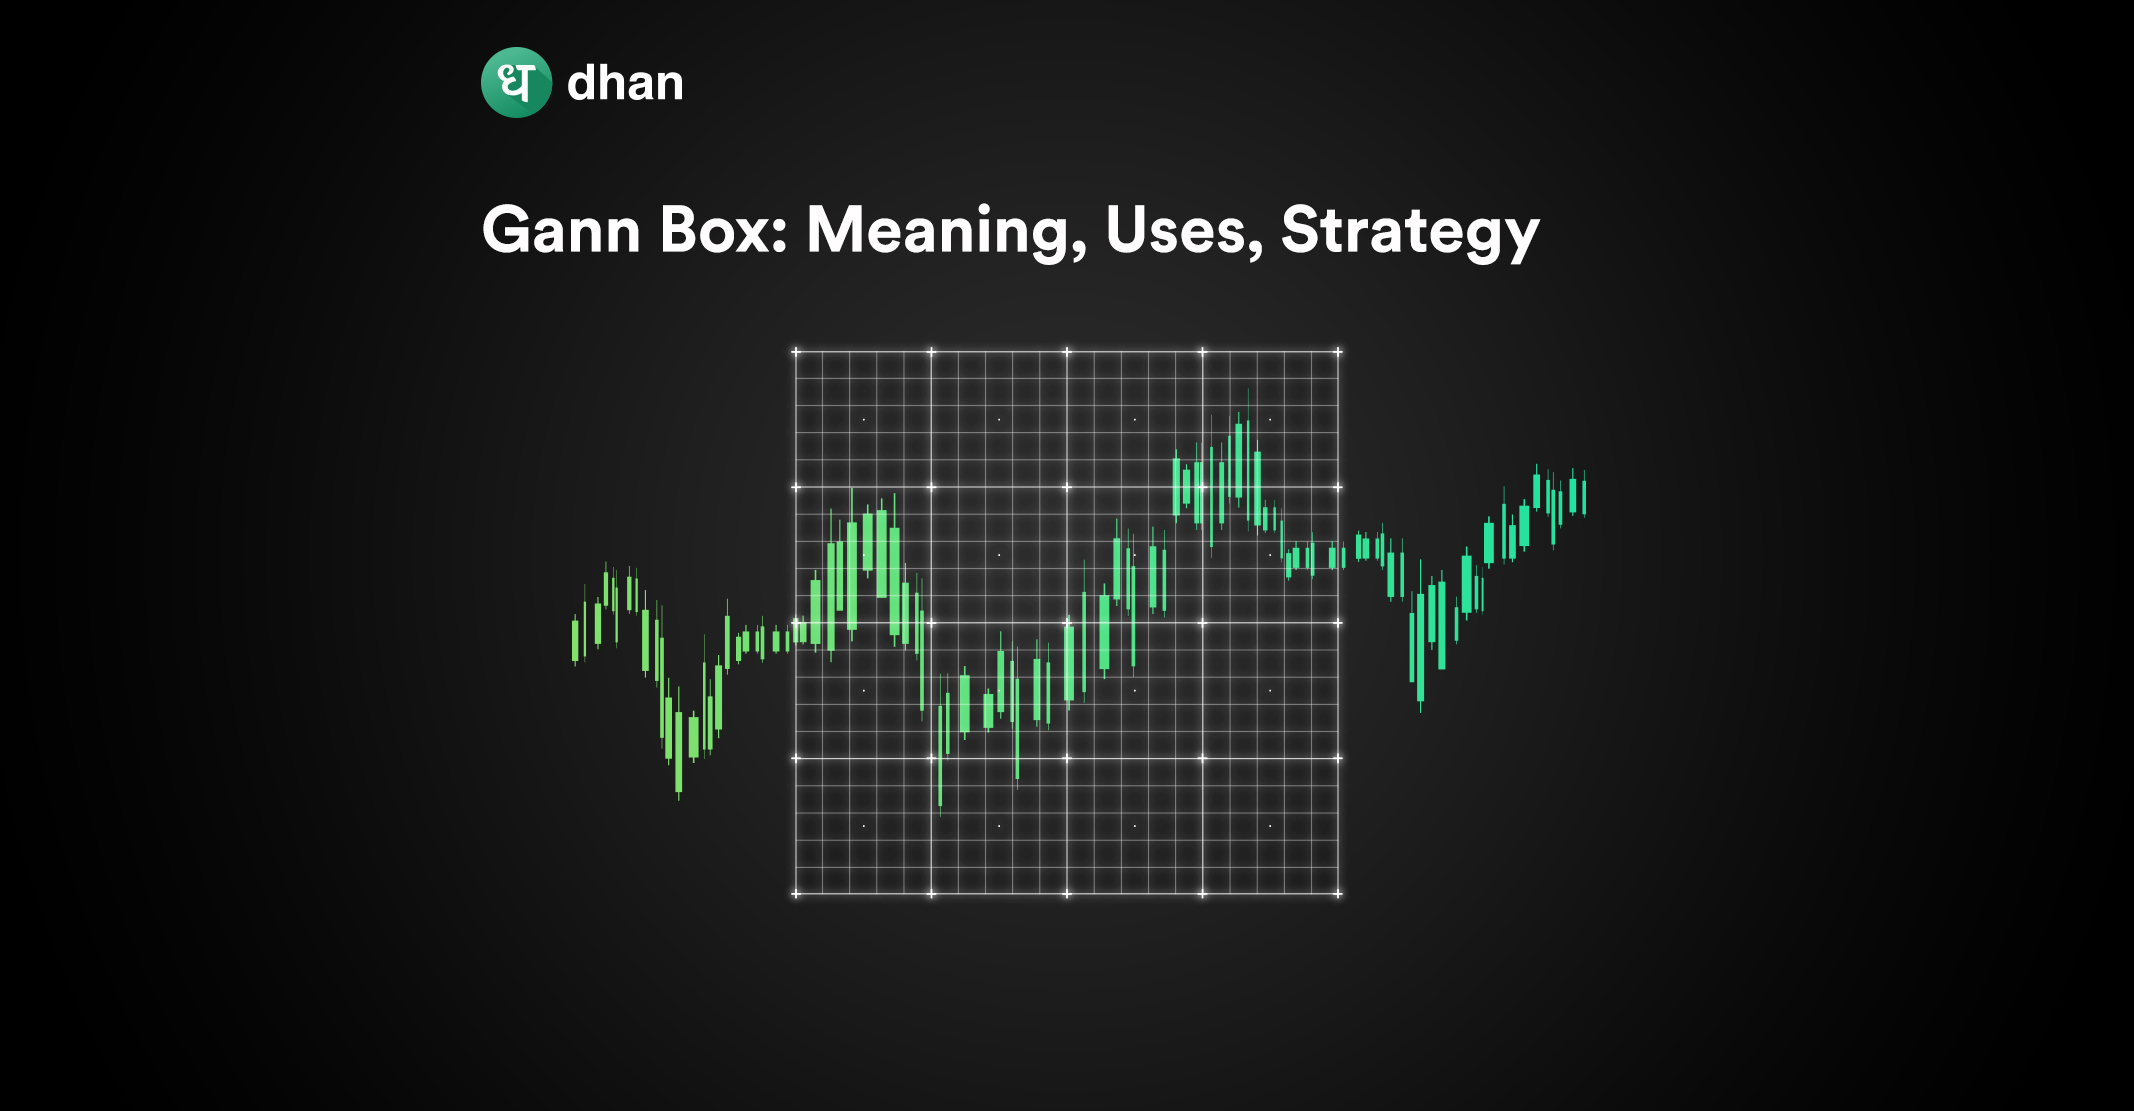
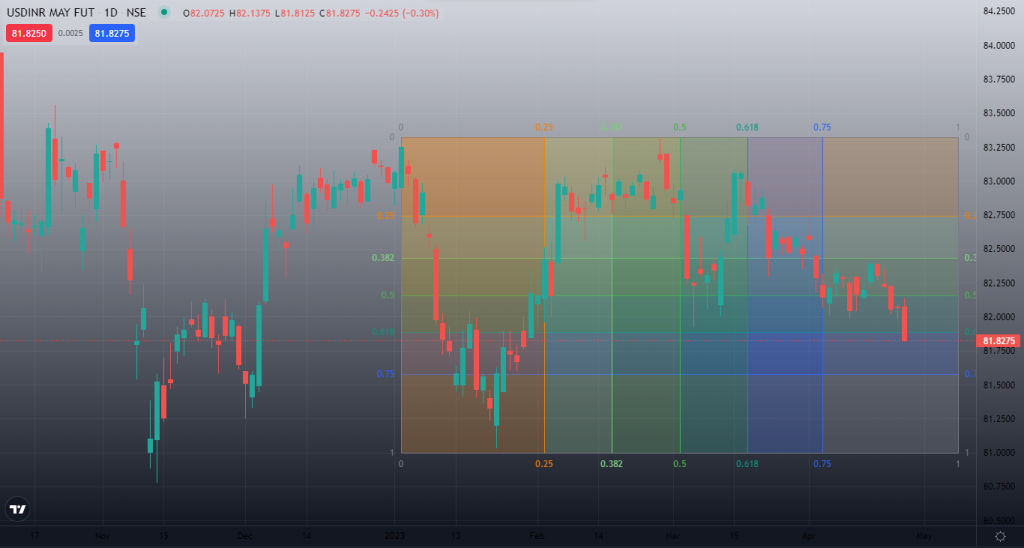
The Gann Box consists of a square or rectangle that is divided into equal partitions for price and time.
The price levels are drawn vertically, while the time levels are drawn horizontally.
These partitions are divided equally to account for time and price, and the scale ratio between price and time is crucial for accurate analysis.
The following image shows what a Gann Box looks like on a chart.
To determine the scale ratio for a specific market, you can calculate the variance between two primary points, such as the top-to-top or bottom-to-bottom of a market movement. The question is, what does this allow you to do.
For starters, you’ll be able to set the appropriate price and time levels based on your individual preferences and trading strategy.
One of the key features of the Gann Box is its ability to determine price and time levels across a wide range of markets, with or without angles. This makes it a versatile tool that can be applied to various financial instruments, including stocks, currencies, commodities, and more.
How to Use the Gann Box?
The Gann Box can be used alone or in conjunction with other technical analysis tools and techniques to identify potential investment opportunities and make trading decisions.
By identifying key price and time levels at various points in time, you as a trader can gain insights into potential trend reversals, support and resistance levels, and market turning points.
W.D. Gann believed that markets moved in cycles. Add angles to the mix and you have a recipe for trading wisely. More on that here:
1. Identifying and Measuring Cycles
The Gann Box is primarily used to identify and measure cycles in price movements.
You can use this tool to identify recurring patterns or cycles in the market, which can help you anticipate potential price movements in the future.
Using this understanding, you can make full use of prices and the cycles of the market.
2. Drawing Support and Resistance Levels
The Gann Box can be used to draw support and resistance levels on a chart. These levels can provide important insights into potential price reversals or areas of price congestion.
By identifying these key levels using the Gann Box, traders can make more accurate predictions about price movements and adjust their trading strategies accordingly.
3. Determining Price Targets
You could also use the Gann Box to determine price targets by drawing the Gann Box from significant price lows to highs, or vice versa.
This will help you find potential price targets based on the geometrical relationships within the box.
This can help traders set profit targets or determine potential exit points for their trades.
4. Assessing Market Strength and Weakness
Whether you’re a stock, commodity, or forex trader, you can use the Gann Box to assess the strength or weaknesses of a market.
By observing how price interacts with the lines drawn within the Gann Box, traders are known to gauge whether the market is in a strong uptrend, downtrend, or consolidating.
This information can be valuable in making trading decisions and managing risk.
5. Combining with Other Technical Analysis Tools
You can use the Gann Box can in conjunction with other technical analysis tools to confirm or validate trading signals.
Traders often combine the Gann Box with other tools such as trend lines, Fibonacci retracements, and moving averages to gain a more comprehensive view of the market and make more informed trading decisions
Types of Gann Box Strategies
The Gann Box is a popular technical analysis tool used by traders to develop trading strategies. It offers various ways to identify potential trading opportunities.
1. Trend-following Strategy: This is a popular Gann box strategy. Traders can use the Gann Box to identify trends and enter trades in the direction of the trend when the price breaks above or below trendlines.
2. Reversals Strategy: The Gann Box can be used to spot potential price reversals or bounces when the price approaches the outer trendlines of the box, signalling a potential change in direction.
3. Support and Resistance Strategy: Traders can identify support and resistance levels within the Gann Box and use them as trading levels to enter or exit trades.
4. Confluence Strategy: The Gann Box can be used in conjunction with other technical tools, such as Fibonacci Retracements or trendlines, to identify confluence areas where multiple factors align, potentially increasing the probability of a successful trade.
Combining Gann Box with Candlestick Patterns
We’ve discussed multiple times about the importance of combining multiple technical tools to get the best results. The Gann Box is no exception. In fact, combining the Gann Box with various candlestick patterns can help you get better trading signals.
1. Confirmation of Support and Resistance
Let’s say your Gann Box has helped you identify support or resistance. Then you should check for a corresponding candlestick pattern around the same zone.
For instance, a bullish engulfing candlestick pattern near a Gann Box support level may suggest a strong long trade signal.
2. Reversal Confirmation
Check the Gann Box reversal zone for a corresponding reversal candlestick pattern like a Doji or shooting star pattern. It may suggest a strong reversal confirmation.
3. Trend Continuation
How do you identify a trend continuation? Combine the Gann Box with a visual aid full of bullish or bearish candles that continue for a certain period of time.
Pros & Cons of Using Gann Box for Trading
Much like any other tool for technical analysis, the Gann Box has its own set of strengths and limitations.
You should know about both before you decide to use the tool for trading.
| Pros of Gann Box | Cons of Gann Box |
| Helps identify support and resistance | Selecting reference points is subjective |
| Combines time and price analysis | Steep learning curve |
| Can be used for all segments | Overreliance can lead to overfitting |
| Combines well with other tools | Not foolproof as a standalone tool |
| Historial legacy of successful use | Complex for novice traders |
Conclusion
By now, you would’ve understood What is Gann Box. The Gann Box is a powerful technical analysis tool that offers traders a unique approach to identifying potential trading opportunities.
This versatile tool allows users to set a duration and a range of prices for a cycle that repeats over a user-defined period of time.
By leveraging the Gann Box, traders can gain insights into potential opportunities and make informed decisions in the market.
It’s important for traders to understand the principles of Gann Box trading and incorporate proper risk management and backtesting when using it.
Like this? Then you’ll love: