Most traders are used to candlestick charts that capture even the smallest of price movements in either direction. Your typical candlestick chart also accounts for the price as well as time. But did you know that there’s a type of candle that discounts time? Meet Renko charts.
Renko charts have gained immense popularity in the world of online stock trading due to their simplicity and effectiveness. This charting technique is based on price movement and can be used to identify trends and potential entry and exit points. Let’s dive deeper.
What is a Renko Chart?
A Renko chart is a type of chart used in technical analysis that focuses on price movements rather than time intervals. Unlike traditional charts, Renko charts are not time-based but are price-based.
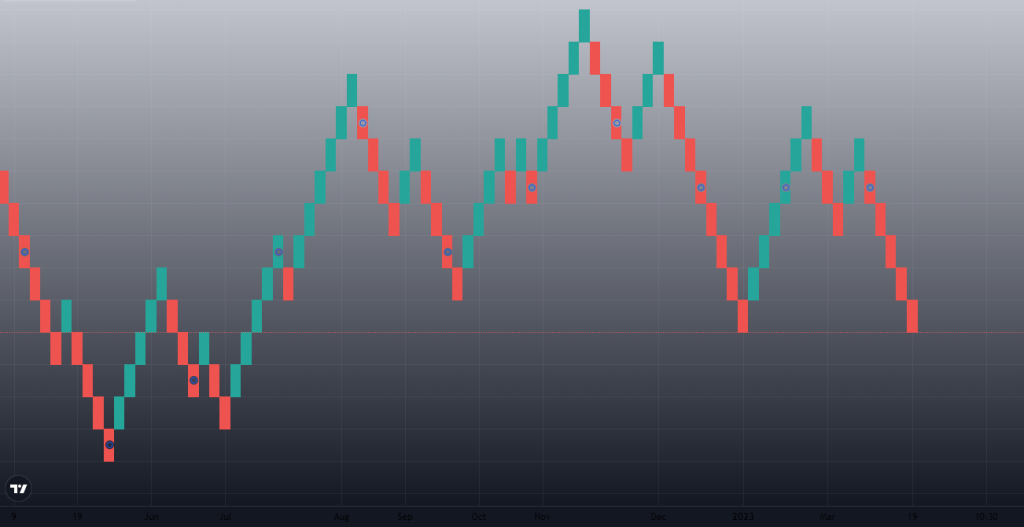
They are created by drawing boxes or bricks of a fixed size representing price movement. Each brick is drawn in the direction of the price movement, and the trader determines the size of each brick. The following image will show you what a traditional Renko chart looks like.
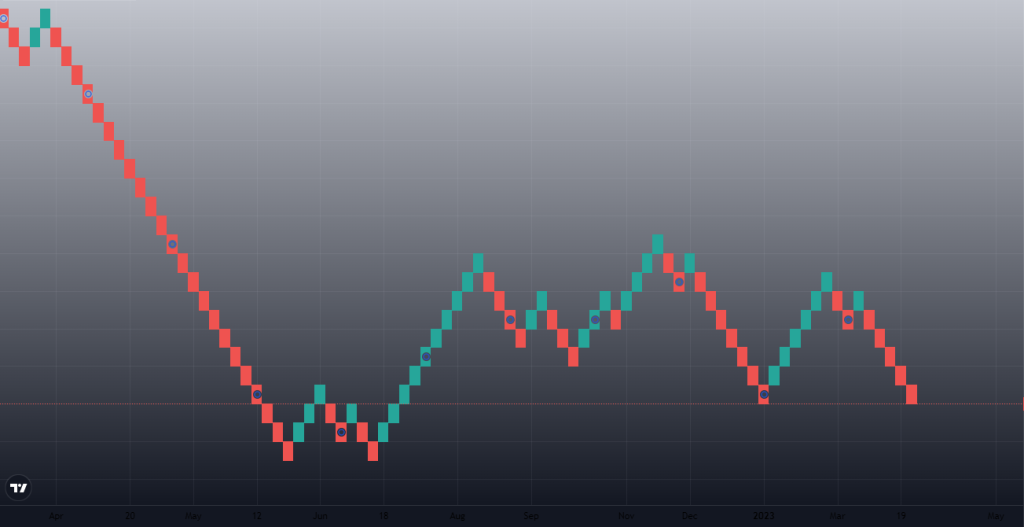
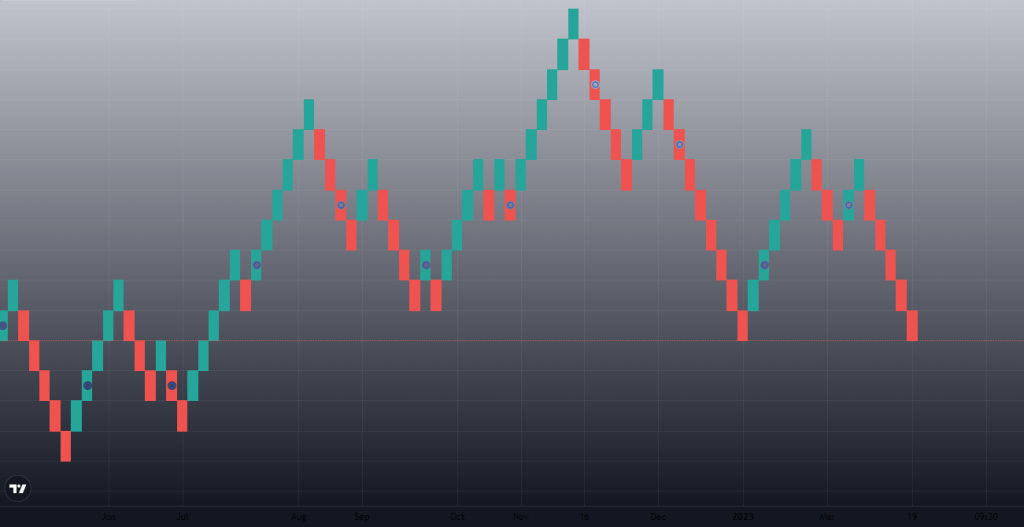
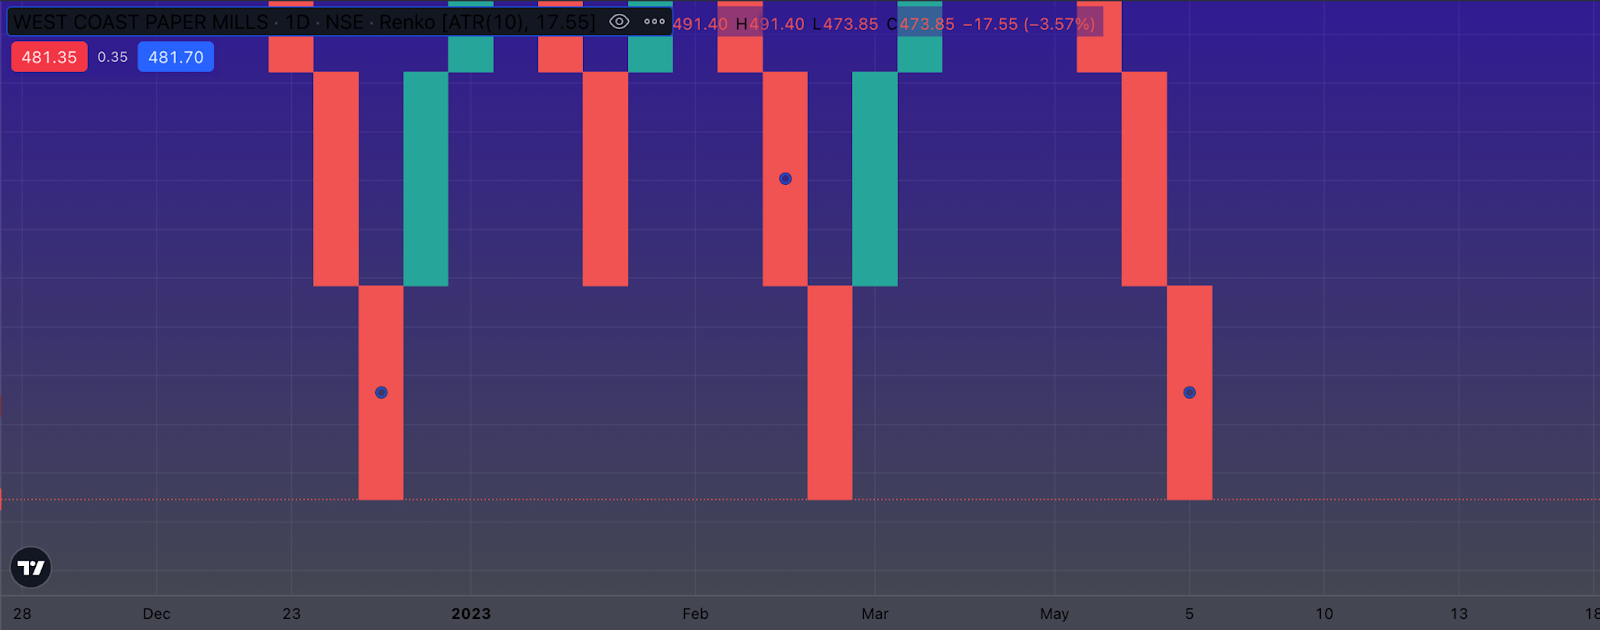
The emphasis on traditional is because you can set the Renko bricks based on the Average True Range (ATR) as well.
Either way, a larger brick size may be suitable for securities that have higher volatility. Smaller brick sizes may be appropriate for low-volatility securities.
Renko charts have several benefits that make them a valuable tool for you. The primary benefit is that they are easy to read and understand.
Unlike typical candlestick charts, Renko charts provide a clear and concise view of price movement, which makes it easier for traders to identify trends and potential entry and exit points. This is known as blocking out “noise”.
Another benefit of the Renko chart indicator is that they filter out noise and volatility. Renko charts only show price movement that is equal to or greater than the brick size, which means that they eliminate small price movements that can create false signals.
Pros and Cons of Renko Charts
| Pros of Renko Charts | Cons of Renko Charts |
| Reduced Noise | Limited Time Frame |
| Clear Trend Signals | Misses Small Moves |
| Eliminates Volatility | Limited Historical Data |
| Simplicity & Clarity | Can Delay Entry/Exit |
| Effective for Trends | Not Ideal for Scalping |
Steps To Use Renko Charts
Now that we have covered the basics of Renko charts let’s discuss how to use them. There are a few key steps that you need to follow to use Renko charts effectively:
Step 1: Determine the Brick Size
The first step in using Renko charts is to determine the brick size. The brick size is the minimum price movement required to draw a new brick on the chart. For example, if you set the brick size to 10 pips in forex, a new brick will only be drawn when the price moves up or down by at least 10 pips.
The brick size that you choose will depend on your trading style and the type of stock, commodity, f&o, or currency pair that you are trading. A larger brick size will produce fewer bricks, which can make it easier to identify trends, while a smaller brick size will produce more bricks, which can provide more trading opportunities.
Step 2: Identify Trends
The next step is to identify trends using Renko charts. Renko charts make it easy to identify trends because they eliminate noise and volatility. To identify a trend, you need to look for a series of bricks that are either all bullish (green) or all bearish (red). A series of bullish bricks indicates an uptrend, while a series of bearish bricks indicates a downtrend.
Step 3: Look for Trading Opportunities
This is the last step – finding trading opportunities. One way to do this is to look for price reversals. A price reversal occurs when the price moves in the opposite direction of the trend.
For example, if the trend is up and the price starts to move down, this could indicate a potential reversal.
Another way to identify trading opportunities is to look for support and resistance levels. These levels help to find entry/exit points.
Best Renko Chart Settings
The best Renko chart settings will depend on your trading style and strategy. However, these are some of the general thumb rules that traders follow:
- Choose a brick size appropriate for the asset or financial security you are trading. A larger brick size may be more suitable for securities with higher volatility, while a smaller one may be more appropriate for securities with lower volatility.
- Use a time frame that is appropriate for your trading style. Renko charts can be used on any time frame, but the most common time frames are 5 minutes, 15 minutes, and 30 minutes.
- Use multiple time frames to confirm your trades. For example, if you use a 15-minute Renko chart, you can verify your trades by looking at a 5-minute and 30-minute Renko chart.
Use Renko Charts Versus Other Charts
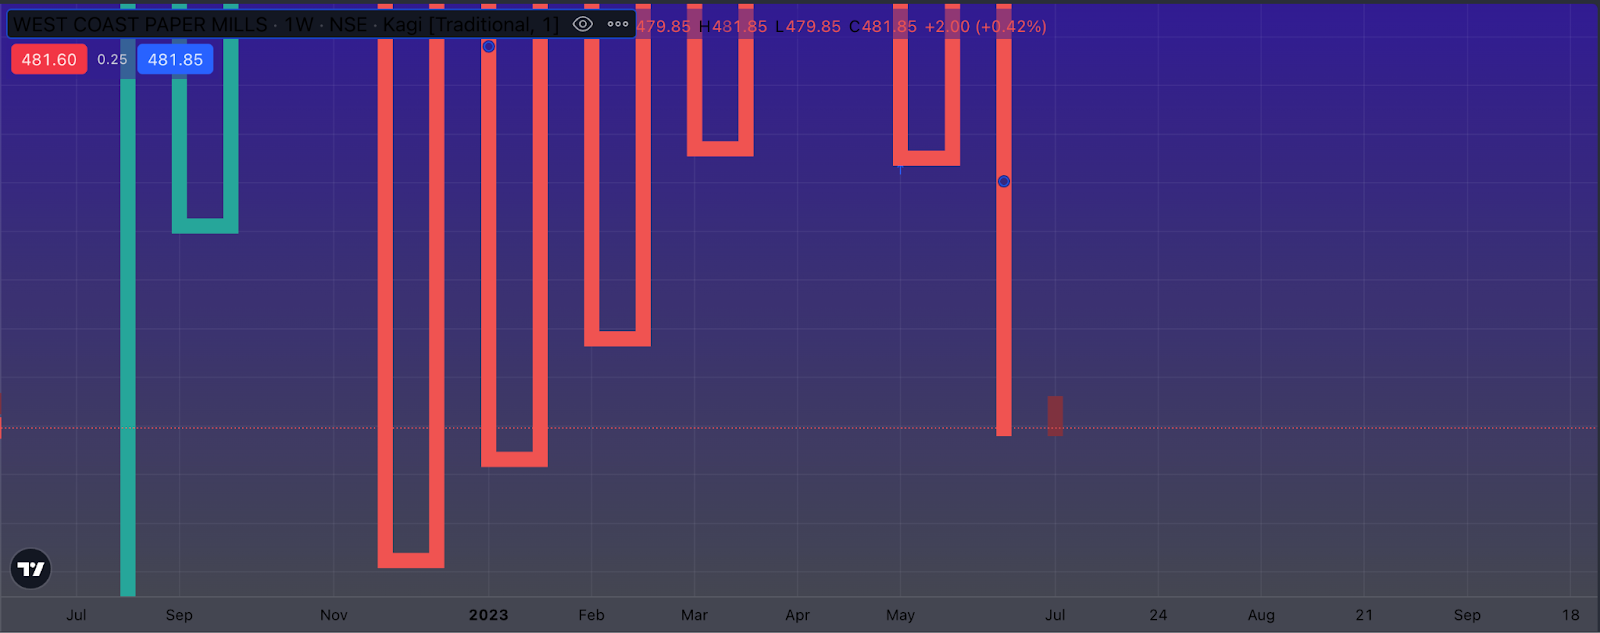
It’s important to remember that there are several types of technical charts, Renko being just one of these types. That’s why it’s important to know how Renko charts fare against others. We’ll take Kagi charts and Point & Figure charts.
Unlike Renko charts, Kagi charts are built to track pure price movement and not price levels. They’re represented as vertical lines that move only when the price crosses a predefined reversal amount.
Point and Figure (P&F) charts are unique. They eliminate time entirely and only consider price movements that meet predefined criteria (typically a minimum price change).
The way P&F charts look is also interesting. These charts consist of X’s and O’s, with X’s representing upward price movements and O’s representing downward price movements.
1. Price
You’ll see price changes as fixed bricks on Renko charts whereas Kagi charts will show you the direction of price movements. Much like Renko charts, P&F charts show price movement based on pre-defined criteria.

2. Noise
Renko and Kagi charts filter out minor price fluctuations, while Point and Figure charts focus solely on significant price movements.
3. Usefulness
Renko and P&F charts are effective in identifying trends and reversals, while Kagi charts are specially useful for capturing long-term trends.
Should You Use Renko Charts?
While Renko charts can be a powerful tool for identifying trends and potential trading opportunities, it is essential to remember that they are not foolproof.
Like any trading indicator, Renko charts should be used in conjunction with other indicators like AVWAP, Bollinger Bands, RSI, MACD, and others as well as more techniques to confirm trades. Here are a few pointers for trading with Renko charts:
- Use trailing stop-loss orders to manage risk. Stop-loss orders are orders that are placed to automatically sell a trade if the price reaches a certain level. This limit losses if the trade takes an opposite direction.
- Use multiple time frames to confirm your trades to reduce the risk of false signals.
- Use other indicators and analysis techniques to confirm trades. Renko should not be used in isolation but should be used in conjunction with other indicators and analysis techniques to confirm trades.
Conclusion
Renko charts are an excellent addition to any trader’s arsenal. They offer a unique perspective on market trends and can be a powerful tool for identifying potential trading opportunities. With its ability to filter out the noise and highlight important price movements, Renko is a valuable chart for both novice and experienced traders.