The Donchian Channel is a technical analysis tool that helps traders understand the trends in the market and make decisions about trading.
Knowing how to use it can help you trade better and get the most out of your analysis.
In this article, we will look at what the Donchian Channel is, its calculation, and how you can benefit from using it to enhance your trades.
What is the Donchian Channel Strategy?
The Donchian Channel is a technical analysis tool that measures the volatility of price movements in stocks, commodities, and futures contracts.
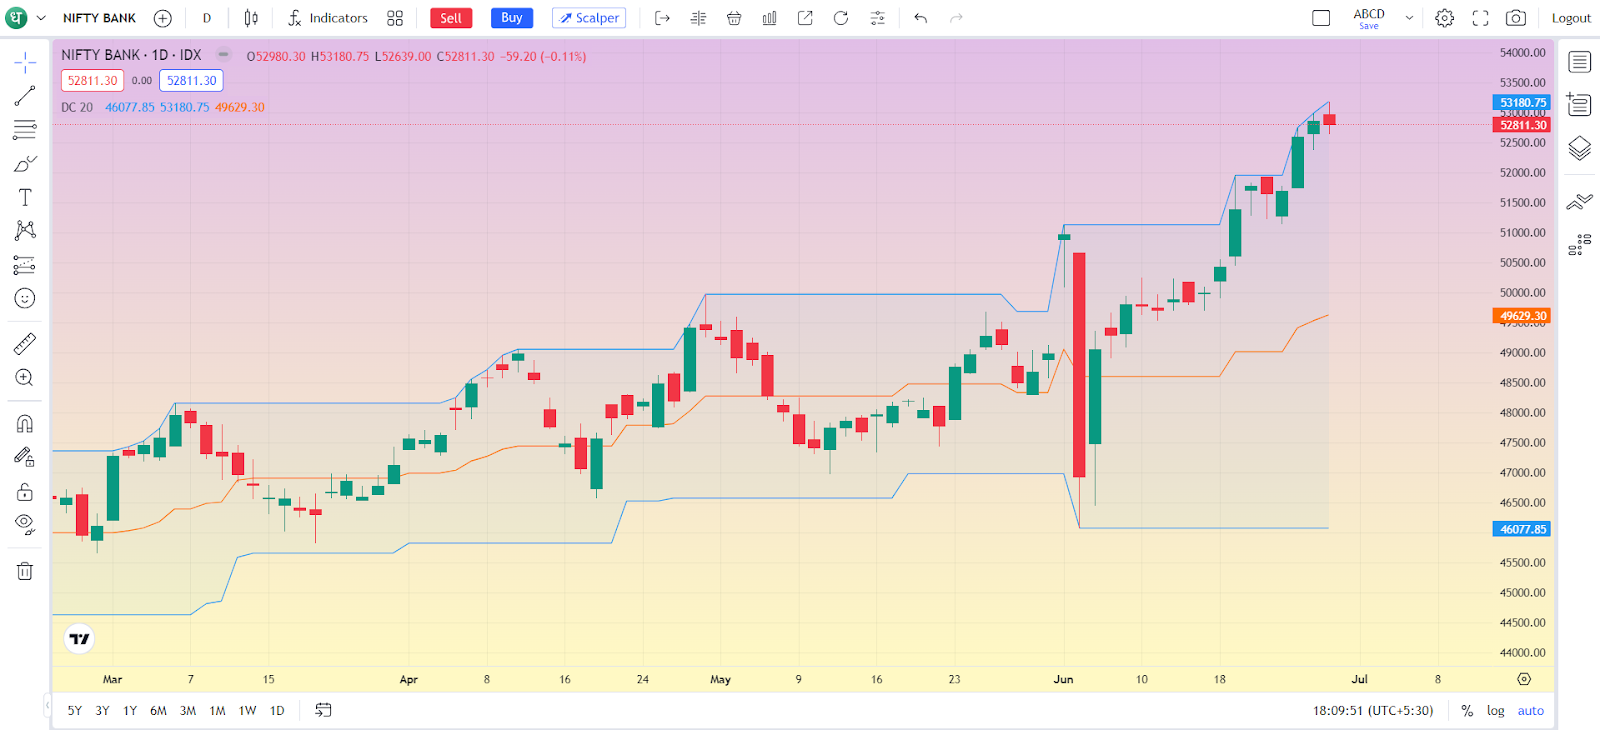
It consists of three lines: the upper band, the middle band, and the lower band.
- Upper band: The highest price of a security from the previous period
- Middle band: The average of the current high and low for the trading period
- Lower band: The lowest price of the security from the previous period
The middle band is often used as a breakout sign. Traders can open a long position when the stock climbs above the middle band or a short position when the price drops below the middle band.
Traders use the Donchian Channel strategy to identify potential breakout points and gauge the strength of market trends.
How to Calculate the Donchian Channel Indicator
Here’s how to calculate the Donchian Channel Indicator:
- Upper band: This is the highest high in the last N periods.
- Middle band: This is the lowest low in the last N periods.
- Lower band: This is the average of the Upper and Lower channels, calculated as (UC + LC) / 2
Where:
- UC is the Upper channel
- N is the number of minutes, hours, days, weeks, or months
- LC is the Lower channel
The period can be adjusted based on your trading strategy. However, the most common is 20 periods (the typical number of trading days in a month).
Uses of the Donchian Channel
Donchian channels are technical indicators used in financial markets to identify potential trends. They can be used in stocks, forex, commodities, and other markets.
Donchian channels have several uses, including:
1. Identifying Trend Direction
The Donchian Channel helps traders identify the direction of the prevailing trend by using its upper and lower bands.
In an uptrend, prices typically remain above the upper band, while in a downtrend, prices tend to stay below the lower band.
By observing the position of prices relative to these bands, traders can gain insights into whether the market is trending upward, downward, or sideways, guiding their trading decisions accordingly.
2. Measuring Volatility
When the width between the upper and lower bands widens, it shows that the market is more volatile.
Conversely, if the width narrows, it indicates lower volatility. Traders can utilize this information to adjust their trading strategies.
For instance, during high volatility, they may opt for wider stop-loss orders to accommodate price fluctuations, while during low volatility, they may tighten their stop-loss levels to minimize risk.
3. Generating Entry and Exit Signals
Traders use the Donchian Channel to decide when to enter and exit trades. When prices break above the upper band, it signals a potential opportunity to buy.
On the other hand, if prices drop below the lower band, it suggests a chance to sell. This strategy helps traders capitalize on trends and avoid losses.
By following these signals, traders can make better decisions and increase their odds of success in the market.
4. Setting Stop Loss and Take Profit Level
To set stop-loss and take-profit levels, traders can use the upper and lower bands as reference points.
If you’re in a long position, you might place your stop-loss order below the lower band to limit potential losses. For short positions, you’d place your stop-loss order above the upper band.
This helps manage risk by defining exit points based on the channel’s boundaries, allowing traders to protect their profits and minimize losses.
5. Identifying Breakouts
Breakouts happen when prices move beyond the upper or lower boundaries of the channel. Traders watch for these breakouts as they may signal the start of a new trend or a significant price movement.
For instance, a potential uptrend may be indicated by prices breaking above the upper boundary, while a possible downturn could be suggested by prices breaking below the lower boundary.
Traders use breakout strategies to capitalize on these price movements.
How to Use Donchian Channels in Trading
Here are some steps to use Donchian channels in trading:
- Determine the period for the Donchian channel
- Plot the Donchian channel on a chart
- Keep an eye on how the Dochian channel affects the price
- Calculate the center band by averaging the lower and upper bands
- Utilize the middle line of the Donchian channel as an indicator of when to open or close a position
- If the price moves above the middle line, open a long position
- If the price moves below the middle line, open a short position
- If the upper band touches, place buy orders
- If the lower band touches, place sell orders
Dhan recently became the first broker in the world to allow Options Trading from TradingView's Trading Panel! Go check it out here!
Conclusion
The Donchian Channel is a helpful tool for traders to understand market trends and make smart trading choices.
By learning how to use it and adjusting your strategies accordingly, you can improve your trading results and reach your financial goals.