The Volume-Weighted Average Price (VWAP) is a popular technical indicator because it helps establish support and resistance levels. However, it can be used only for a particular day, not longer. The Anchored VWAP indicator fixes this problem.
What is the Anchored VWAP Indicator?
Anchored VWAP is a technical indicator that can be used to identify entry and exit points for a trade based on the weighted rupee cost average of a financial security.
The AVWAP computes the average price of a security relative to its volume over a period of time.
Great! But VWAP also helps you do the same thing. Then the question is, why does AVWAP exist when there’s VWAP?
The answer is that although VWAP is a solid indicator for technical analysis on charts, it has a limitation – time.
The VWAP resets at the start of a new trading day. Essentially, you can use VWAP from the first to the last candle of a trading session.
While this may be useful for intraday traders, those who want to enter positions and hold them for more than a day can’t rely on VWAP. This is why AVWAP exists.
Unlike VWAP, Anchored VWAP can be used for more than a single trading session. This means you can “anchor” the indicator to any past point on a chart.
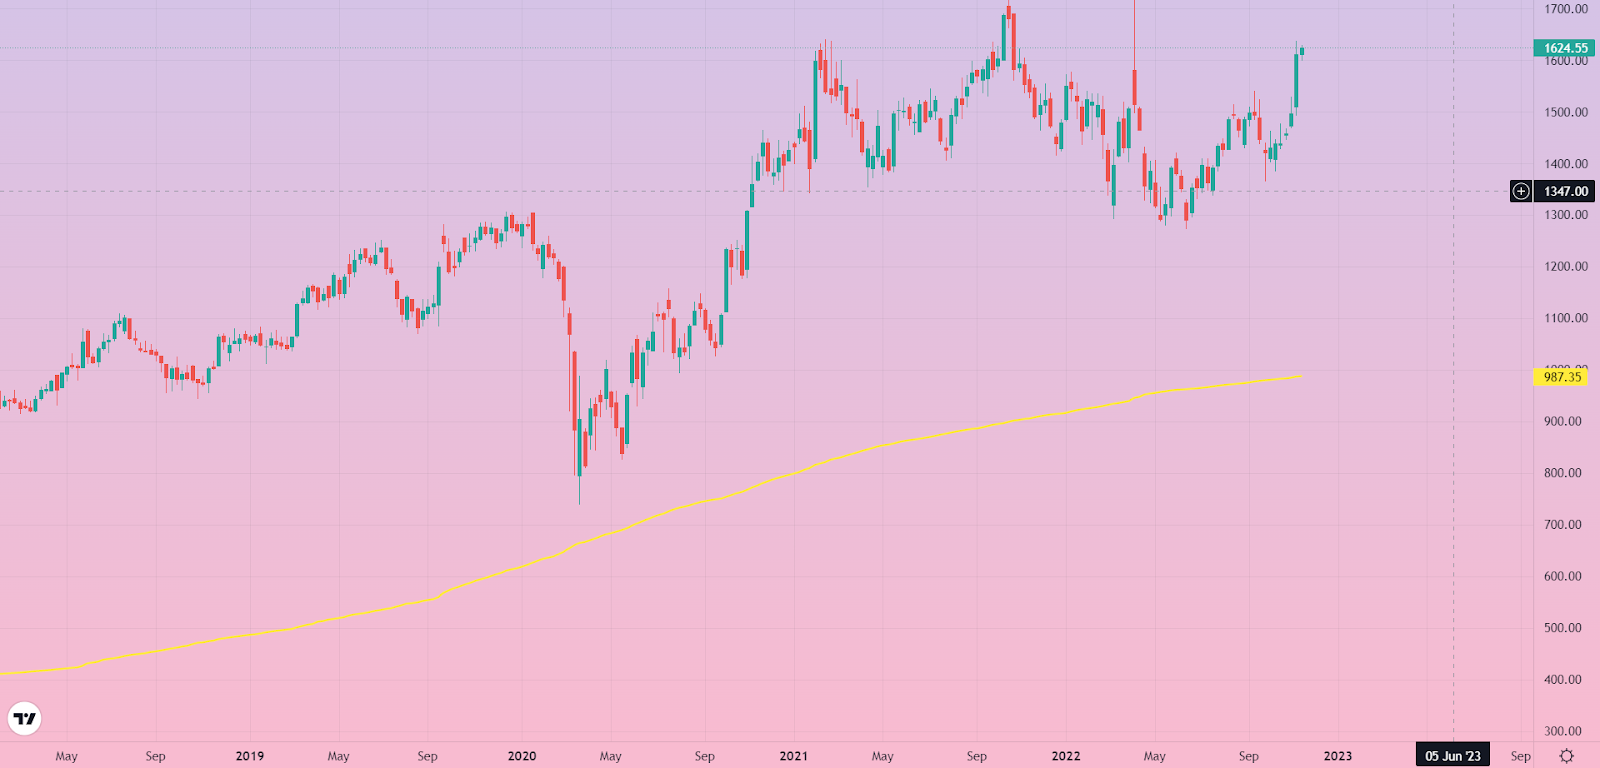
Here’s a visual representation of what AVWAP looks like on charts.
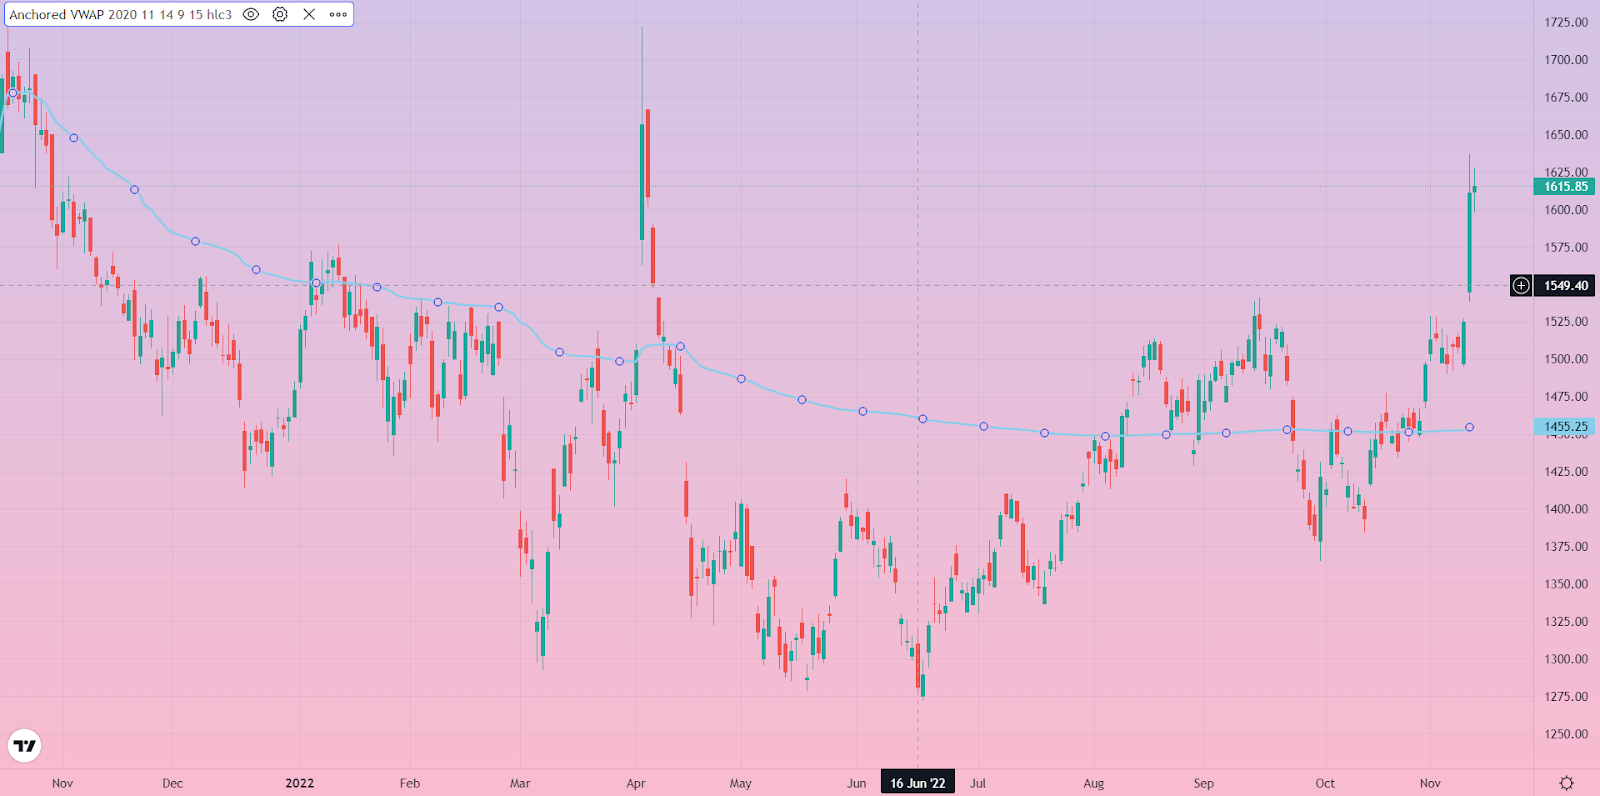
We’ve anchored the indicator to a year. But you can pick any point. For example, you could anchor to a bar that has the highest volume or the day after an earnings call.
By the way, we’ve explained more popular volatility indicators like:
How to Calculate Anchored VWAP Formula?
The Anchored VWAP incorporates three key elements into the calculation – Price, Volume, and Time, the weighted average of which tells you whether there’s buying or selling pressure.
Anchored VWAP Formula = Σ(Price x Volume) / ΣVolume
Here, the price is simply the last traded price of a security. Volume means the total number of shares or contracts that have changed hands over the course of time.
You could also look at volume as the market sentiment for a specific security or derivative.
A high-volume security will exchange hands at a greater pace (aka in an uptrend), meaning the market perceives it to be valuable.
Whereas a low-volume security indicates that traders simply don’t want to go near it (aka in a downtrend).
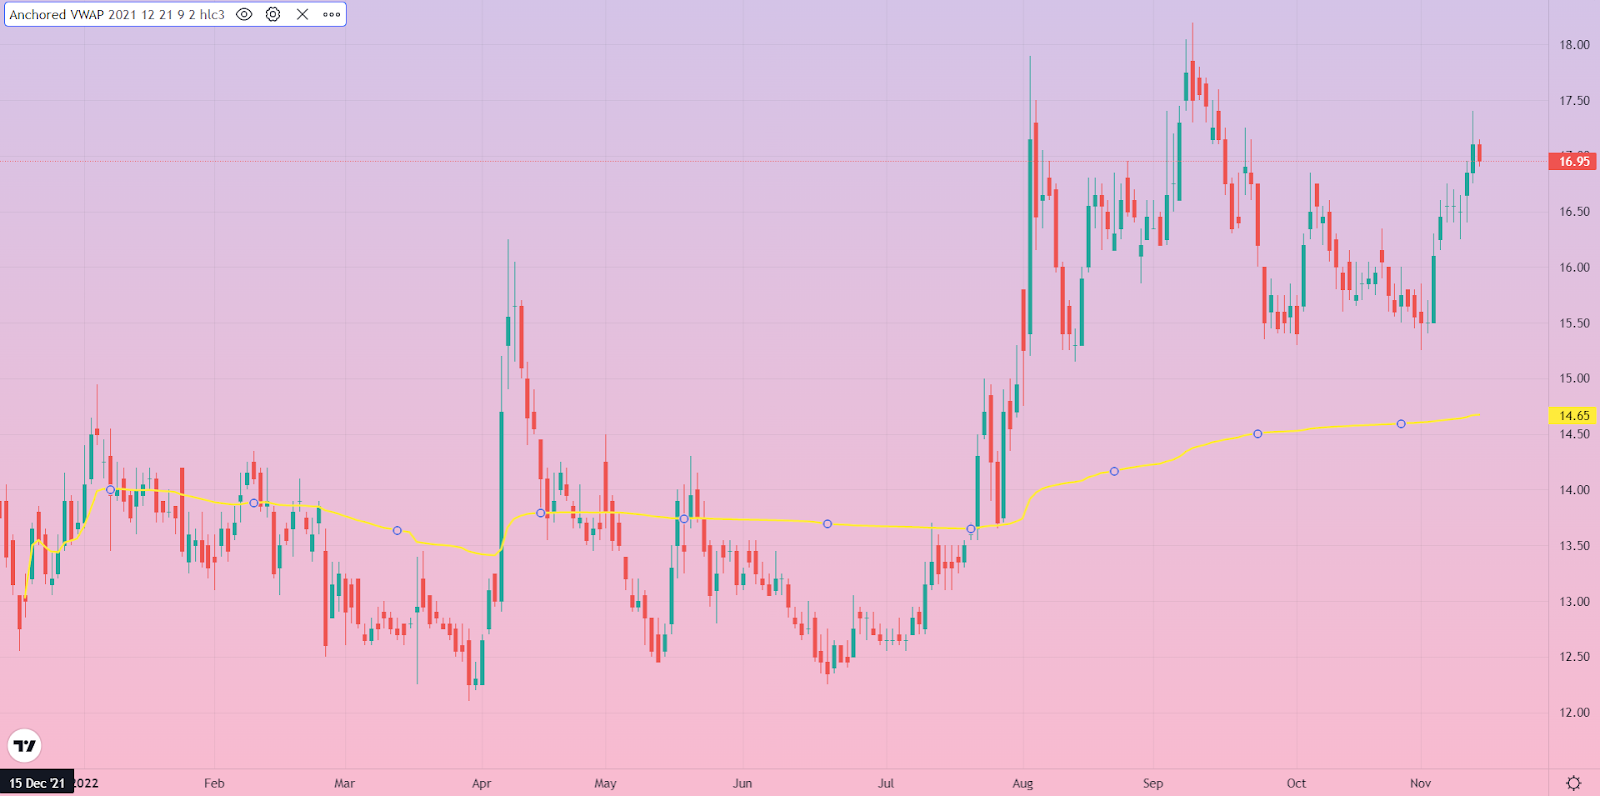
In fact, this is clearly visible when you use the AVWAP indicator or the VWAP. Check out the image below to know more.
The Significance of the Anchored VWAP Indicator
Let’s start this section with a fun fact. Some traders like to use the AVWAP indicator with even more AVWAP!
At this point, you must be wondering why anybody would use the same indicator twice, on the same chart, for the same security.
Here’s an example to help you visualize. Let’s say you anchor your VWAP to the first bar after an earnings call while trading directly from charts.
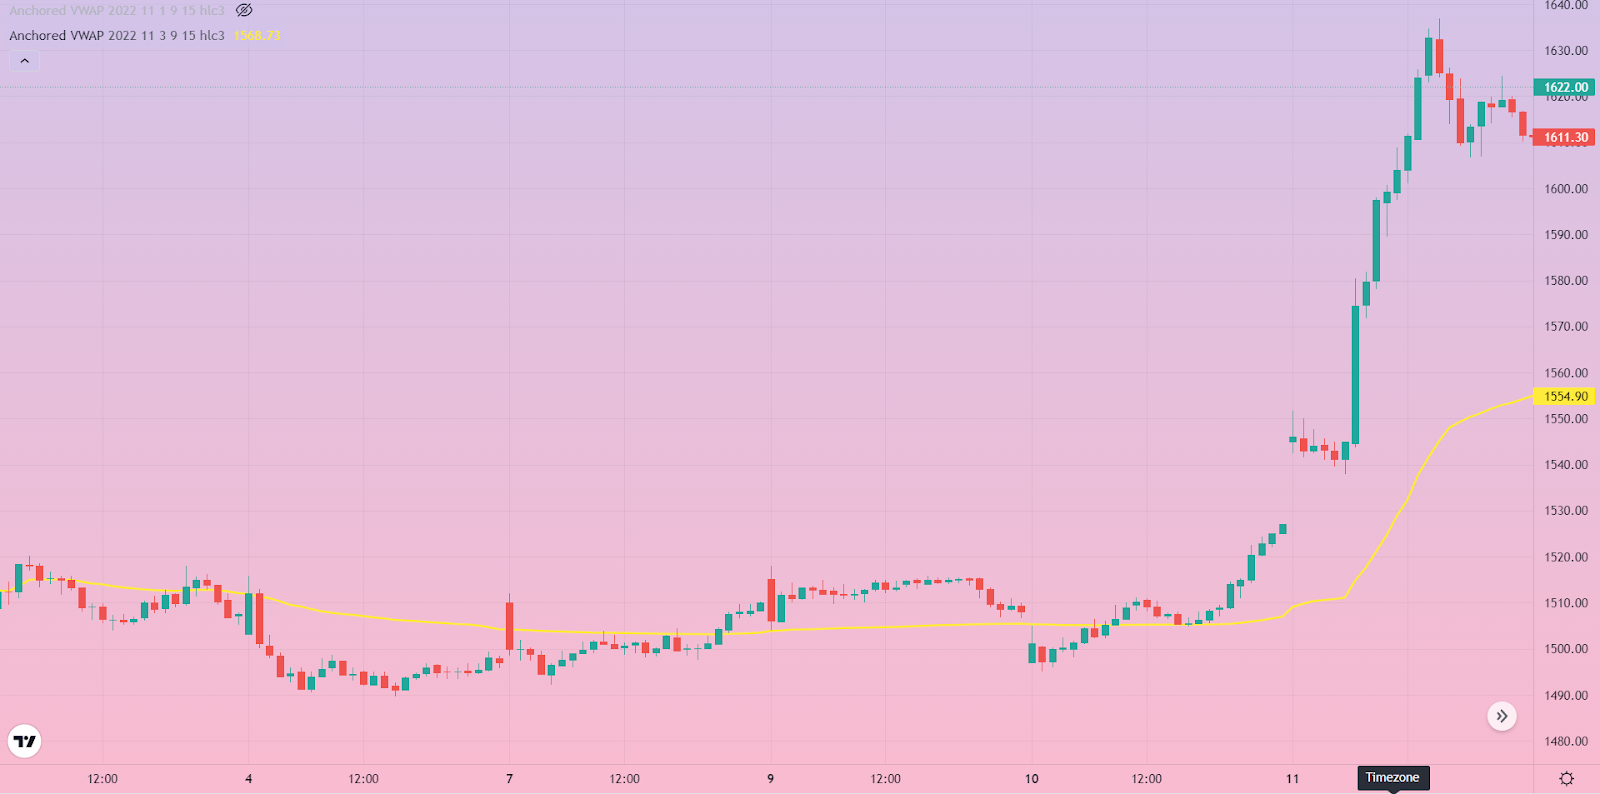
But you want to understand the movement better, especially from a historical perspective. Then you could simply add another anchor to, say, the first candle after the previous earnings call.
Things get interesting when you add two anchored VWAPs. If the yellow and purple lines intersect in an uptrend, then you have a buy signal. If they intersect in a downtrend, you have a sell signal.
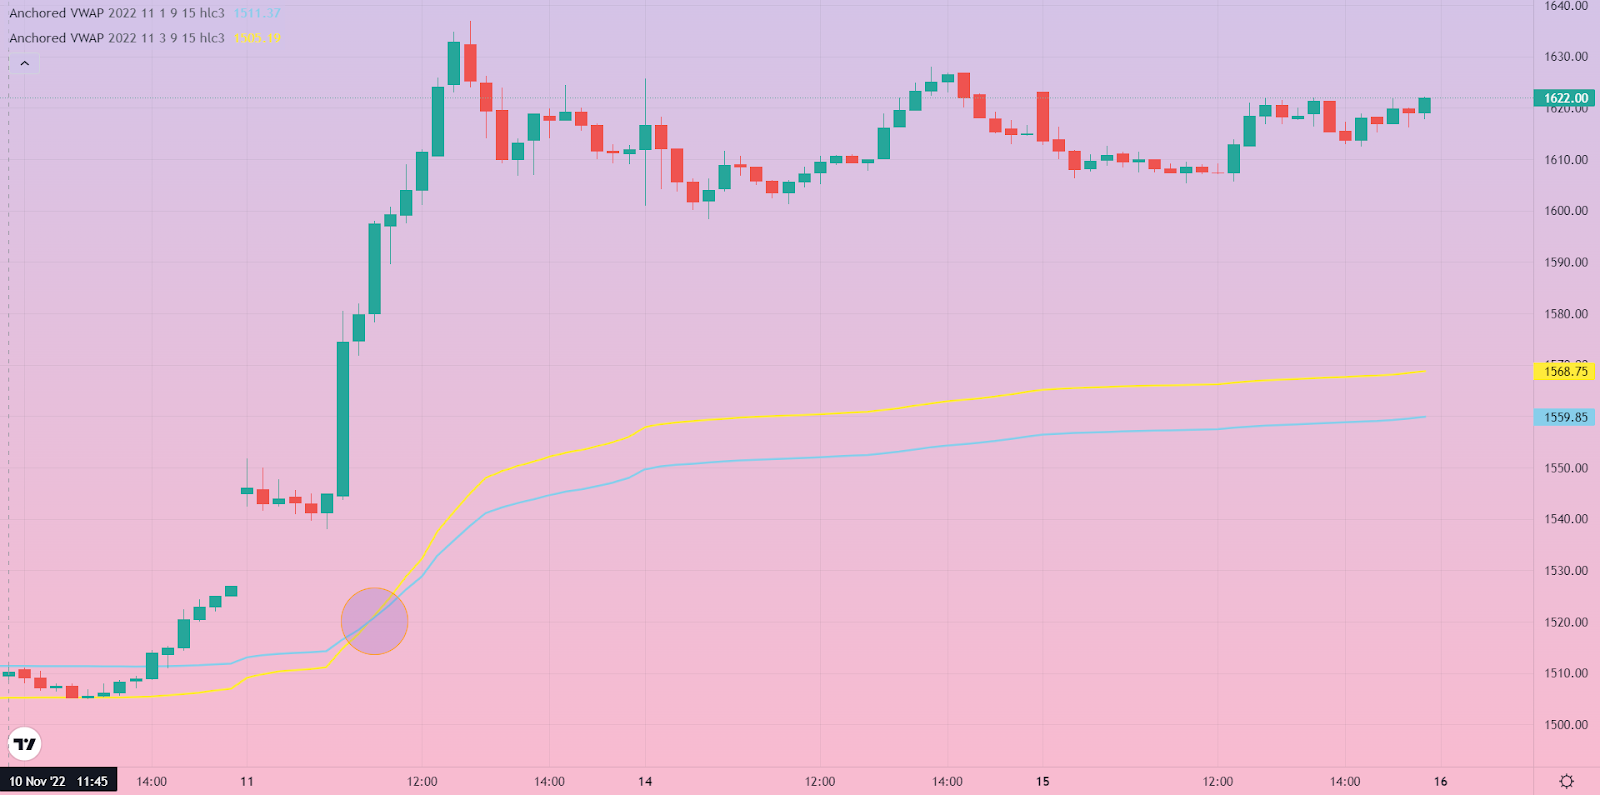
One could say the AVWAP is open to interpretation in many ways. Everything is customizable when it comes to this indicator.
That’s why traders can use their own methodology in terms of chart timeframe, periods, and others to zero in on what works for them.
In the screenshots above, we’ve used a 15-minute chart timeframe – you could use 1 minute, 2 minutes, and other chart timeframes when you’re trading stock online.
Broadly speaking, however, the universal understandings you can get from AVWAP are as follows:
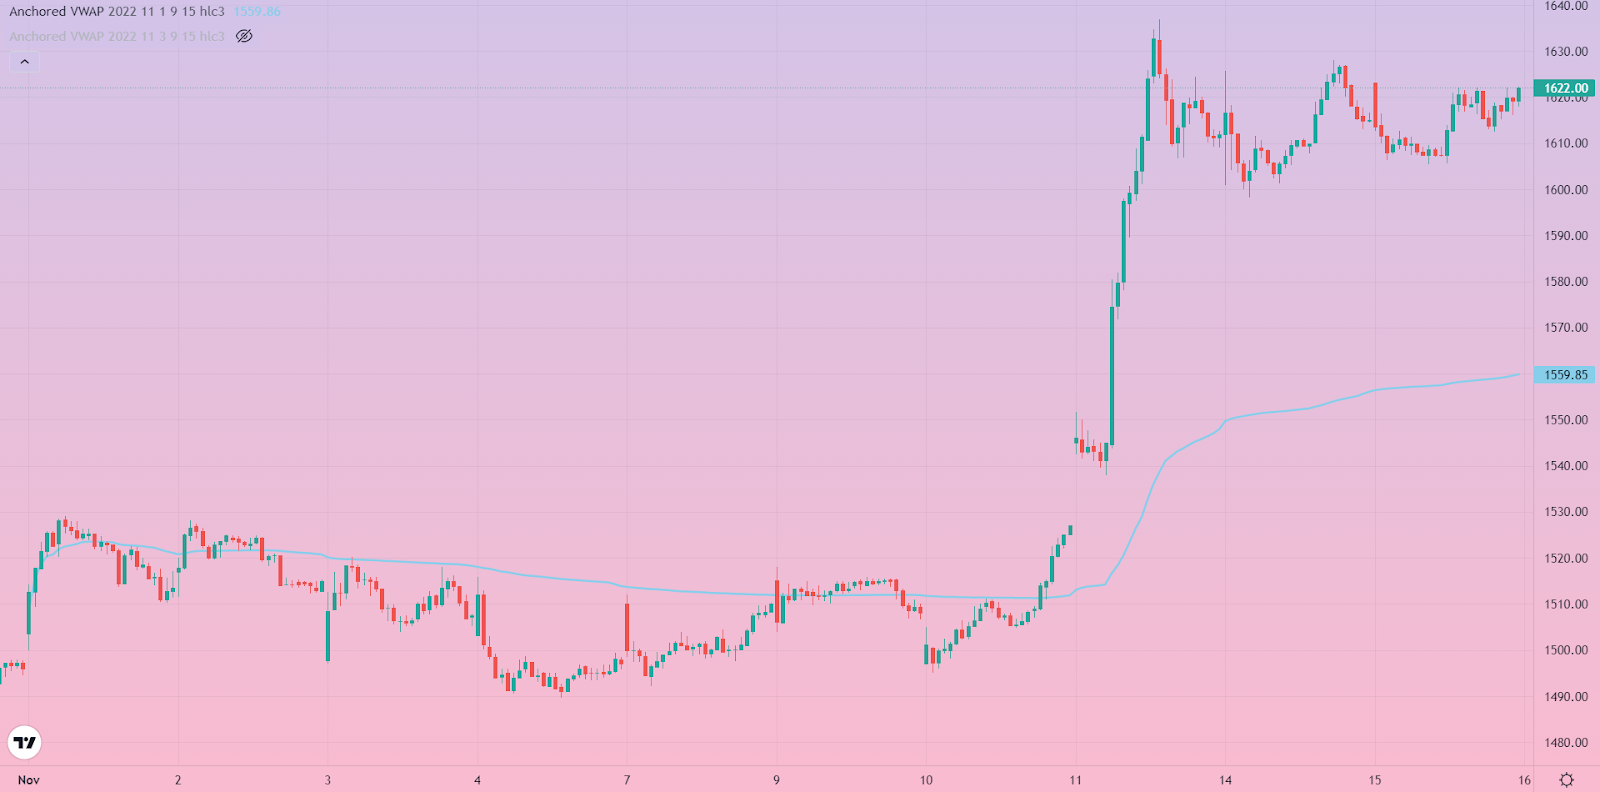
- Rising VWAP: Buying pressure
- Falling VWAP: Selling pressure
- Flat VWAP: Neutral (dry/no volume)
These three pointers satisfy the basic criteria of zeroing in on a trading signal. That’s the primary goal of using the indicator – to find out when to buy or sell a security.
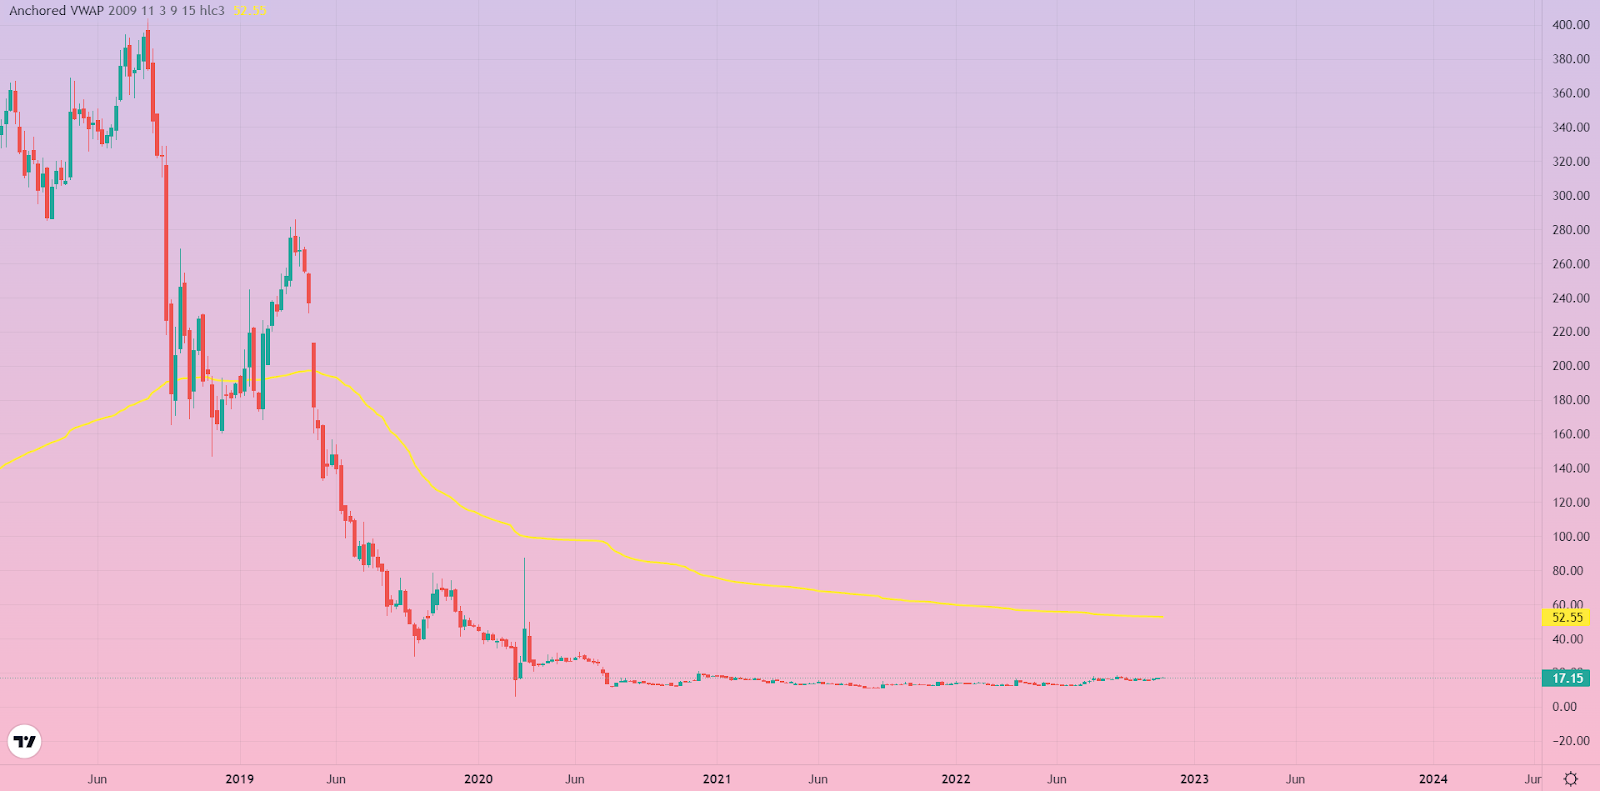
You can see these three scenarios playing out when using Anchored VWAP on charts.
Other than that, the AVWAP is known to be a useful tool to demystify supply and demand and enter positions.
Just like in economics, supply and demand are known to be one of the primary driving forces of prices in the markets.
AVWAP is built to help traders get the best of these very fluctuations by factoring in volume, price, and time. If supply is high and demand is low, your AVWAP line will move downwards.
Vice versa, it’ll move upwards. This is especially useful for swing traders, BTST traders, and others who typically don’t do day trading.
Speaking of swing traders and BTST traders, here’s a game-changing feature for both: Margin Trading Facility (MTF)
Difference Between VWAP and Anchored VWAP
Historically, the VWAP indicator’s primary limitation has been time. The AVWAP indicator goes beyond this and allows you to anchor your VWAP to any past point on a chart.
While you can use VWAP only for intraday, AVWAP can be used for any period of time, ranging from a couple of trading sessions to years.
This is the only difference between VWAP and Anchored VWAP. The regular VWAP indicator incorporates volume and price to calculate a weighted average.
While the VWAP calculation is possible only for one day, Anchored VWAP can be calculated for days, weeks, months, and years.
By combining the regular VWAP indicator’s strengths and overcoming its limitations, AVWAP opens up the game for a larger set of traders.
Other than that, AVWAP is more or less similar to VWAP. It is calculated by dividing the product of volume and price by volume.
The table below shows the difference and similarities between VWAP and AVWAP.
| Metric | VWAP | AVWAP |
| Name | Volume Weighted Average Price | Anchored Volume Weighted Average Price |
| Formula | Σ(Price x Volume) / ΣVolume | Σ(Price x Volume) / ΣVolume |
| Timeframe | One day | More than one day |
Conclusion
The Anchored VWAP was introduced as a way to analyze more than a day’s weighted average price of a security in relation to its volume. In a way, it’s an improvement to the VWAP.
As a result, a trader can anchor their VWAP to any bar on a chart to better understand volatility.
Its predecessor VWAP is still used extensively, at times in conjunction with the AVWAP.
The benefactors of the AVWAP are swing traders and positional traders who typically hold positions for more than a single trading session.
However, the Anchored VWAP indicator is known to be subjective – the interpretations are based on your custom parameters.
To summarize:
- Anchored VWAP is an upgraded version of the VWAP
- AVWAP can be used for more than one trading session
- AVWAP is a lagging indicator used to analyze historical data
P.S: You can use this indicator for swing trading that is one of the best forex trading strategies, and also features as one of the Best Indicator For Intraday!