Intraday trading requires you to make quick buying and selling decisions. That’s why you need specialized tools that can help you better analyze the market and securities.
These tools are nothing but intraday indicators that provide immediate insight into price, volume, momentum, and much more. To make your research easier, we’ve compiled some of the best indicators for intraday in this blog!
What is an Intraday Indicator?
Intraday indicators are tools used by traders to make quick decisions during the trading day.
They run on mathematical calculations and each technical indicator shows the true meaning of real-time price and volume data, acting as a compass for spotting short-term entry and exit points.
Indicators for day trading are diverse and include the likes of trend, momentum, and volume indicators.
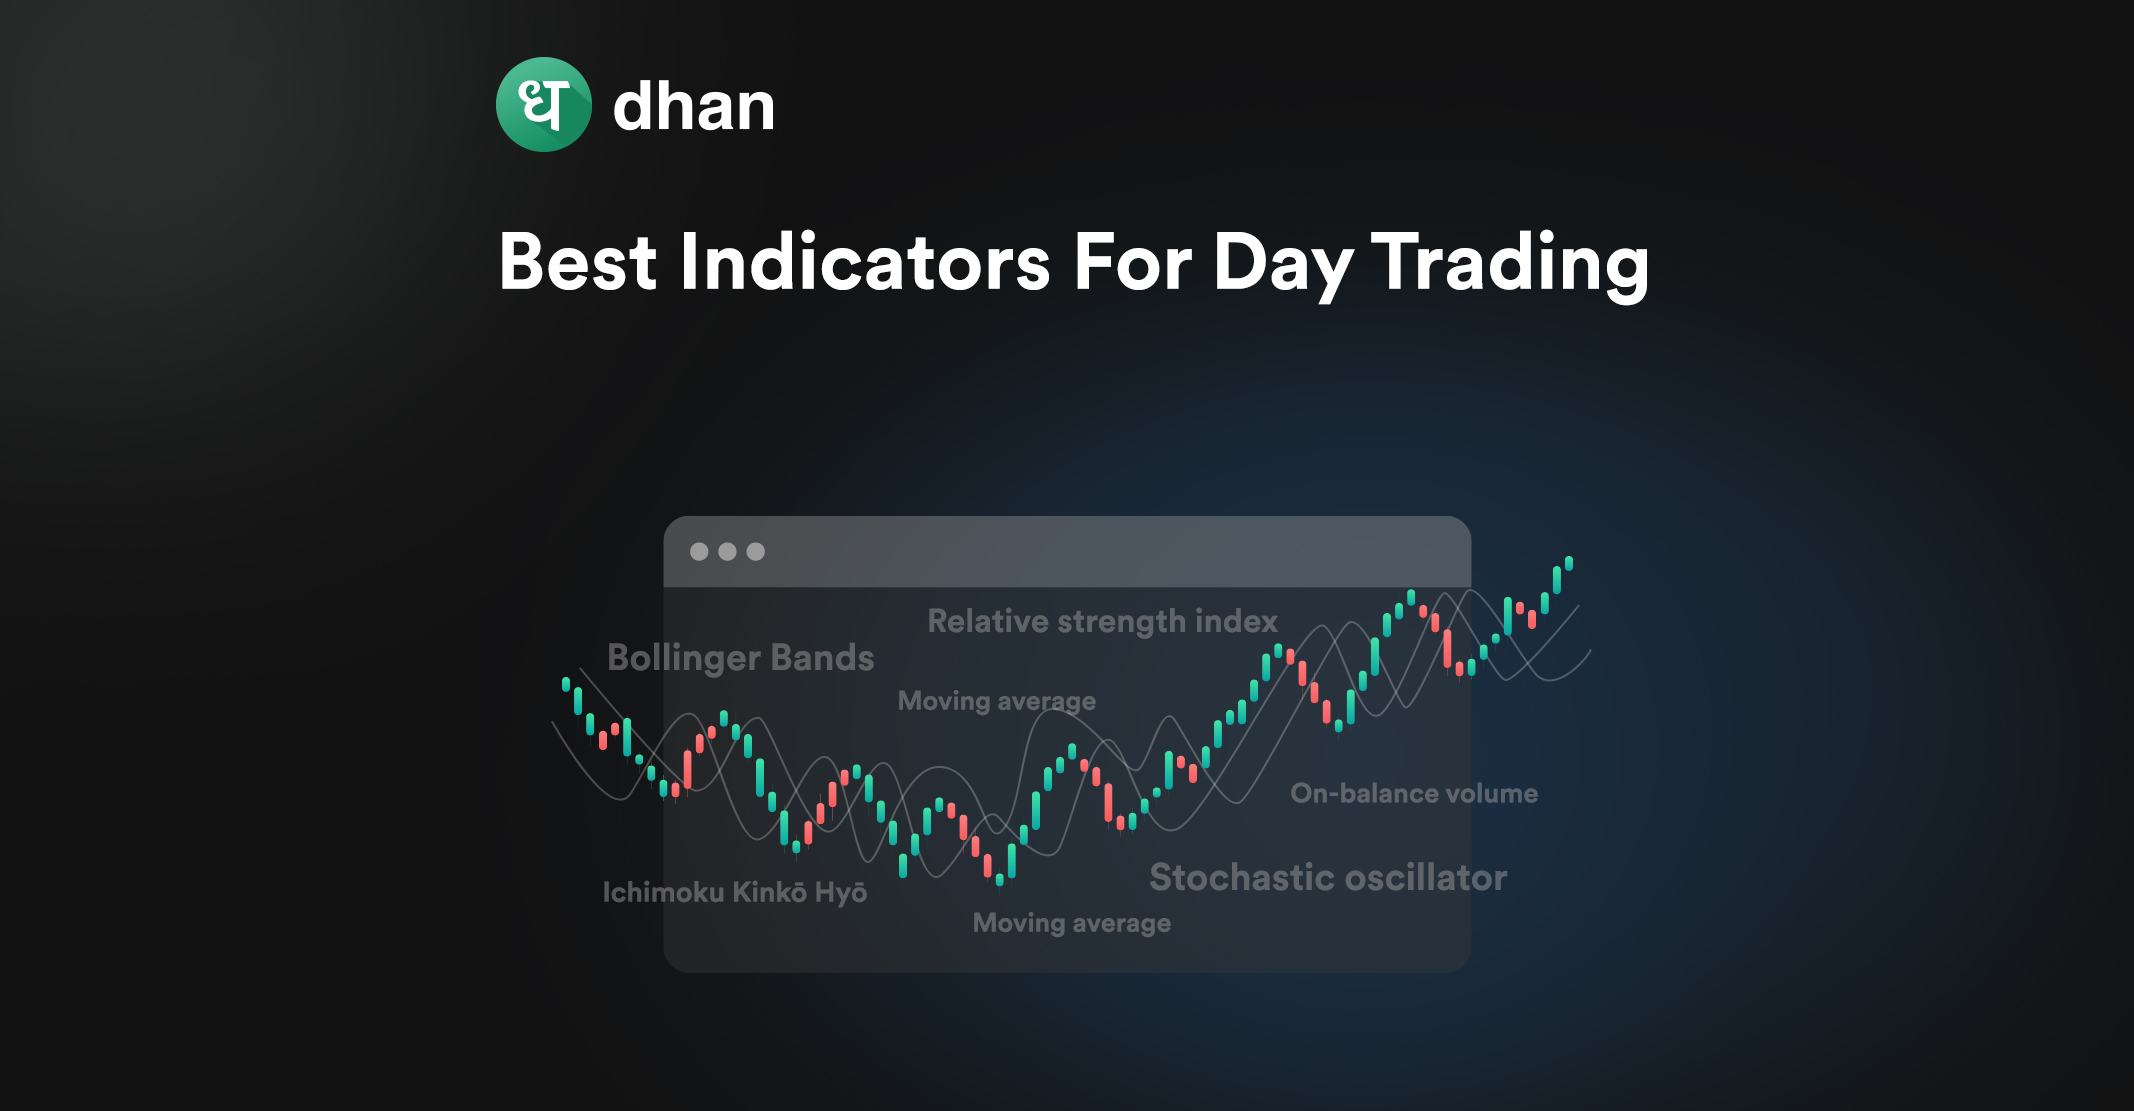
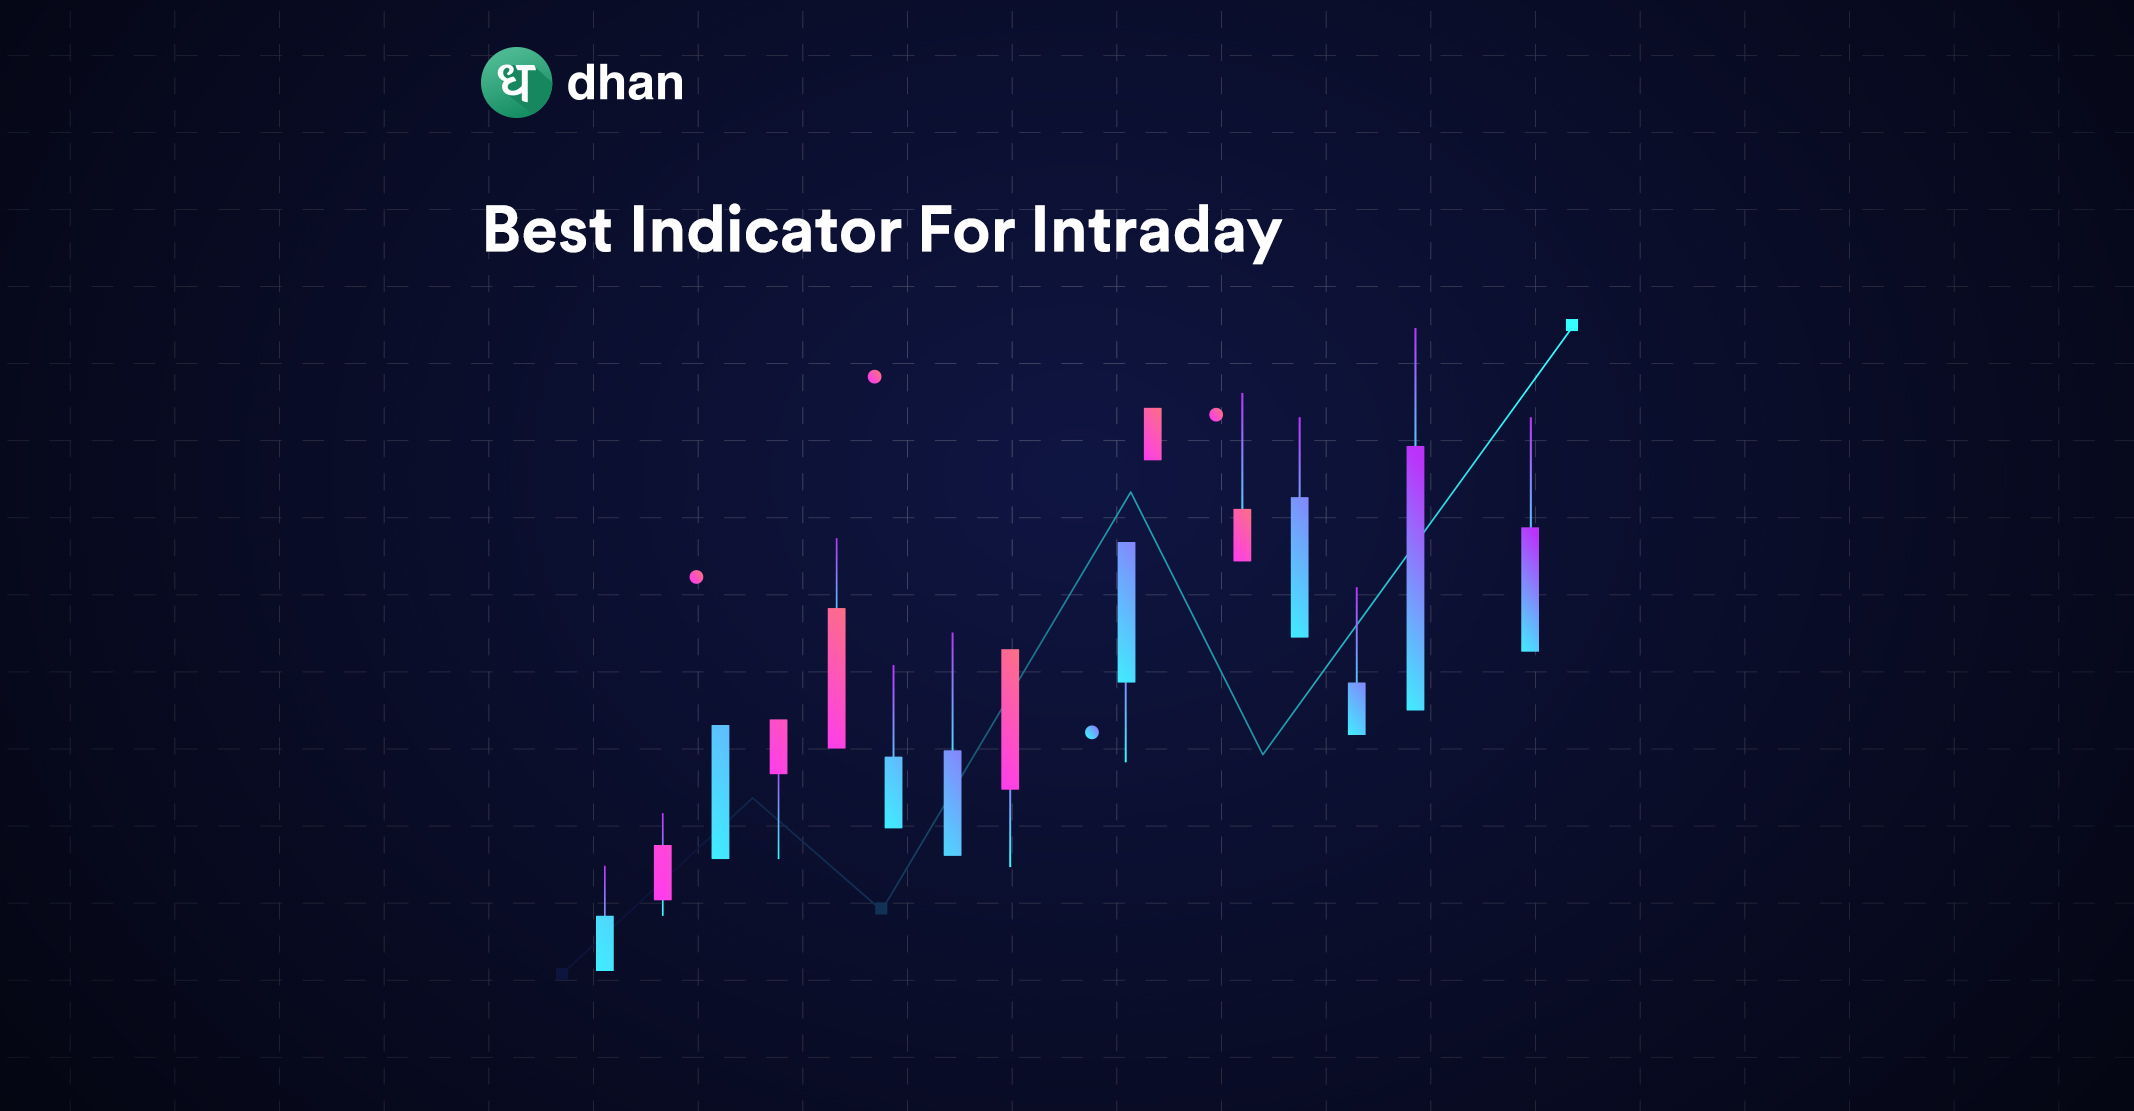
5 Best Indicators for Intraday Trading
There are plenty of indicators used for intraday trading and choosing one would be like searching for a needle in a haystack. To make your research easier, we’ve compiled a list of the most used day trading indicators.
1. Moving Average Convergence Divergence (MACD)
MACD is a technical indicator used to generate trading signals by identifying potential trends and reversals.
This is achieved by comparing two Exponential Moving Averages (EMAs), typically the 12-period EMA and 26-period EMA.
Your charting platform will subtract the 12-period EMA from the 26-period EMA to generate the MACD Line, and then smoothen this line by calculating a 9-period EMA leading to the “Signal Line”.
You’ll see a Histogram when selecting the MACD on charts, which is the result of subtracting the Signal Line from the MACD Line. The image below shows MACD in action on TradingView charts.

Why Use MACD for Intraday Trading
- Helps identify intraday price trends by providing signals based on the crossover of the MACD Line and Signal Line
- Fares well in volatile intraday markets because of its sensitivity to short-term price movements
- Generates signals in real time which can help day traders enter and exit positions quickly
- Divergence signals may imply that a potential reversal is on the horizon
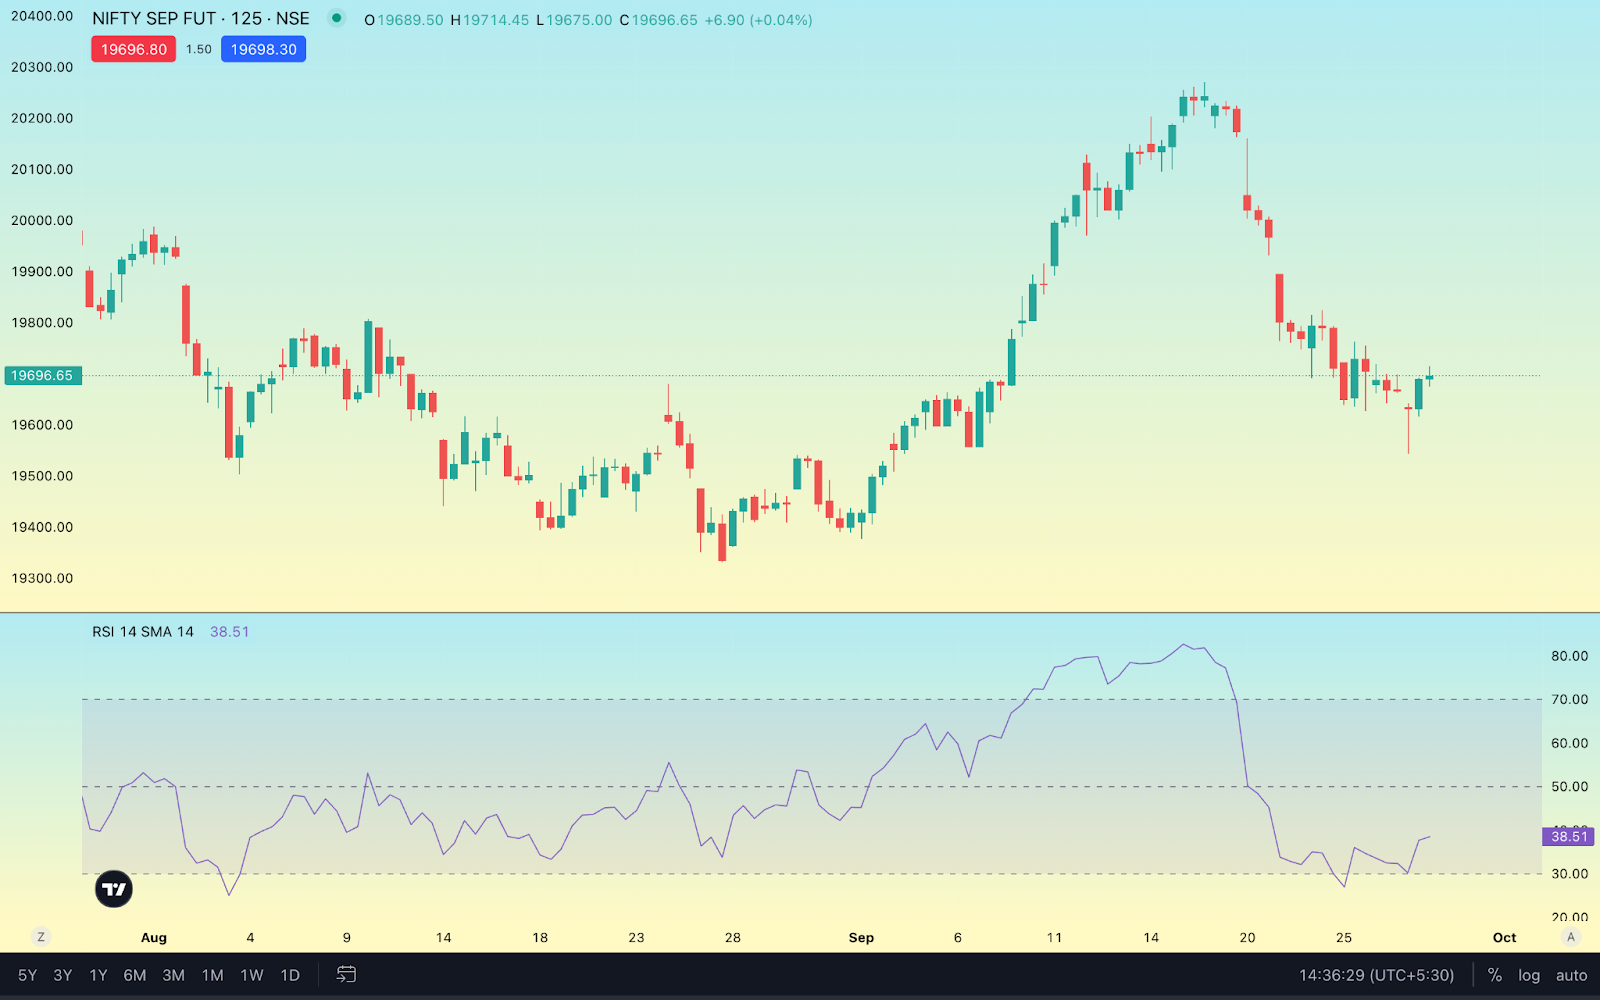
2. Relative Strength Index (RSI)
RSI is one of the best indicators for day trading because it helps identify if a stock is excessively bought or sold.
It is a momentum oscillator that allows a day trader to assess the strength and speed of price movements.
The value RSI generates is achieved by calculating the relative strength of an asset’s recent gains compared to its recent losses over a specified period, typically 14 periods.
This is shown on a signal line where the momentum value lies in the range of 0 to 100.
If the value of RSI is 70 or more, then it indicates the situation of overbuying. It tells that stock is valued more than its actual price.
If the value of RSI is 30 or less, then there is overselling and the stock is valued lower than its actual price.
Why Use RSI for Intraday Trading
- Helps intraday traders time their entry and exit points based on overbought and oversold levels
- Generates rapid, almost instant signals that can be specially useful during intense day trading markets
- Can determine potential reversals via divergences that can be used to adjust intraday trading strategies
- Can work on multiple timeframes, including short ones that are typically used by day traders
3. Bollinger Bands
Bollinger Bands are said to be the best indicator for intraday trading as they can help you analyze the range in which stock price can fluctuate over a period.
When you select Bollinger Bands on intraday charts, you’ll see three lines. One is the moving average line and the other two are bands (upper line and lower line).
These three lines are estimated using the standard deviation which tells you about how much stock can rise or fall from its average price.
If a stock is trading below its Bollinger Band, it’s a signal to consider buying the stock with the expectation of selling it at a higher price later. Essentially, it’s a bullish signal.
Conversely, if the stock is trading above the Bollinger Band, there is a risk that prices could decline in the future. It is a potential bearish signal.

Why Use Bollinger Bands for Intraday Trading
- Useful during volatile intraday markets as they expand during periods of high volatility and contract when volatility drops
- When the price either touches or crosses the upper Bollinger band, it is a sign that the asset is overbought
- When the price either touches or crosses the lower Bollinger band, it is a sign that the asset is oversold
- Can confirm the direction and strength of short-term trends
- A strong intraday uptrend is seen when the price is consistently above the middle Bollinger band with expanding bands
- A strong intraday downtrend is seen when the price is consistently below the middle band with expanding bands
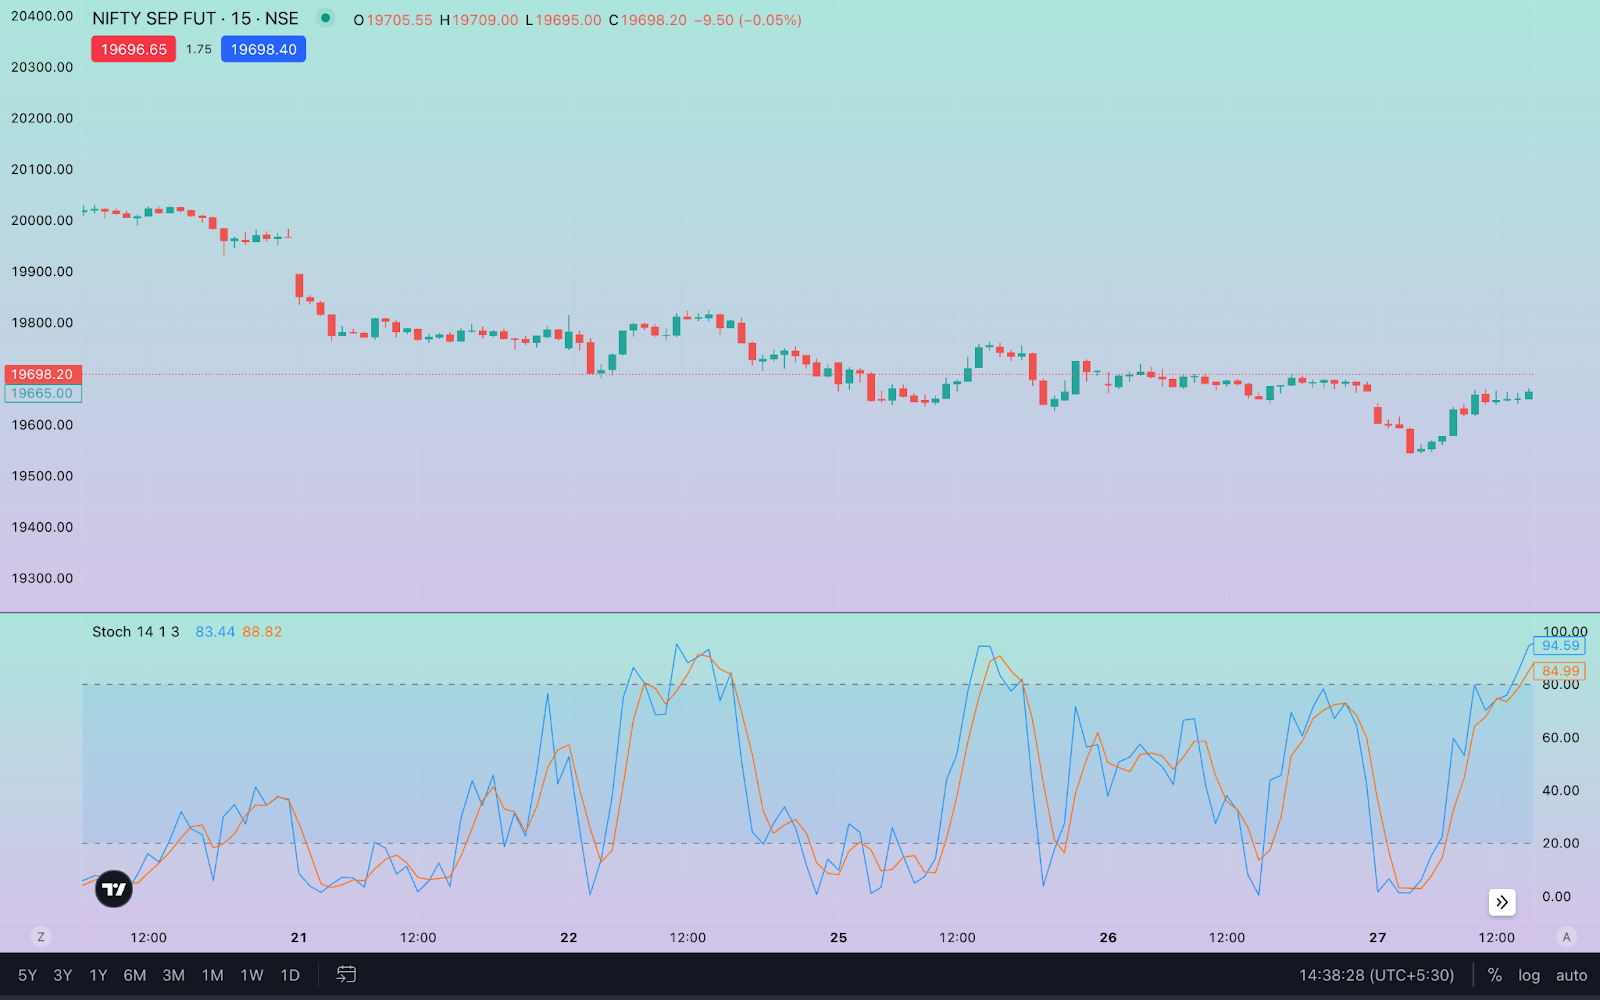
4. Stochastic Oscillator
The Stochastic Oscillator helps you identify overbought and oversold areas by comparing the closing price of an asset to the price range, typically a 14-day high and low prices.
There are, by the way, two versions of this indicator known as Fast and Slow Stochastics.
Both versions assess the relative position of an asset’s closing price within a specified price range. Either way, the value of this indicator always falls between 0 and 100.
If the value of this intraday indicator rises beyond 80, then it means the stock is overbought. If the value is below 20, then it is oversold.
It has 2 lines: one shows the value of the stochastic oscillator and the other shows the 3-day MA (Moving Average) of the first line.
If the first line (%K) crosses below the second line (%D), then the price can potentially fall in the future opposite to its previous trend.
Why Use Stochastic Oscillator for Intraday Trading
- Can be used in various short intraday timeframes (1-min, 5-min, 15-min)
- Being relatively sensitive to short-term price movements, the Stochastic Oscillator can confirm trends during intraday
- Crossovers of the %K and %D lines act as signals for potential entry and exit points
- When the Stochastic Oscillator’s direction does not resemble the price of the stock or asset, it means that the existing trend is weakening and may even reverse
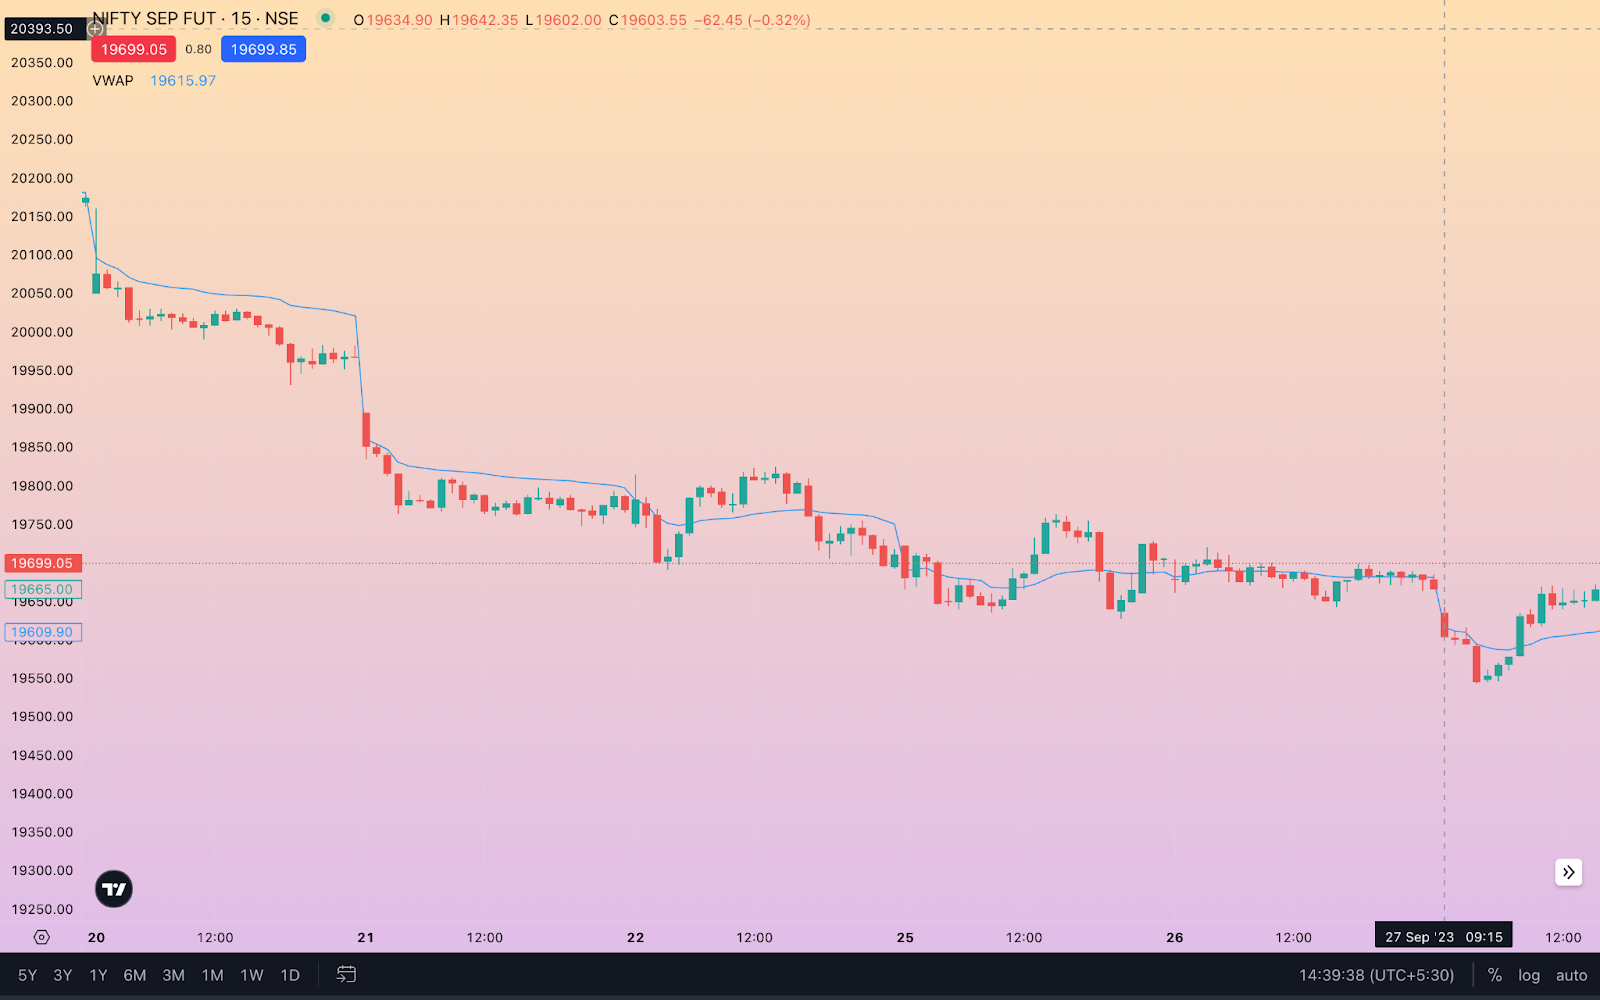
5. Volume Weighted Average Price (VWAP)
Last but not least on the list of best indicators for day trading is VWAP. It helps you assess a stock’s liquidity and can even extend to price behavior.
VWAP works by calculating the average price of a stock over a specific time period, weighted by the volume traded during that time.
If a stock is currently trading below its VWAP, it may be considered undervalued. This is a potential buy signal.
If a stock is trading above its VWAP, it may be overvalued. This is a potential sell signal.
Why Use VWAP for Intraday Trading
- If the intraday price price is above the VWAP, it indicates a bullish bias
- If the intraday price price is below the VWAP, it indicates a bearish bias
- It is regarded as a benchmark for fair value
How to Select the Best Indicator for Intraday?
There is no sure-shot way to select the best indicator for intraday. It depends on your trading style, goals, and current market situation.
MACD helps you identify the momentum in the stock whereas RSI and stochastic oscillator helps you identify the stocks that are sold and bought over and above the normal situation.
Bollinger Bands helps you analyze the price fluctuations whereas VWAP helps in analyzing liquidity and price movement of a stock.
Thus, the best way forward is to analyze your trading preferences, goals, and existing market conditions to decide which intraday indicator is most suitable for you for a particular market period.
Ask yourself questions such as…
- Am I looking for trend-following or reversal signals?
- Should I focus on momentum, volatility, or both?
- Trading fast or slow – what’s best for me?
- Is the market liquid or not?
- Can I dedicate more time to monitoring markets?
Introspecting in this way will help you narrow down the best indicators for intraday as they relate to you and your approach.
Conclusion
You need to be precise as an intraday trader and the best day trading indicators listed above can help you achieve that precision.
Indicators like MACD, RSI, Bollinger bands, Stochastic Oscillator, and VWAP reveal more than just potential entry and exit points – they are windows into market psychology.
That said, the best indicator for intraday is the one that helps you reach your trading goals as per your choice and analysis. Thus, you must look within first before deciding on any indicator for day trading.
More intraday trading blogs: