For intraday trading, choosing the best indicators is crucial to achieve success. These technical indicators provide invaluable insights into market trends, momentum, and potential entry or exit points.
In this guide, we’ll explore the best technical indicators for day trading that can help you make informed decisions and potentially increase your chances of success as a day trader.
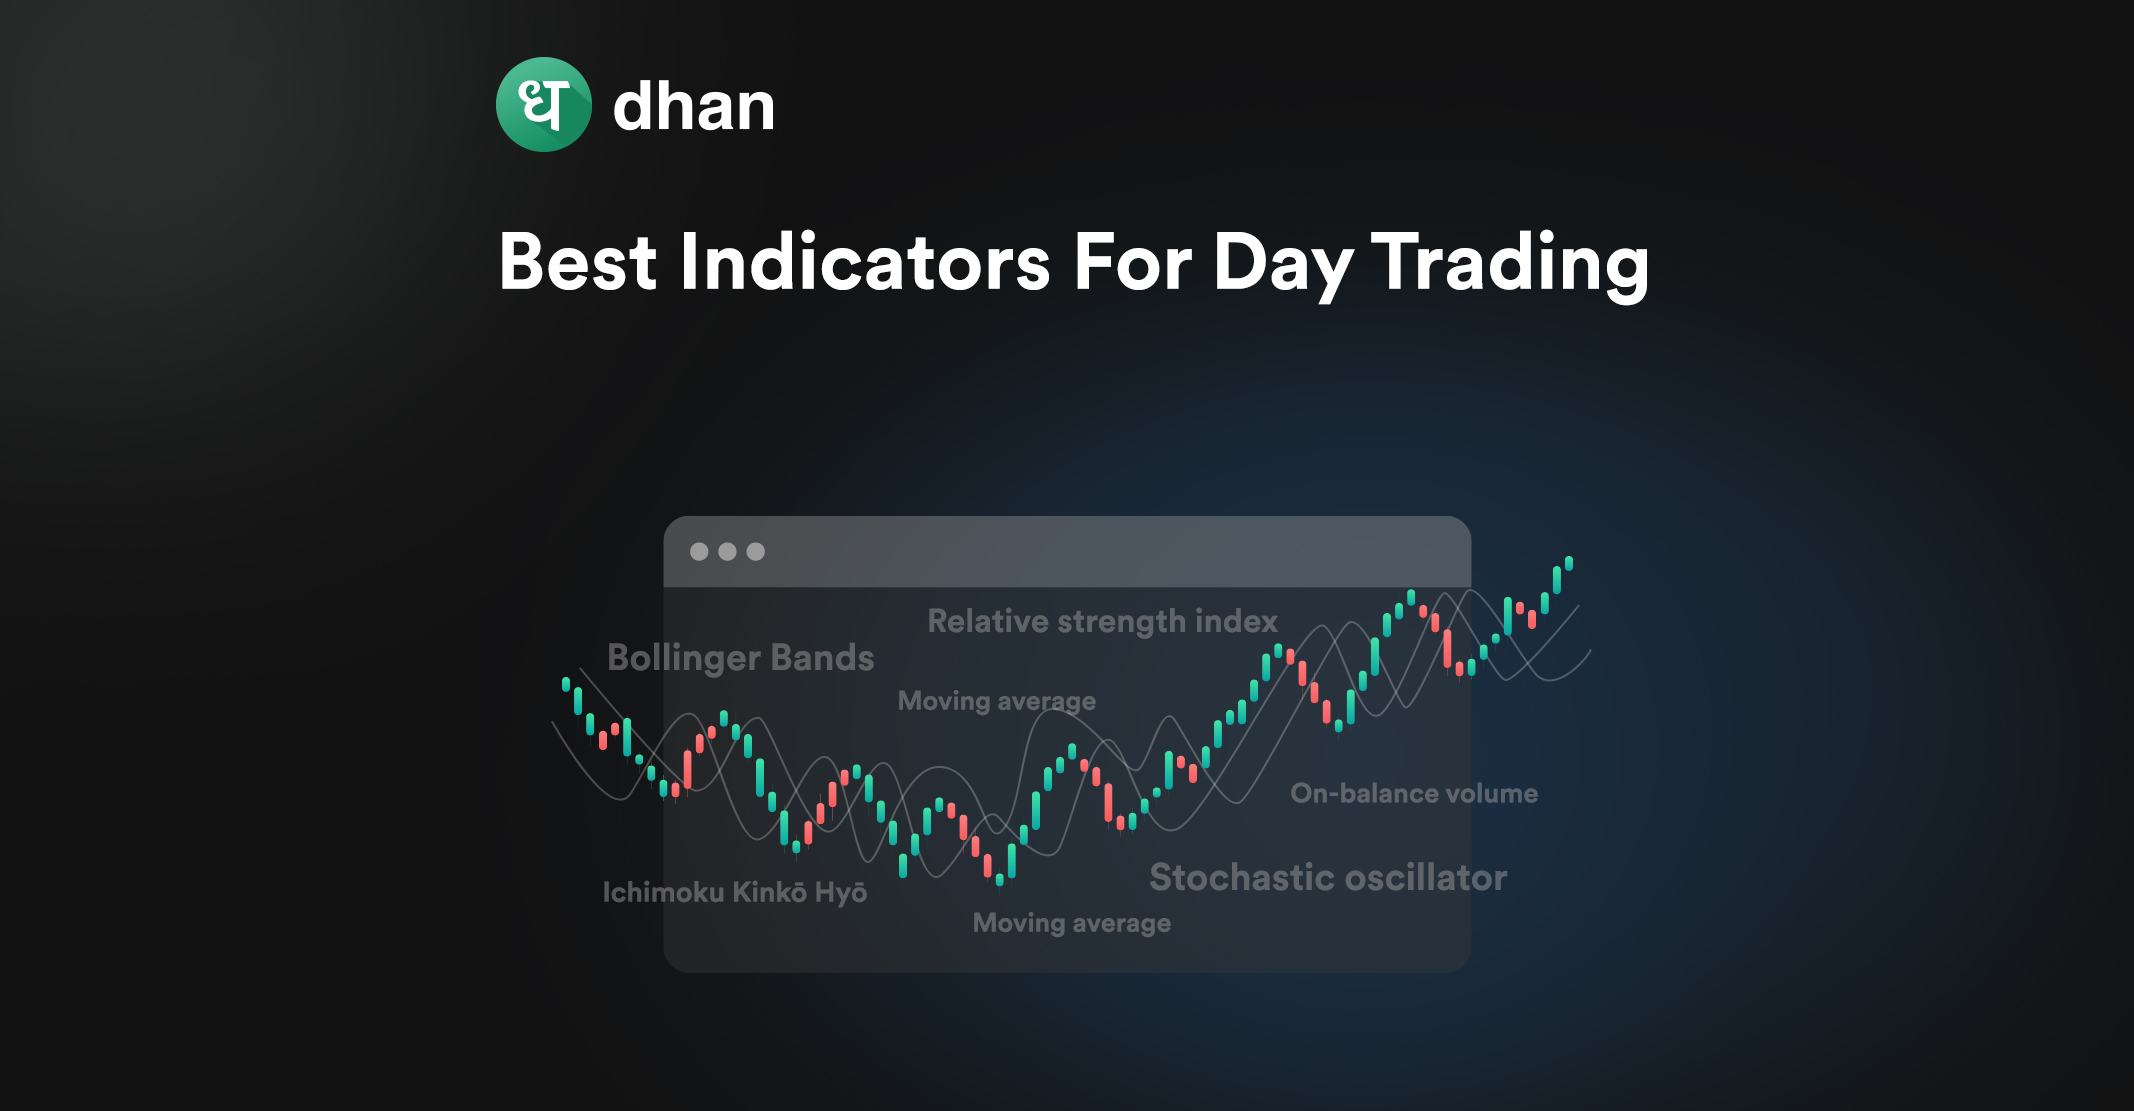
Top 5 Best Indicators for Day Trading
Day trading requires quick decisions and a keen eye for market trends. To succeed, you need the best indicators for day trading. Here are some effective ones:
- Moving Averages
- Relative Strength Index (RSI)
- Bollinger Bands
- Moving Average Convergence Divergence (MACD)
- Stochastic Oscillator
1. Moving Averages
Moving Averages are essential day trading tools. Simple Moving Averages (SMA) and Exponential Moving Averages (EMA) help you spot trends by smoothing out price data over a specified period.
SMAs provide a straightforward average, while EMAs assign more weight to recent prices.
When prices cross above or below these averages, it signals potential trend shifts, guiding you in making timely buy or sell decisions.
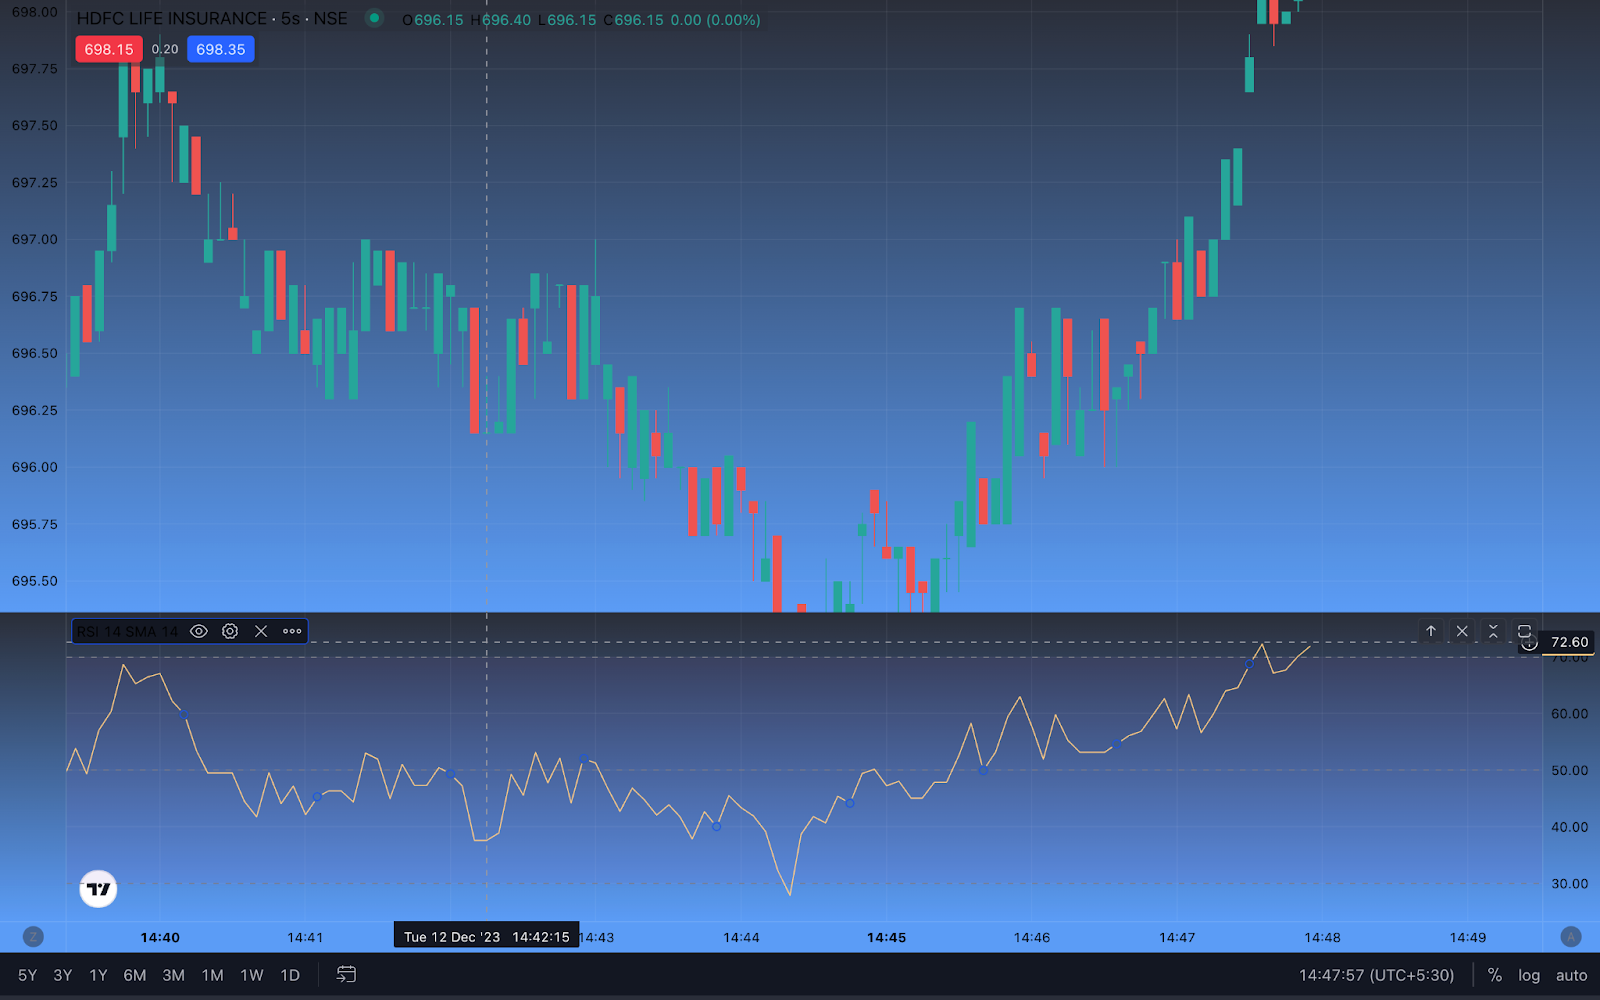
2. Relative Strength Index (RSI)
The Relative Strength Index is a momentum indicator that assesses the speed and magnitude of price changes in a financial asset. It quantifies overbought or oversold conditions on a scale of 0 to 100.
RSI values above 70 suggest an asset may be overbought and due for a potential reversal, while values below 30 indicate oversold conditions and a possible upward price correction. RSI can help you identify entry and exit points.
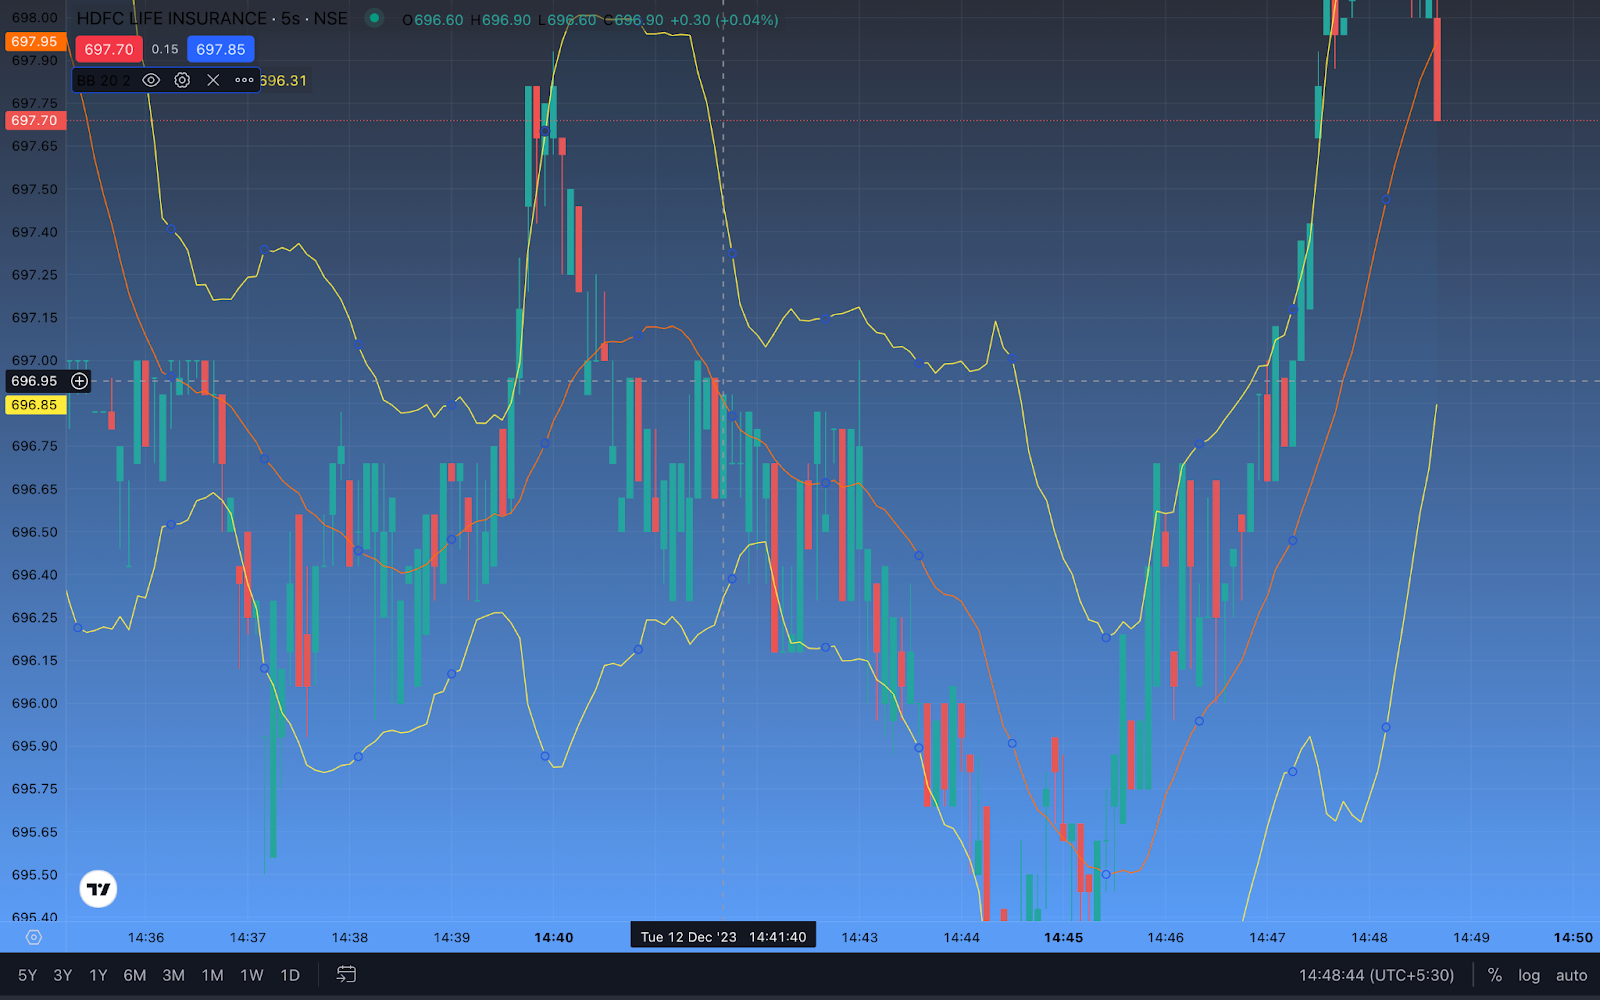
3. Bollinger Bands
Bollinger Bands are a valuable tool in day trading. They consist of three lines on a price chart: a middle band (usually a Simple Moving Average), and two outer bands that represent standard deviations from the middle band. The bands expand and contract with market fluctuation.
When prices approach the outer bands, it suggests increased volatility and potential breakout or reversal points, aiding you in making informed trading decisions. This is another one of the best technical indicators for day trading.
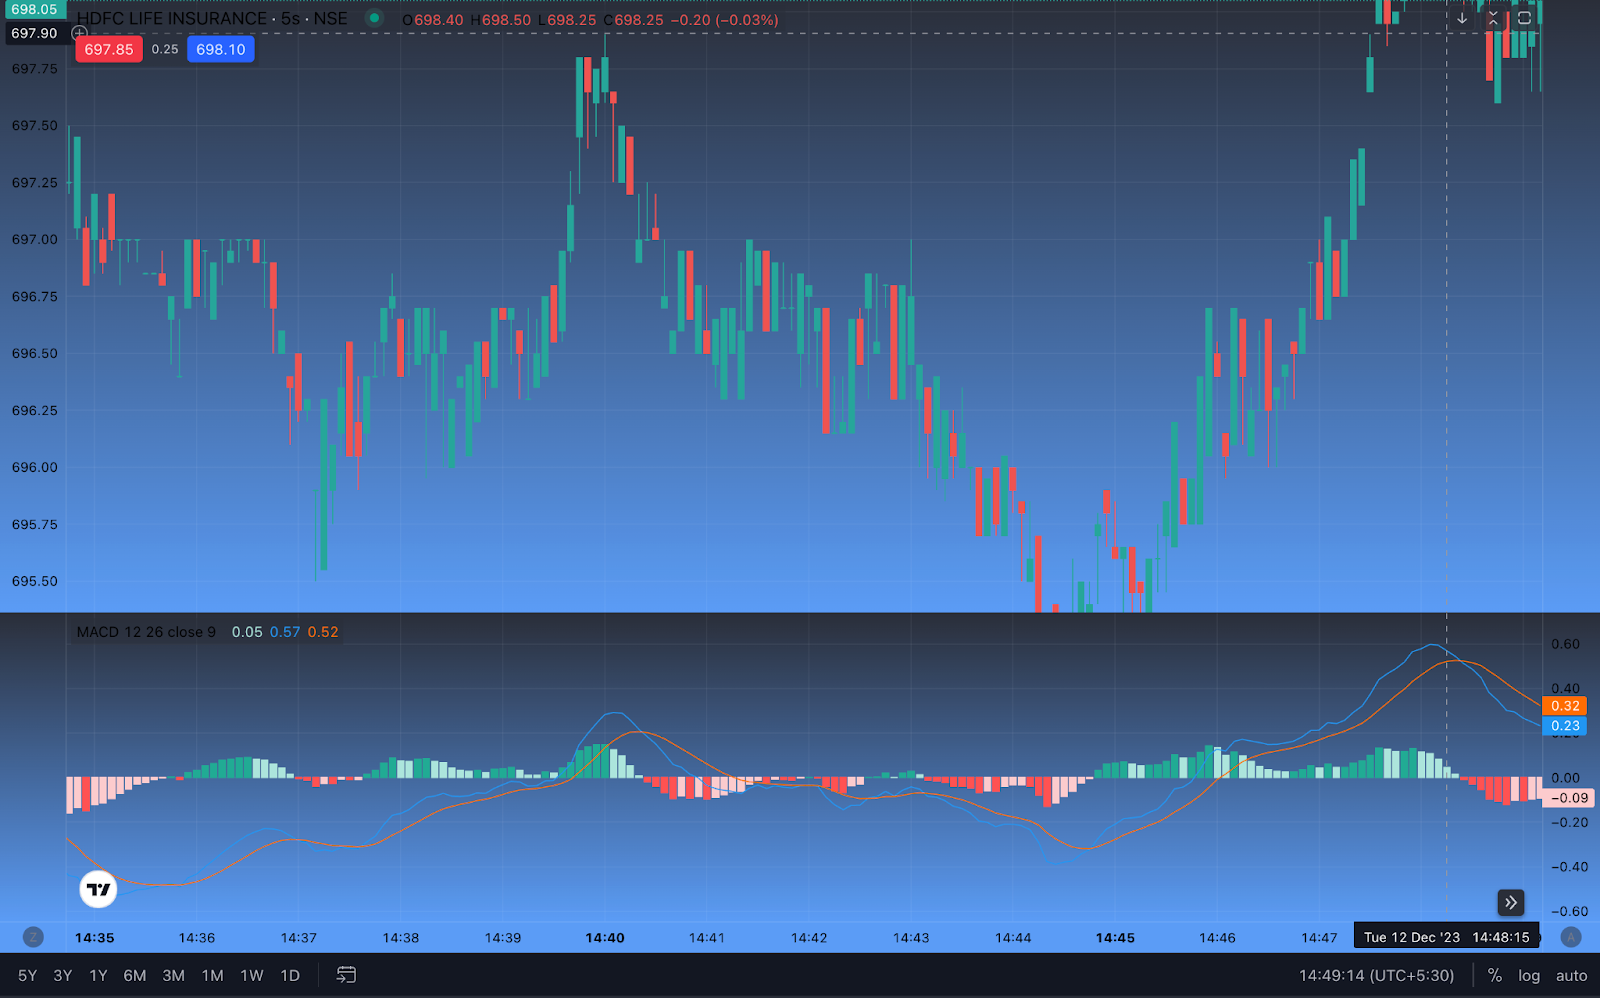
4. Moving Average Convergence Divergence (MACD)
The Moving Average Convergence Divergence (MACD) is a powerful indicator. It combines two moving averages to help you gauge a stock’s strength and momentum.
When the MACD line crosses above the signal line, it signals a potential bullish trend, while a cross below suggests a bearish trend. MACD assists you in identifying key entry and exit points for trades.
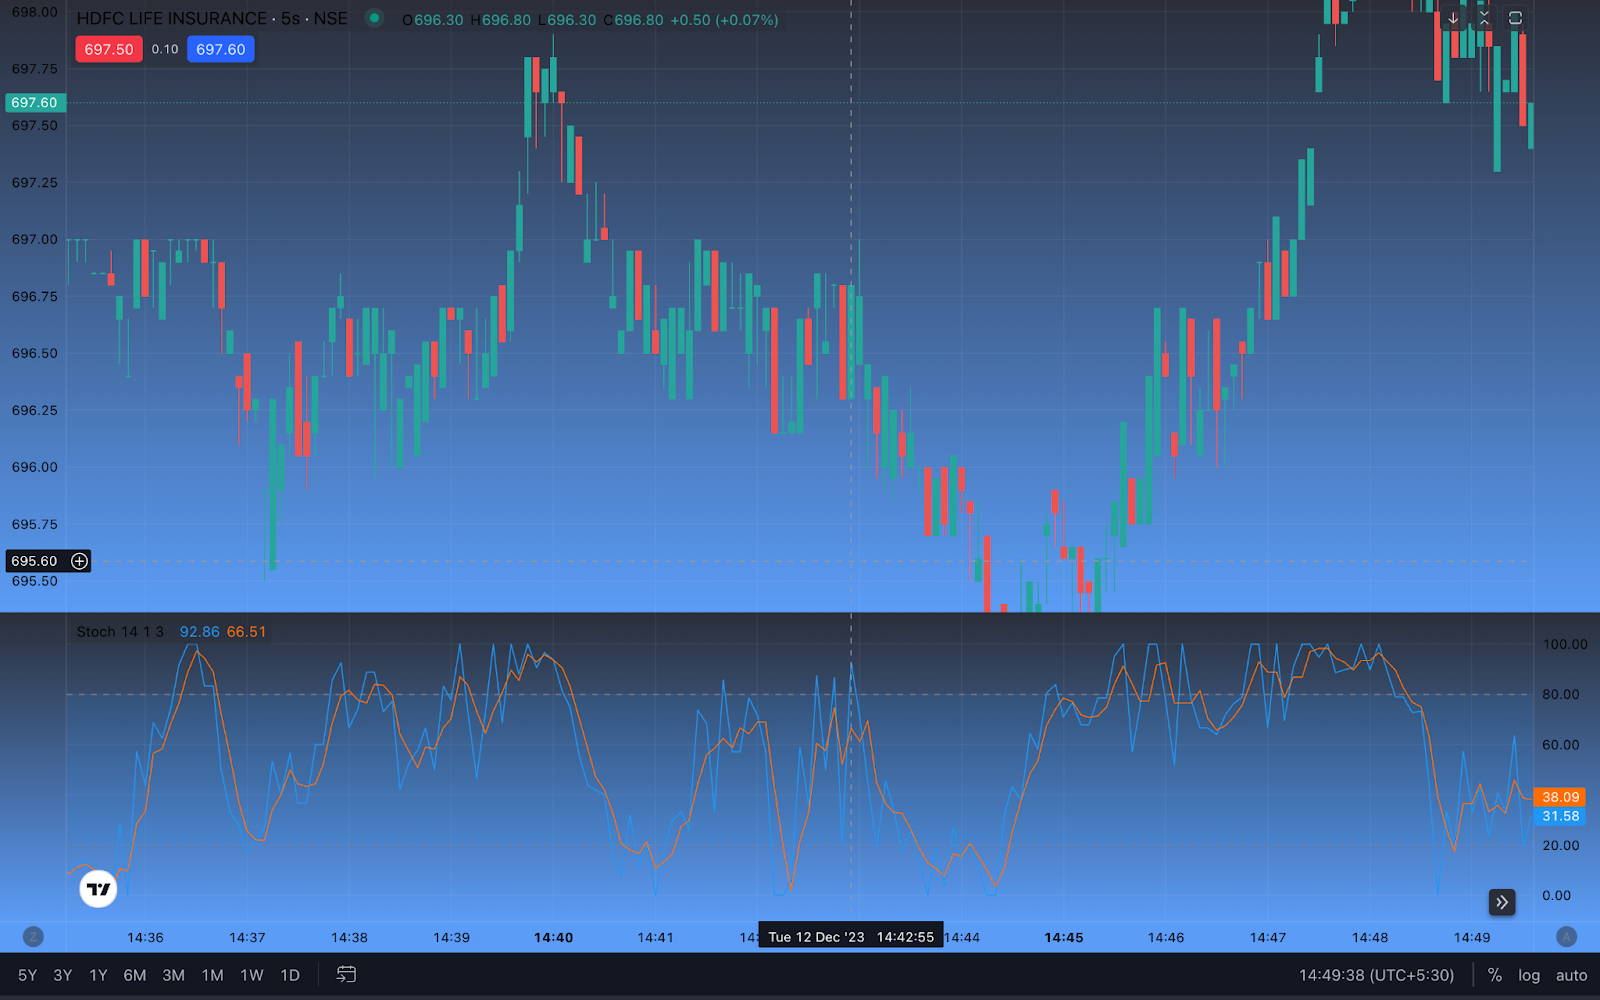
5. Stochastic Oscillator
The Stochastic Oscillator helps you gauge a stock’s momentum. It assesses whether the current closing price is near the high or low range over a specified period, typically 14 periods.
When the indicator crosses above 80, it suggests the asset may be overbought, signaling a potential sell opportunity.
Conversely, a reading below 20 indicates potential oversold conditions, suggesting a buying opportunity may be on the horizon.
Day Trading Strategies with Indicators
Day trading strategies often incorporate a mix of technical indicators to make informed decisions in fast-moving markets. Here are three popular strategies using indicators:
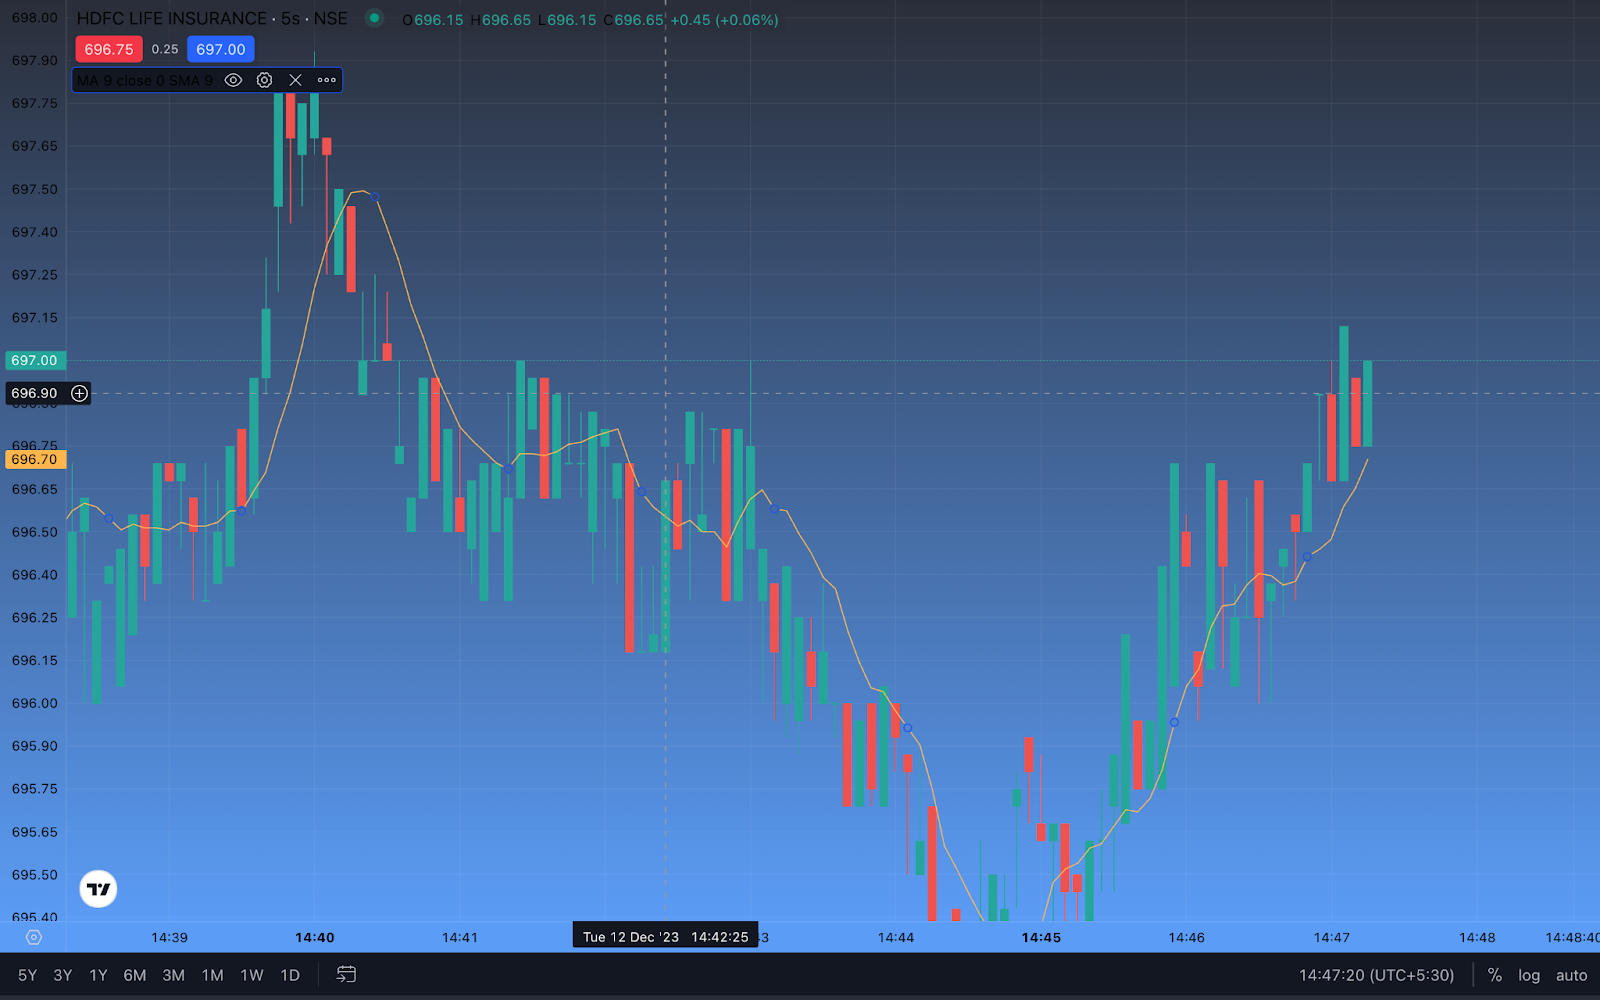
1. Moving Average Crossovers
The Moving Average Crossovers Crossover strategy involves using two moving averages: a short-term (e.g., 9-period) and a long-term (e.g., 21-period).
When the short-term moving average crosses above the long-term moving average (Golden Cross), it suggests a potential uptrend, signaling a buy opportunity.
Conversely, when the short-term moving average crosses below the long-term moving average (Death Cross), it indicates a potential downtrend, signaling a sell opportunity.
This strategy aims to capitalize on trend changes based on moving average relationships.
2. Bollinger Bands Breakout
The Bollinger Bands Breakout strategy relies on Bollinger Bands, which consist of a middle (SMA) and two outer bands that represent volatility. When the bands contract (narrow), it indicates low volatility, often preceding a significant price move.
Buy when the price breaks above the upper band, suggesting a potential uptrend, and sell when it breaks below the lower band, indicating a possible downtrend.
This strategy aims to capture price movements following periods of consolidation or low volatility.
3. RSI and MACD Divergence
The RSI and MACD Divergence strategy involves using two indicators to identify potential trend reversals.
Watch for bullish divergence: when the Relative Strength Index (RSI) forms higher lows while the Moving Average Convergence Divergence (MACD) forms lower lows. This suggests a weakening downward momentum and a possible reversal.
Consider entering a buy position when this divergence occurs, but always confirm with other indicators and risk management techniques before executing a trade.
Why Technical Indicators are Important for Day Traders
Technical indicators are crucial for day traders because they help you:
- Spot Trends: Indicators like moving averages help you see if prices are going up or down.
- Identify Entry Points: They pinpoint particular periods to buy or sell.
- Manage Risk: Indicators can show when it’s smart to stop a trade or set stop-loss levels.
- Confirm Patterns: They validate chart patterns like head and shoulders or double tops.
- Stay Informed: Indicators offer data-driven insights for informed trading decisions in fast-paced markets.
Conclusion
Selecting the best indicators for day trading is a crucial aspect of success in the fast-paced world of trading.
A combination of technical and fundamental indicators tailored to your trading strategy can provide valuable insights. Remember to conduct your research and be persistent.
More blogs: