Trading is all about patterns that form on charts and prices. Each pattern has something to reveal about an upcoming or ongoing trend. The bullish engulfing pattern is one such effective pattern.
Meaning of the Bullish Engulfing Pattern
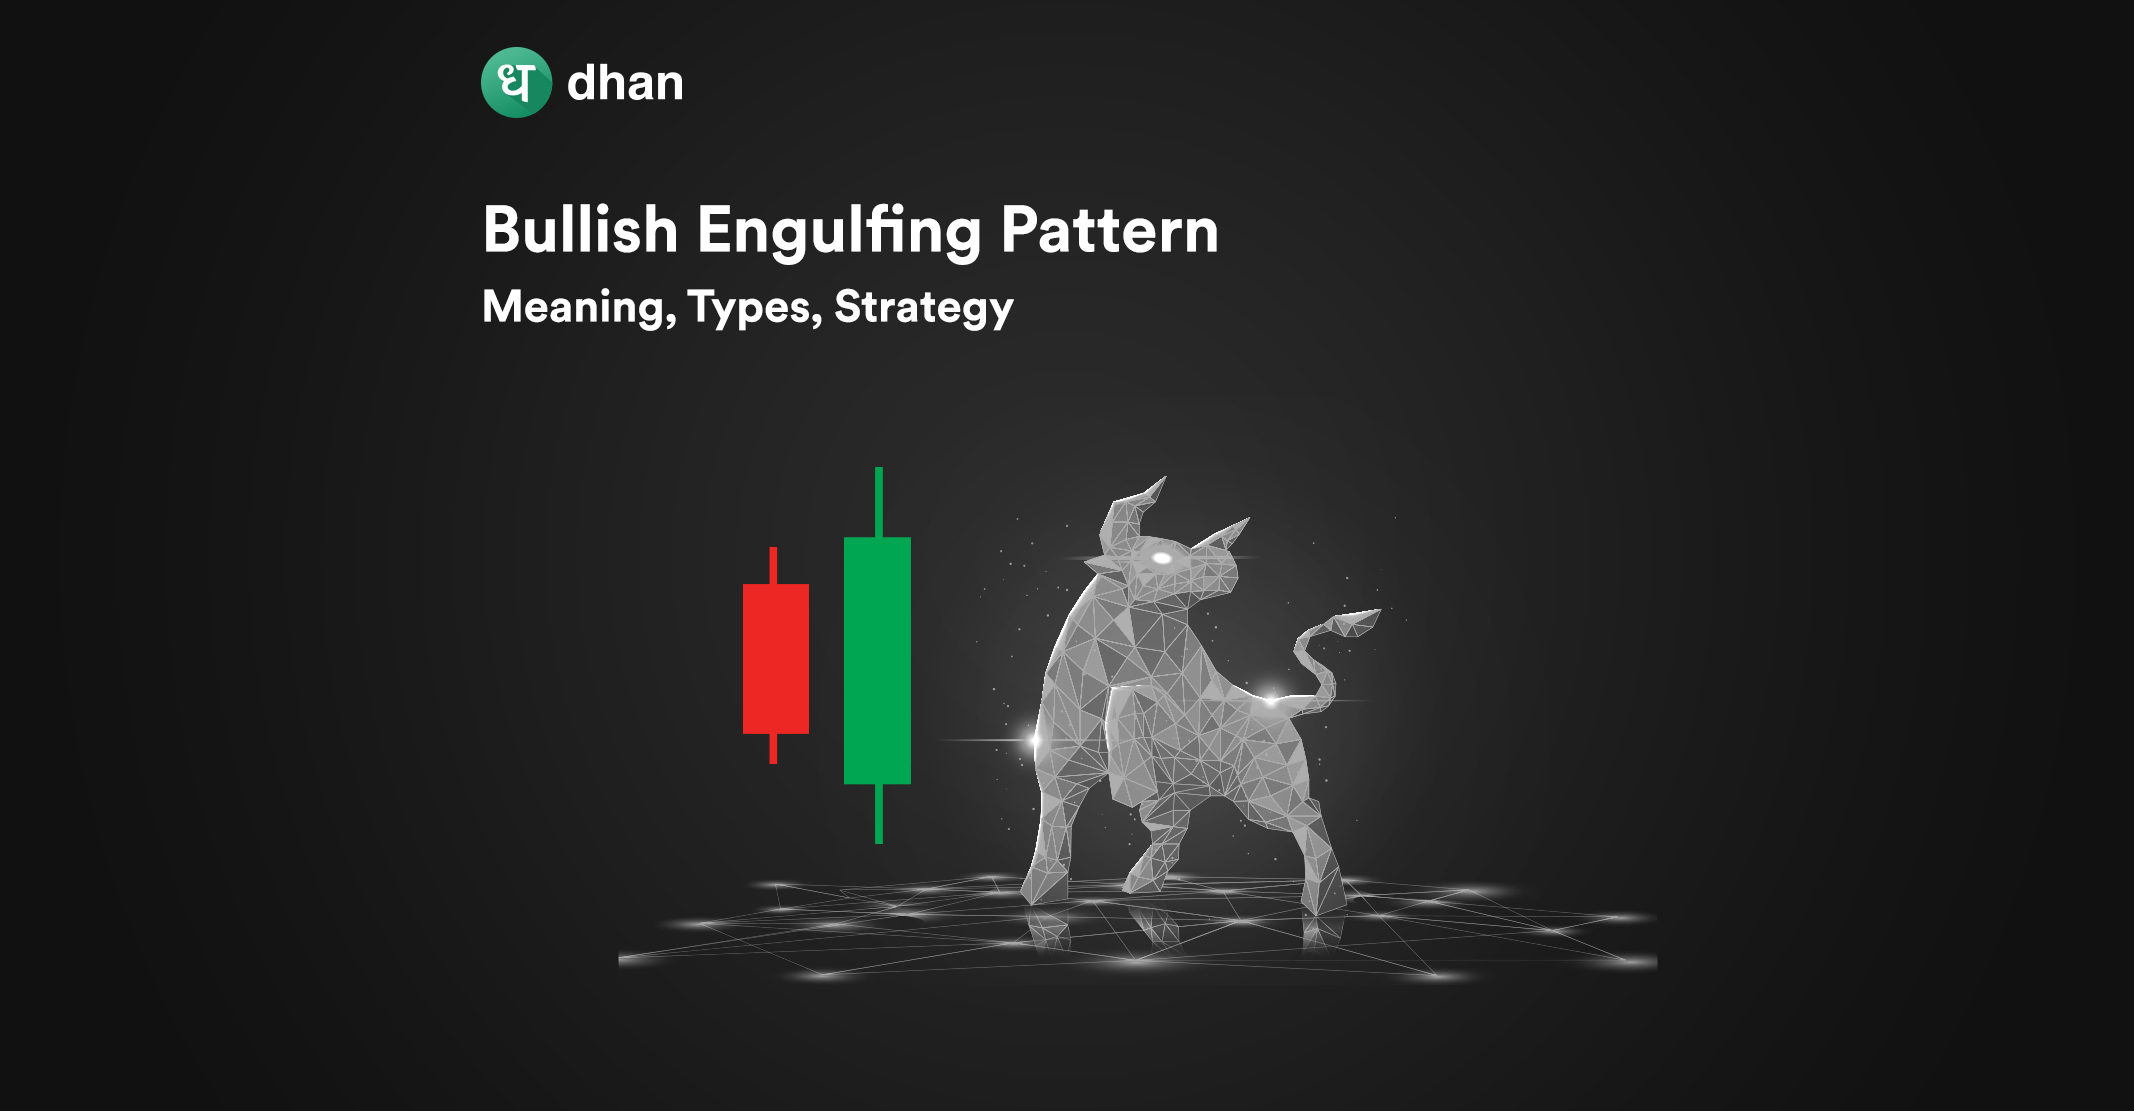
A bullish engulfing pattern is a type of candlestick pattern made of two candles – a small bearish candle and a large bullish candle.
The bullish candle towers over the bearish candle, hence the word “engulfing”.
In fact, the bullish candle’s open is lower than the bearish candle’s open, and its close is higher than the bearish candle’s close.
This engulfing pattern is followed by a reversal in the prevailing bearish trend, meaning buyers take control of the prices and push it up.
Traders view the bullish engulfing candlestick pattern as a trading signal to go long or buy more, assuming that the price of the security will continue to move upwards.
You can identify the pattern without any technical indicators, but it is necessary to trade the bullish engulfing signals using thorough technical analysis on charts.
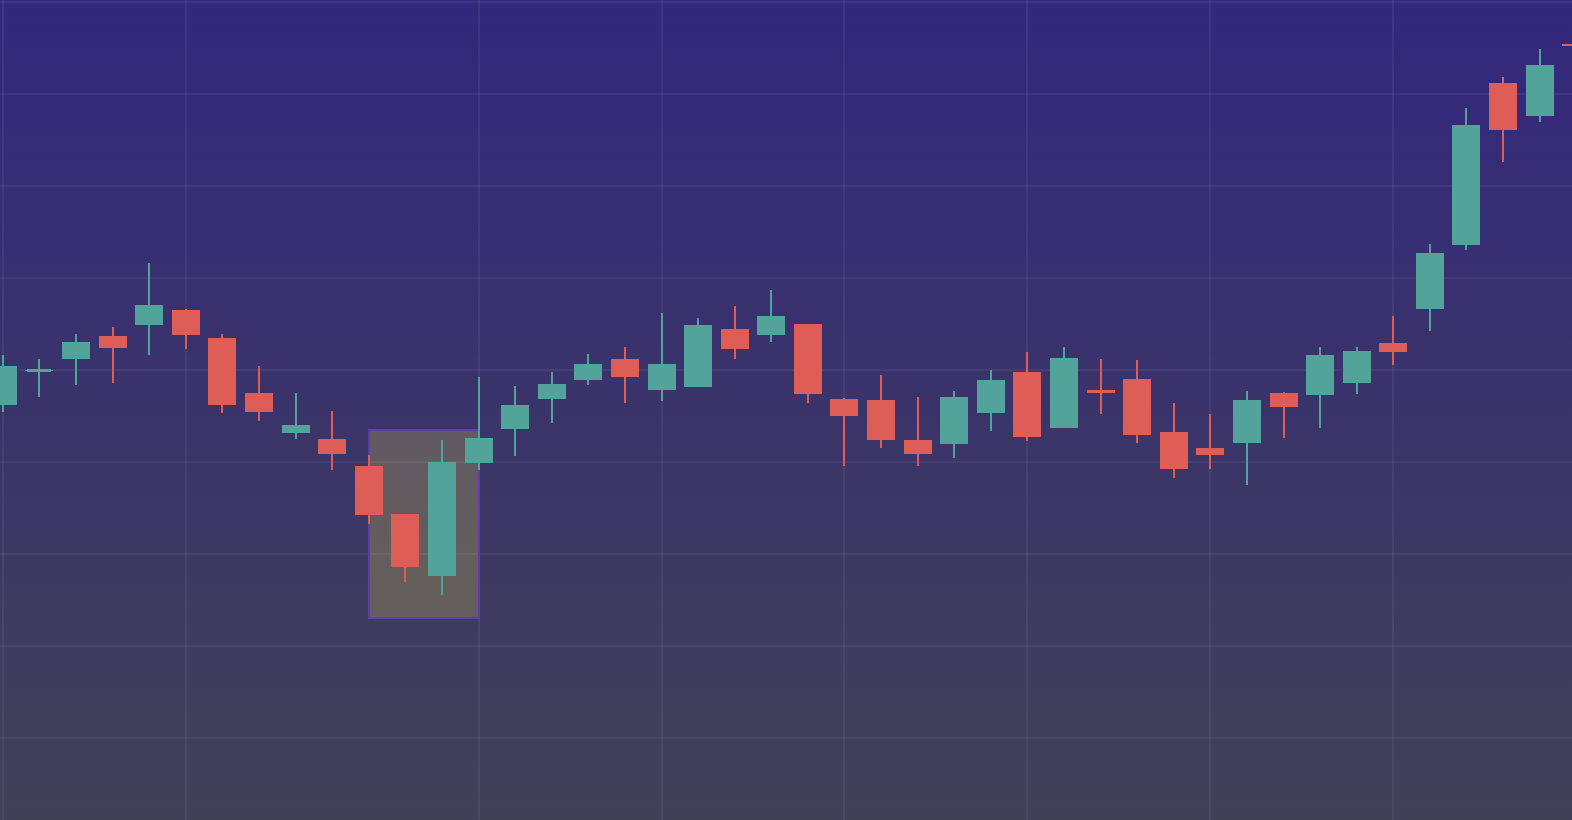
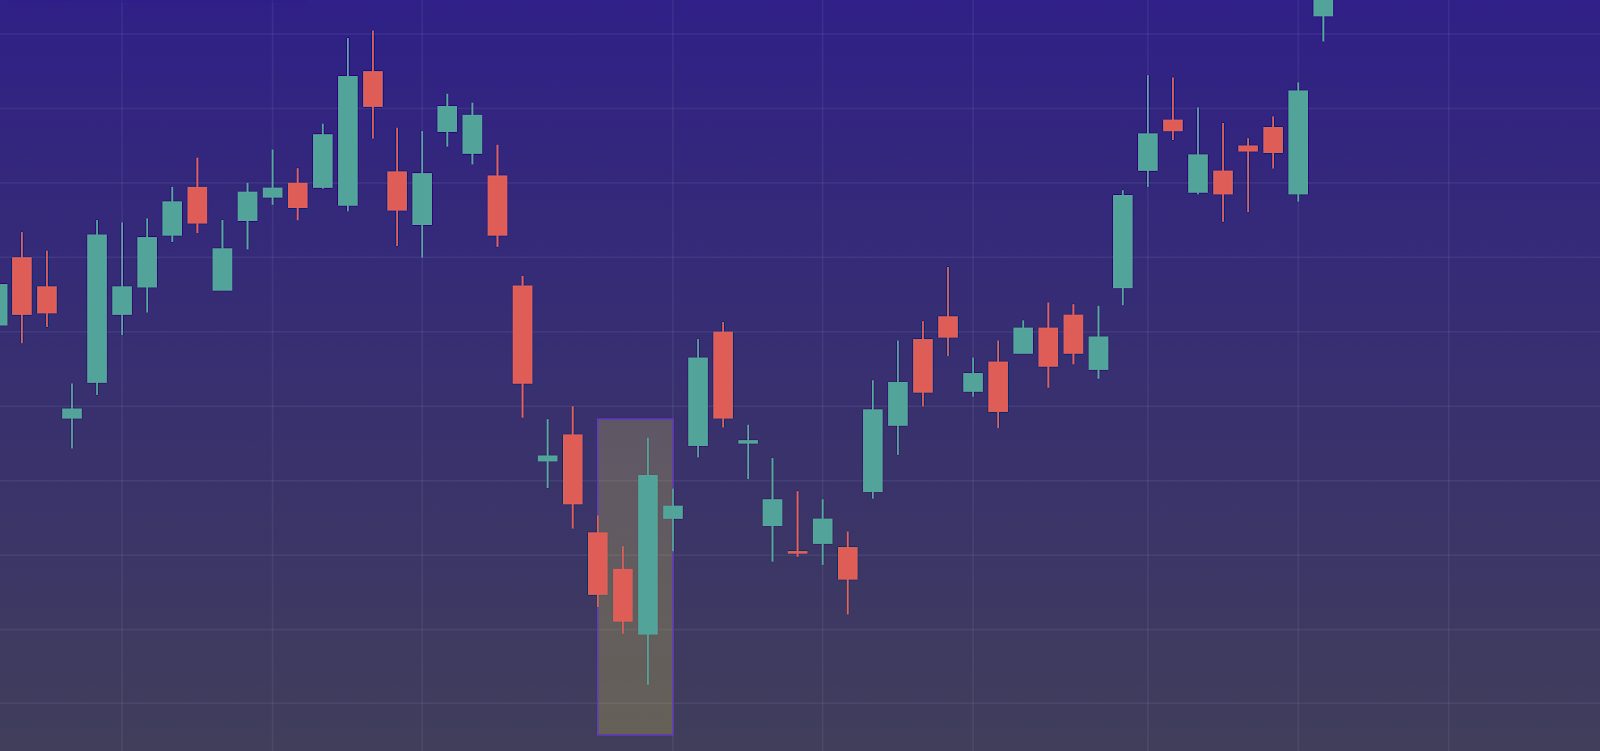
Want to know what the bullish engulfing pattern looks like? Check out the image below!
How to Find Bullish Engulfing Pattern?
So far, we’ve discussed the broad basics of the bullish engulfing pattern, right from what it is to how it looks.
Below are some points that you must keep in mind to find a bullish engulfing candlestick pattern.
- The downtrend should be clearly visible and well-established.
- The downtrend should be steep and not accompanied by any significant uptrend.
- At the bottom of the downtrend, there should be a small red (bearish) candle.
- Immediately after the red candle, a green (bullish) candle should form and completely engulf the red candle.
- The high of the green candle should exceed the high of the red candle, and the low should be lower than the low of the red candle.
If the above setup forms, and there is strong price action visible to you, then you can plan your strategy around the bullish engulfing candlestick pattern.
That said, the candlestick patterns can generate false signals due to erratic market behavior sometimes.
What you need to know is that the hypothesis the candle is built upon may not be robust, mainly due to short-term noise and false signals.
Trading Strategies for Bullish Engulfing Pattern
Now that you know how this type of engulfing pattern works, it’s time to move on to trading the pattern. We’ll start from the start and help you work through the entire process.
1. Identify the Pattern
The bullish engulfing pattern is visible much more clearly on higher timeframes. Traders typically use 1 day or even 1-week charts to confirm this pattern and the subsequent trading signal.
2. Create an Entry Strategy
Once your trading setup confirms the bullish engulfing pattern, then you can plan to go long in the security.
Confirmation before entry is key to any trade. If you are risk-averse, then you can wait for the confirmation for a couple of days more to confirm the uptrend.
3. Define Your Exit Strategy
After you take a long position post the confirmation of the formation of a bullish engulfing pattern, you can devise your own exit strategy.
Generally the next resistance level (level at which the stock price tops), RSI (indicator indicating overbought or oversold status), or any moving averages can be used. You can also use your own setup to exit the position.
The key to strategizing the bullish engulfing pattern is to look for the clear formation of the pattern without the noise and exit it based on the pre-established indicator. This will help you understand how to trade bullish engulfing pattern.
Limitations and False Signals for Bullish Engulfing Pattern
The bullish engulfing pattern does not necessarily give you a price target. After you identify a potential candle, you need to choose the risk-reward according to your set-up.
This makes it somewhat complicated since any potential false signal or misinterpretation can make the trading setup void.
As a result, you have to use other indicators or trend analysis to complement the trade and determine a price target and exit strategy.
While bullish engulfing is a widely used pattern, there can be many positions to exploit the arbitrage opportunity and thus the profit potential of using this pattern can be limited in some cases.
You need to be nimble to take advantage of the pattern before it disappears. The earlier the indication of the pattern, the higher the profit potential can be.
Best Options Trading Chart Patterns
Bullish Vs Bearish Engulfing Pattern
As it sounds, you might have guessed it right. This is the inverse of the bullish engulfing pattern. Here, the second candle is the bearish candle and engulfs the previous day’s bullish candle.
The red candle forms at the top of the uptrend and bears are aggressive, defying the ongoing uptrend.
The bearish candle opens above the previous candle’s close and closes below the previous candle’s opening.
The length of the bearish candle is such that the previous day’s bullish candle is fully engulfed in it and is a strong signal for reversal.
| Aspect | Bullish Engulfing Pattern | Bearish Engulfing Pattern |
| Formation | Large bullish candle formed after a small bearish candle. | Large bearish candle formed after a small bullish candle. |
| Candle Colors | Red bearish candle followed by a green bullish candle. | Green bullish candle followed by a red bearish candle. |
| Engulfing | Bullish candle engulfs the entire body of the bearish candle. | Bearish candle engulfs the entire body of the bullish candle. |
| Trend Reversal Signal | Potential reversal from a downtrend to an uptrend. | Potential reversal from an uptrend to a downtrend. |
| Market Sentiment Shift | Buyers gaining control over sellers. | Sellers gaining control over buyers. |
| Confirmation | Higher volume on the bullish candle strengthens the pattern. | Higher volume on the bearish candle strengthens the pattern. |
| Strength of Signal | A larger engulfing candle indicates a stronger reversal signal. | A larger engulfing candle indicates a stronger reversal signal. |
Conclusion
Bullish engulfing is widely used by traders across the markets. As these patterns are formed by analyzing previous candles – the more robust the previous downtrend, the more efficient the engulfing pattern.
You can use this pattern in any time frame like 5 mins, 15 mins, 1 day, 1 month, or even for longer time frames. However, the pattern is used extensively in shorter time frames.
Like this blog? Then you’ll love these:
- Ascending Triangle Pattern: Meaning, Breakout, Strategy
- Whipsaw in Trading
- Awesome Oscillator Indicator
FAQs
1. What is bullish engulfing pattern?
Bullish engulfing patterns span over a period of two days in which a green candle covers the previous day’s candle. It suggests that the bulls will take over the market.
2. How do you confirm a bullish engulfing pattern?
You can confirm the formation of a bullish engulfing pattern on the second trading day when a bullish candle covers the previous day’s bearish candle and it closes higher than the last trading day’s closing price.
3. How reliable is bullish engulfing?
The bullish engulfing pattern is a relatively reliable candlestick pattern when it forms during a bearish period and the second trading day shows a gap-up or higher opening price. However, this or any other pattern should be complemented by multiple indicators.
4. How do you use bullish engulfing?
You can use a bullish engulfing pattern to identify trend reversals. A potential strategy includes going long when the pattern forms, then placing stop-loss below the engulfing candle, and buying/selling according to the movement.
5. What is the correct engulfing pattern?
A correct engulfing pattern is composed of a larger bullish candle that fully engulfs or towers over the previous smaller bearish candle, leading to a reversal in the trend.