If you’ve been reading our technical indicator blogs, you’d notice that most of them either appear as histograms, a single line, or multiple lines. But the Gann Fan indicator is a technical analysis tool that uses geometric angles to determine potential breakouts and reversals.
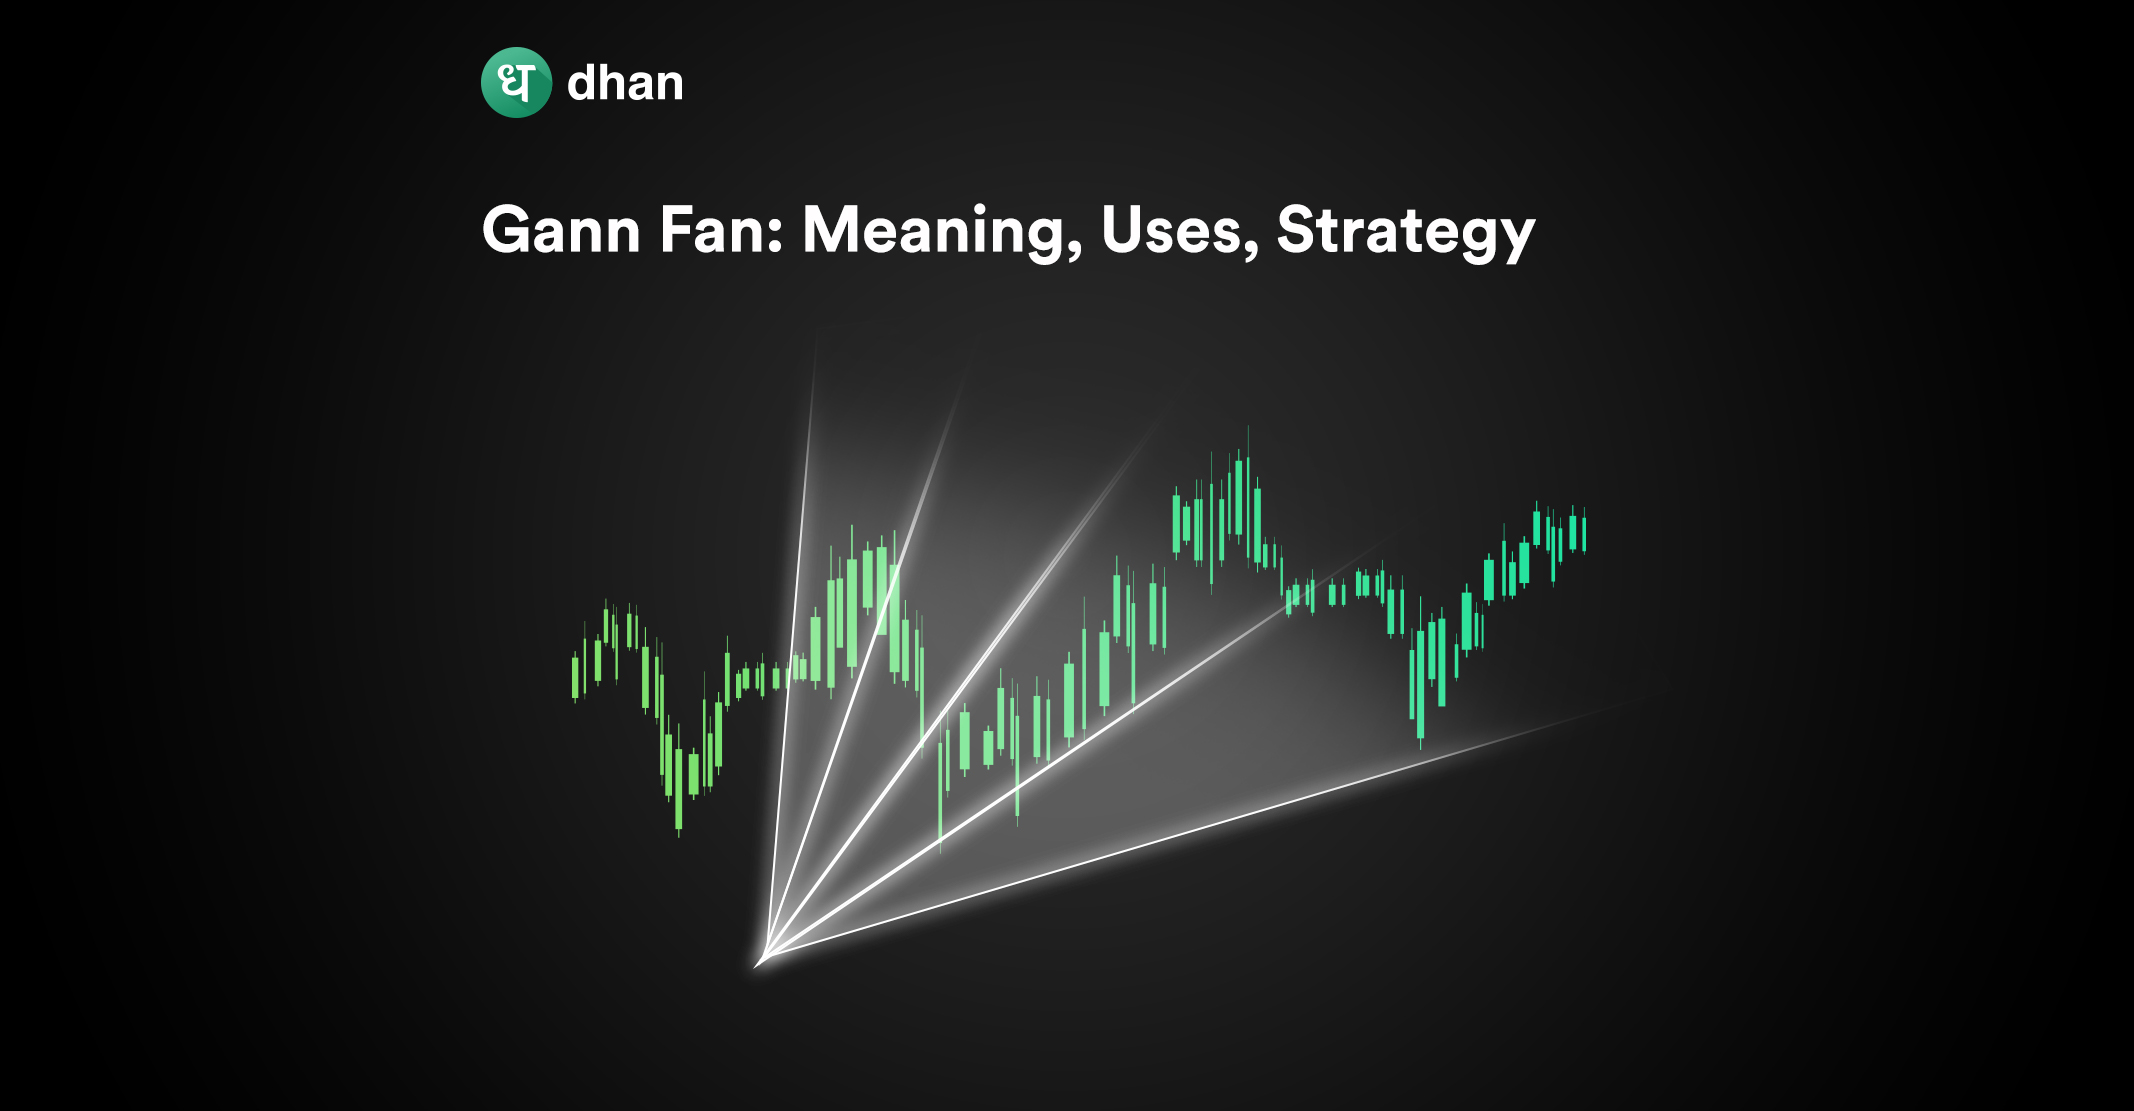
What’s popularly known as a Gann Fan strategy looks like this on a chart 👇
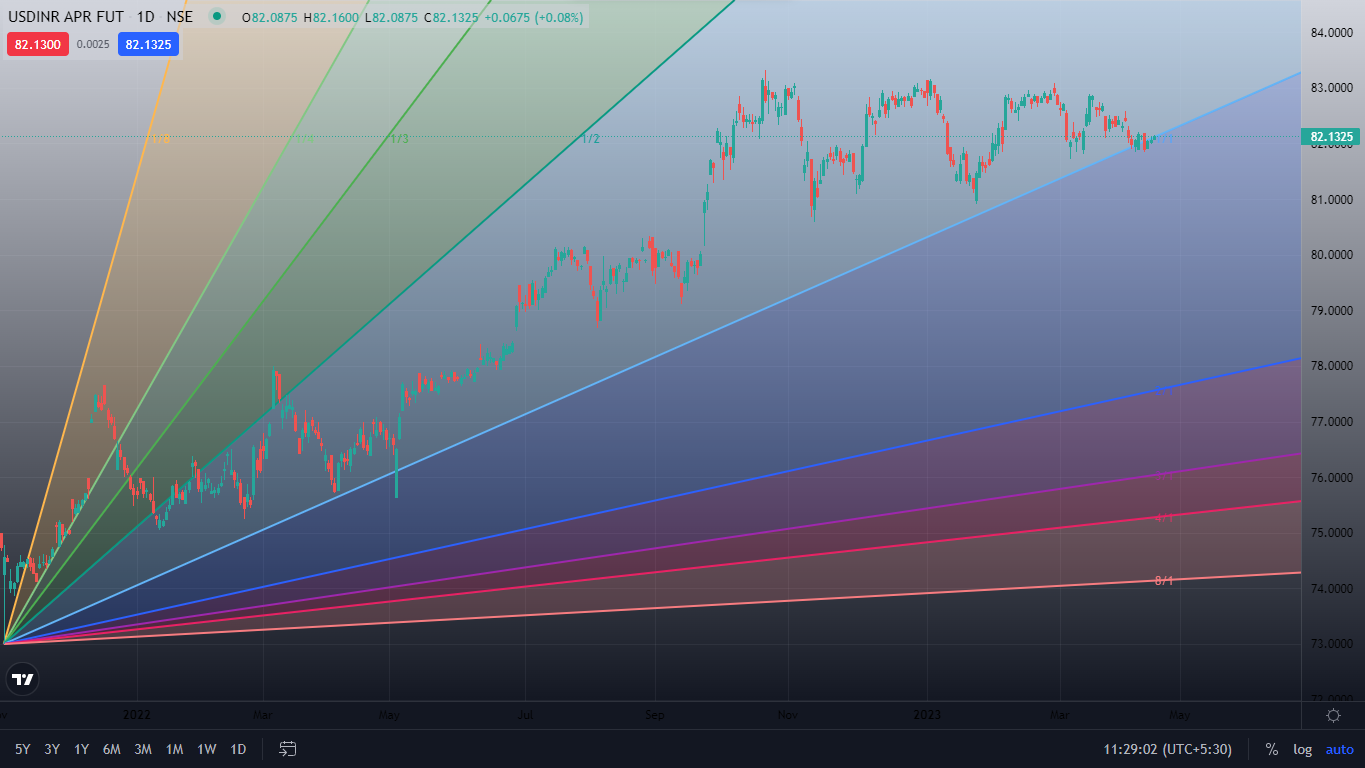
What is a Gann Fan?
Gann Fan is a technical analysis tool that uses 9 lines that extend in multiple directions to determine support and resistance levels.
Each line is fixed at a particular degree and the 45-degree line is the primary Gann level, all of which are plotted from a high or low price point of your choice.
There was a trader known as William Delbert Gann in the 20th century who developed the Gann Fan.
You must be curious why the word Fan keeps showing up. That’s because the various levels of the tool form a fan when plotted on a chart.
By plotting the Gann Fan levels from significant highs and lows in price, traders can identify potential support and resistance levels on the chart. The nine diagonal lines of the Gann Fan represent different angles, each with its own significance in forecasting price movements.
This allows traders to analyze market trends and potential breakouts. The Gann Fan is a widely used tool for technical analysis and can be applied to various financial instruments, including stocks, futures, options, currency derivatives, and commodities.
If you’re wondering why these Fans exist in the first place – the assumption is that the price of securities follows geometric patterns that can be plotted based on various highs and lows, the study of which can lead to potential trading decisions.
How Does Gann Fan Work?
To make the Gann Fan indicator work effectively, you’ll have to identify significant highs and lows in the price chart.
These points will serve as anchors for drawing the fan lines. Once the anchor points are determined, draw the fan lines from the anchor point to the respective levels. This will create a fan-like pattern on the chart.
Lucky for you, Dhan’s online stock trading platform gives you access to a pre-built Gann Fan. All you have to do is select a price point and the rest of the Fans will be plotted automatically.
The main angle is 45 degrees and W.D. Gann considered this level to be the most important. The logic is that price-time harmony is achieved at the 1:1 (45°) level, where an increment of one price point occurs for one time unit (per day).
Other angles, such as 1:2 (63.75 degrees) and 1:4 (75 degrees), can also be used to identify potential support and resistance levels. More angles include:
- 1:3
- 1:8
- 2:1
- 3:1
- 4:1
- 8:1
Use of the Gann Fan Tool
The following are a few examples of how the Gann Fan tool can be used:
1. Finding Support and Resistance Levels: Gann angles can be used to determine support and resistance levels. Prices may fluctuate or reverse when they reach a Gann angle.
For example, you’ll be able to trade breakouts based on the direction of the price. If the price breakouts above the ascending angle, then it’s a potentially strong market where the price is likely going up.
Testing this theory is essential before trading during forex market hours, stock market hours, or commodity market hours.
2. Measuring the Strength of a Price Move: Gann angles can also be used to measure the strength of a price move. A steep angle suggests a strong movement, whereas a shallow angle suggests a weak movement.
3. Prediction of Price Targets: Traders can use the Gann fan to predict future price targets. By measuring the angle of a move and applying it to the trendline, traders can predict the price movement direction.
4. An Indicator of Trend Strength: the Gann fan can also be used to determine the degree of trend strength. Strong trends are characterized by steep angles in either direction of the 1:1 (45°) line and progress rapidly, whereas weak trends are shallowly angled and progress more slowly.
For example, You may get a “buy” signal at the intersection of the Gann angles once the price of the security exceeds the 1:1 Fan line. Similarly, you’ll get a “sell” signal when the price of the security drops below the 1:1 Fan line.
Accuracy of the Gann Fan Indicator
It’s important to remember that the Gann Fan, like any other trading indicator, may not always be reliable. Price movements in financial markets are often random and do not necessarily follow specific angles or rules.
In fact, you may notice that the Gann Fan angles themselves are not foolproof support and resistance markers. However, the Gann Fan can provide an additional method of analyzing price movements and trend slopes.
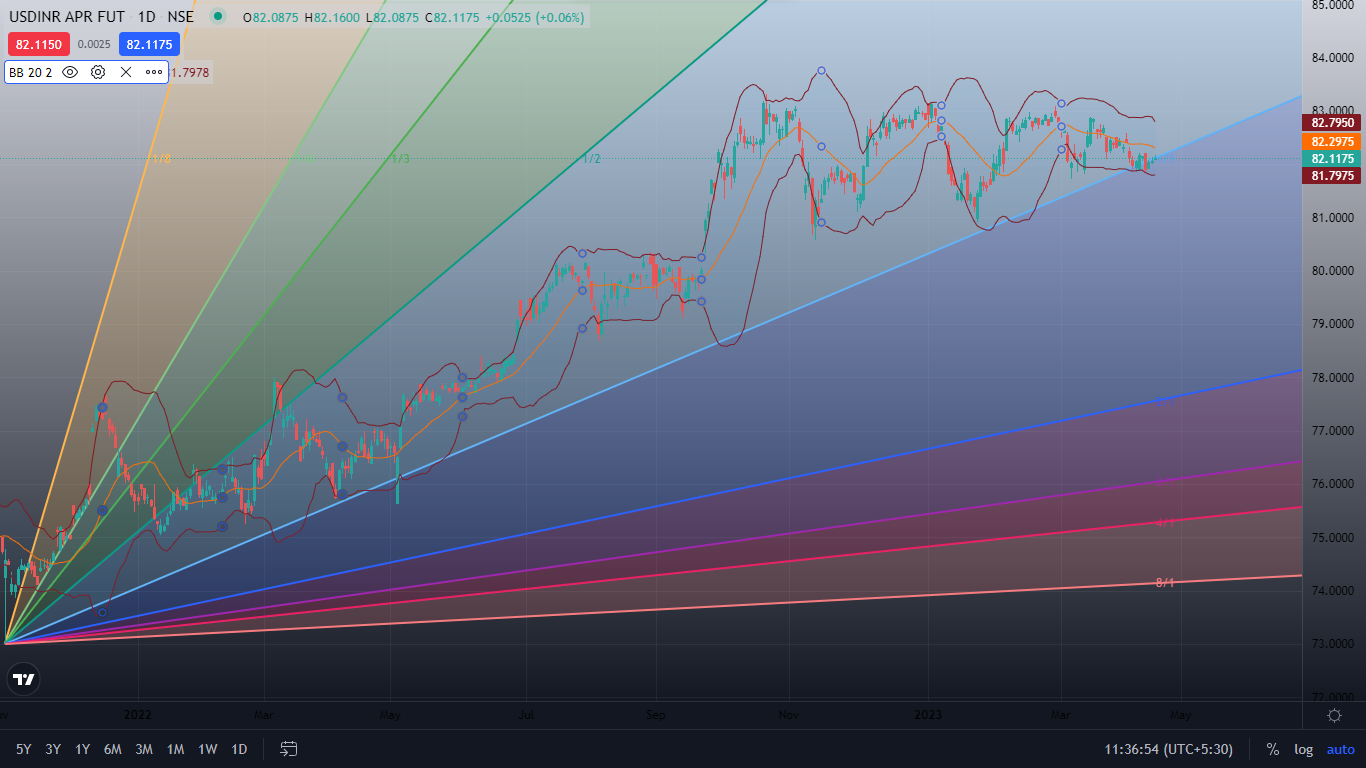
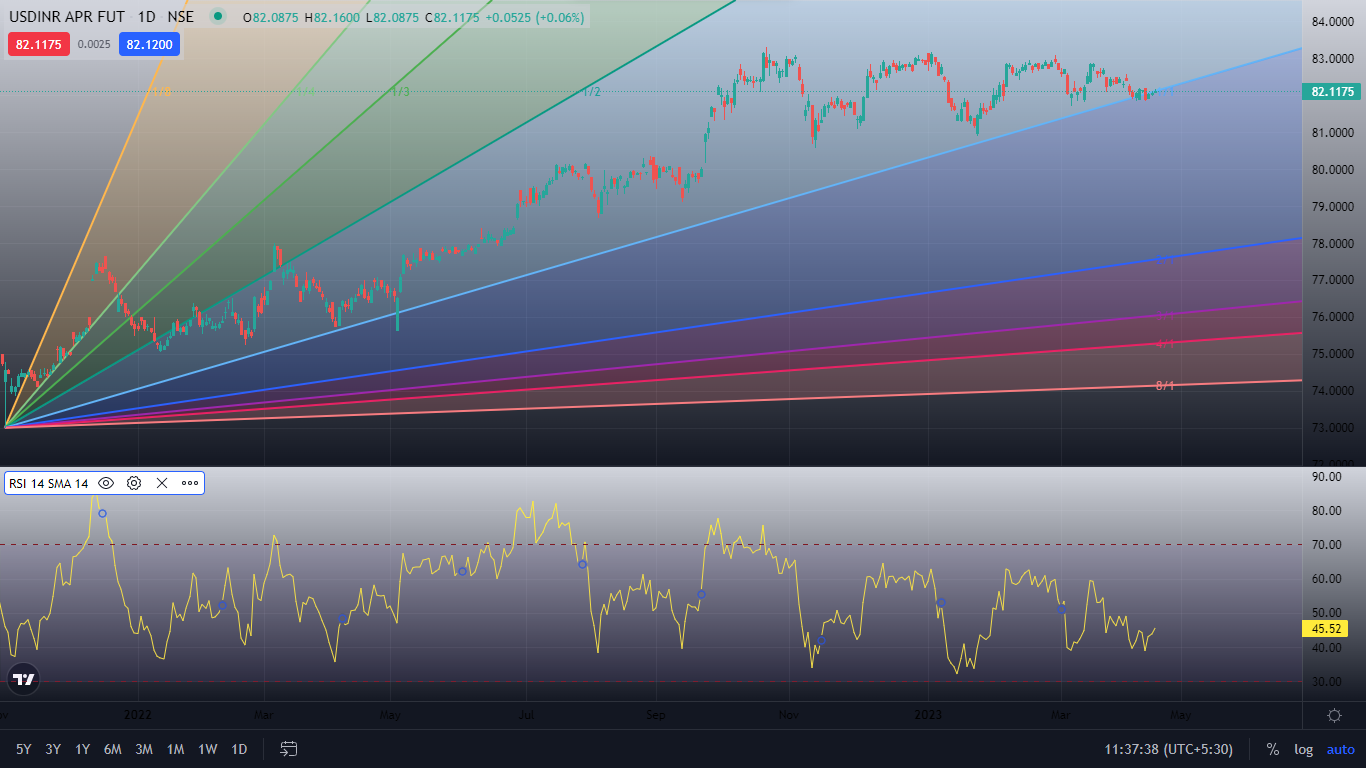
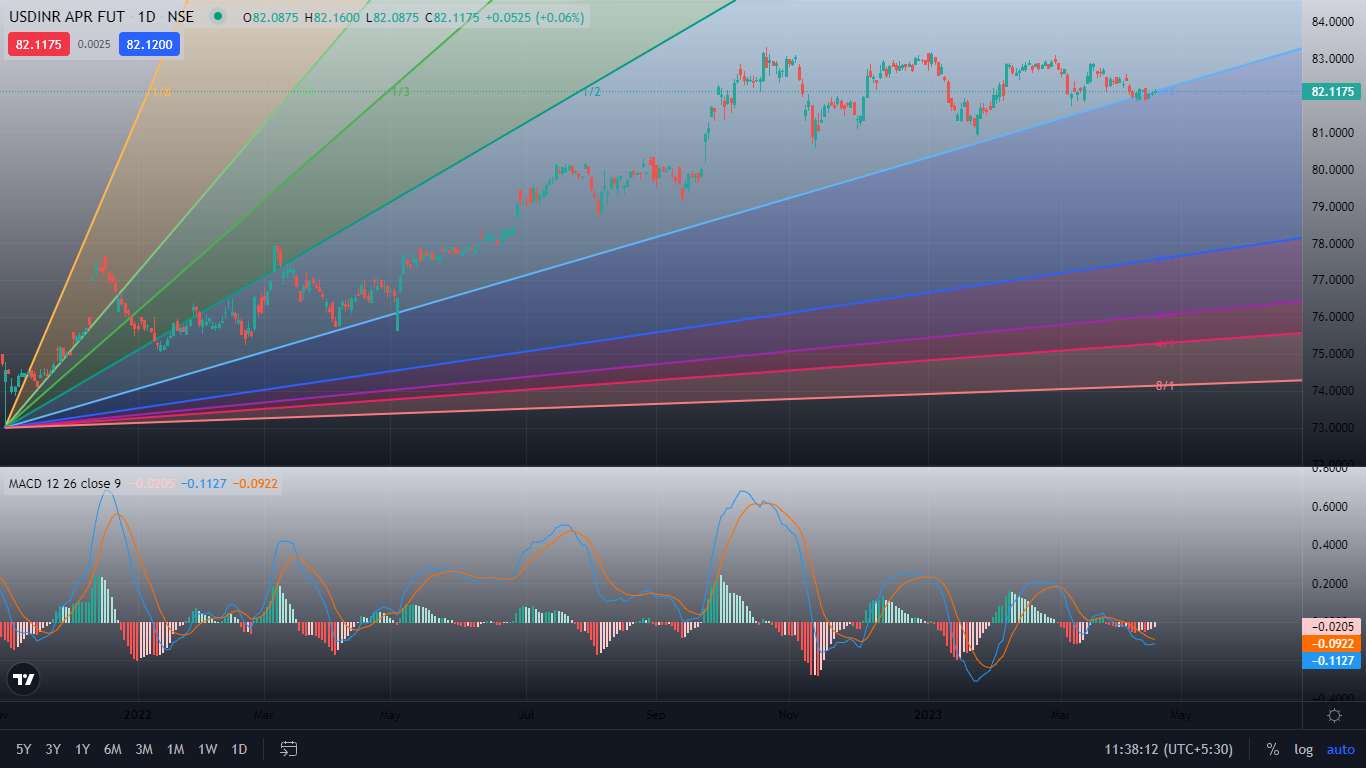
Gann Fan can be used as a tool for technical analysis in conjunction with other indicators like:
- Bollinger Bands
- RSI
- MACD
If you’re considering incorporating the Gann Fan into your trading strategy, it’s crucial to back-test it first to determine its effectiveness and suitability for your specific trading style.
Back-testing involves applying the Gann Fan to historical price data to see how it would have performed in the past, which can help you gauge its potential merit as a trading tool in the present.
Remember to exercise caution and use proper risk management techniques when using any trading indicator, including the Gann Fan. Always rely on a well-rounded trading approach that incorporates multiple tools and strategies for making informed trading decisions.
Read 👉 Best Forex Trading Strategies for 2023
Conclusion
The Gann Fan is a technical analysis tool that can provide insights into time and price movements in financial markets. However, like any other trading tool, it should be used with caution and in conjunction with other analysis methods for a comprehensive approach to trading.
Like this? Then you’ll love: