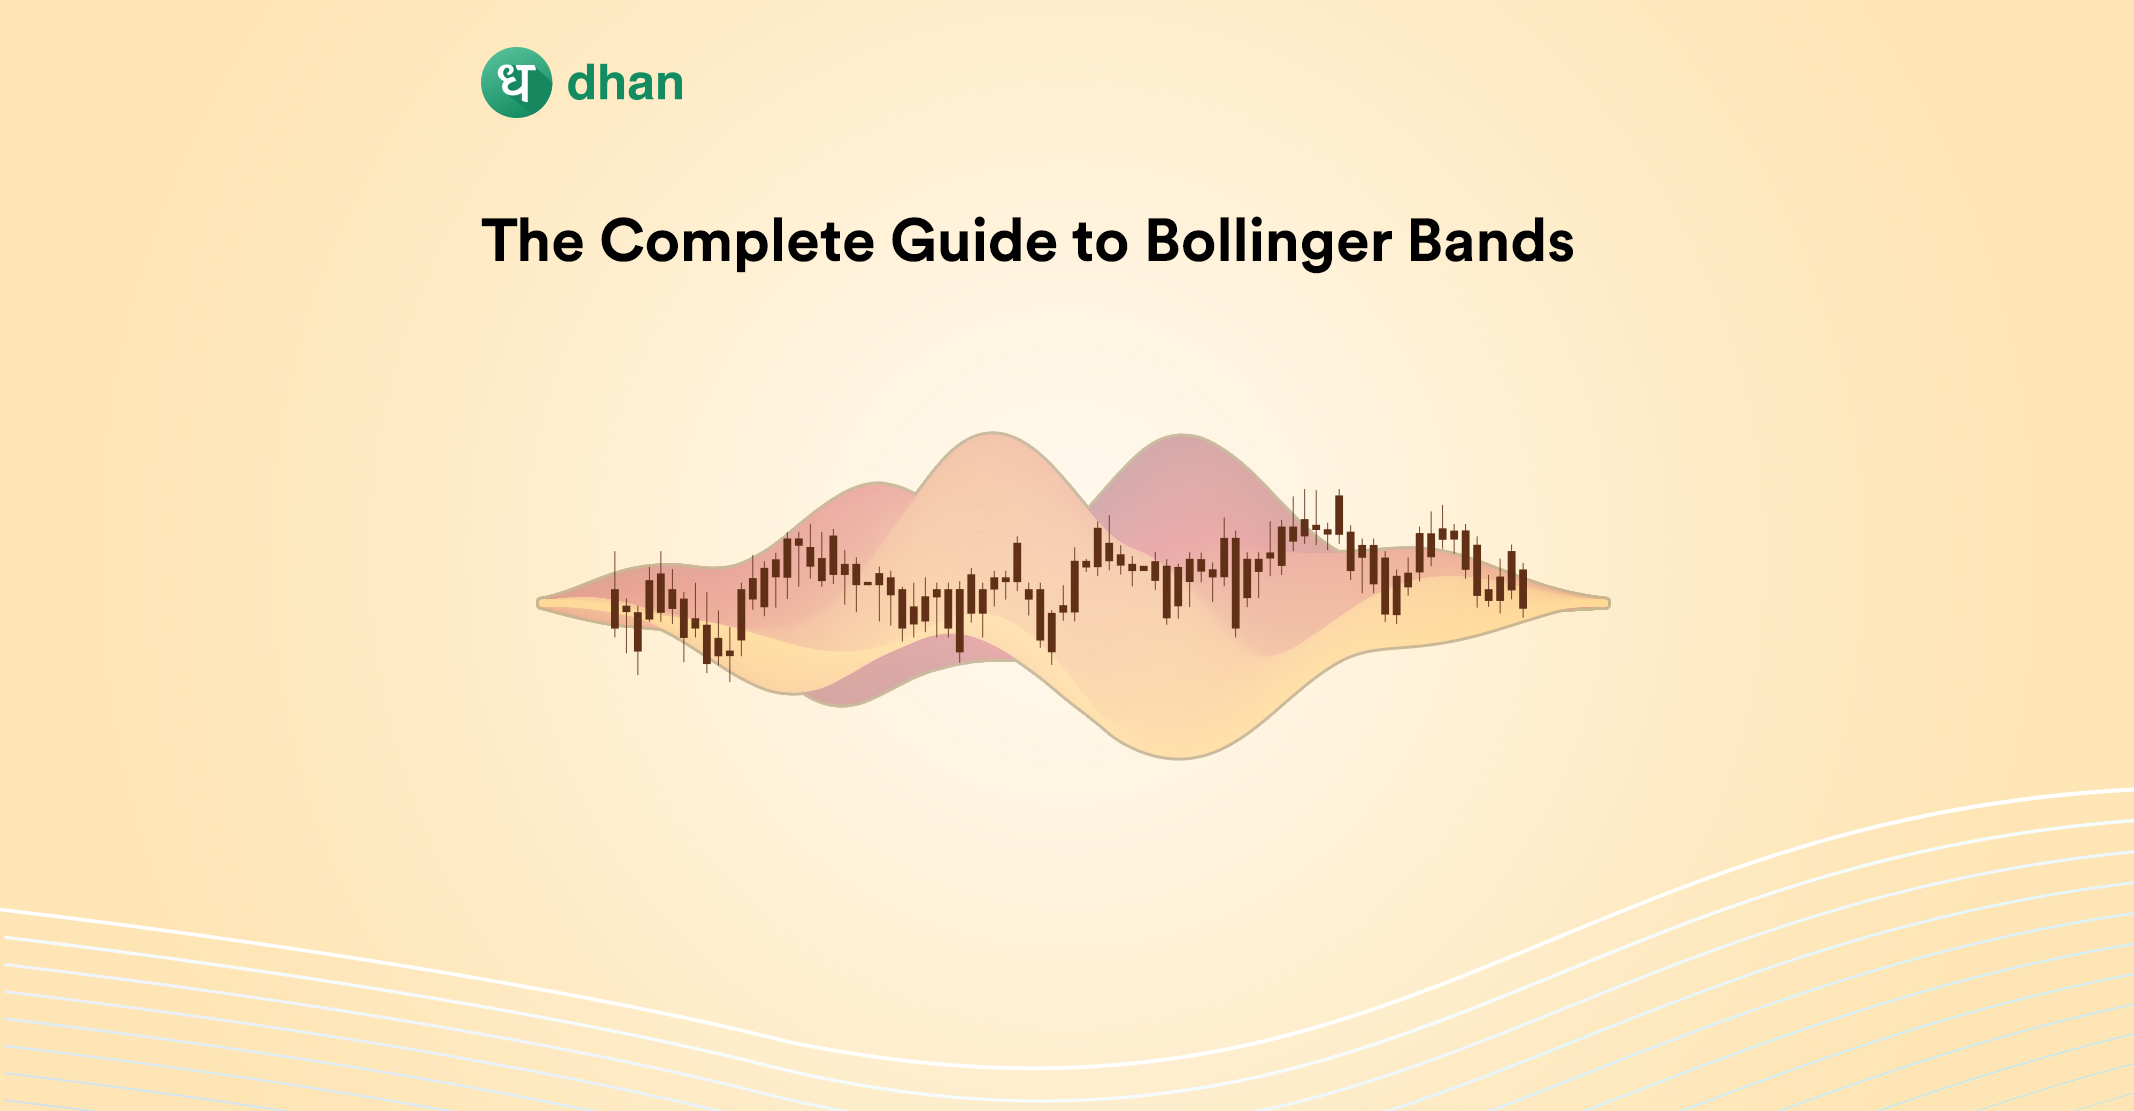
What is Bollinger Bands Width?
The Bollinger Bands Width is a technical indicator that is used to measure the expansion and contraction of Bolling Bands and identify a popular trading signal known as The Squeeze.
In principle, Bollinger Bands Width (BBW) is an extension to its parent – the Bollinger Bands Indicator (BB).
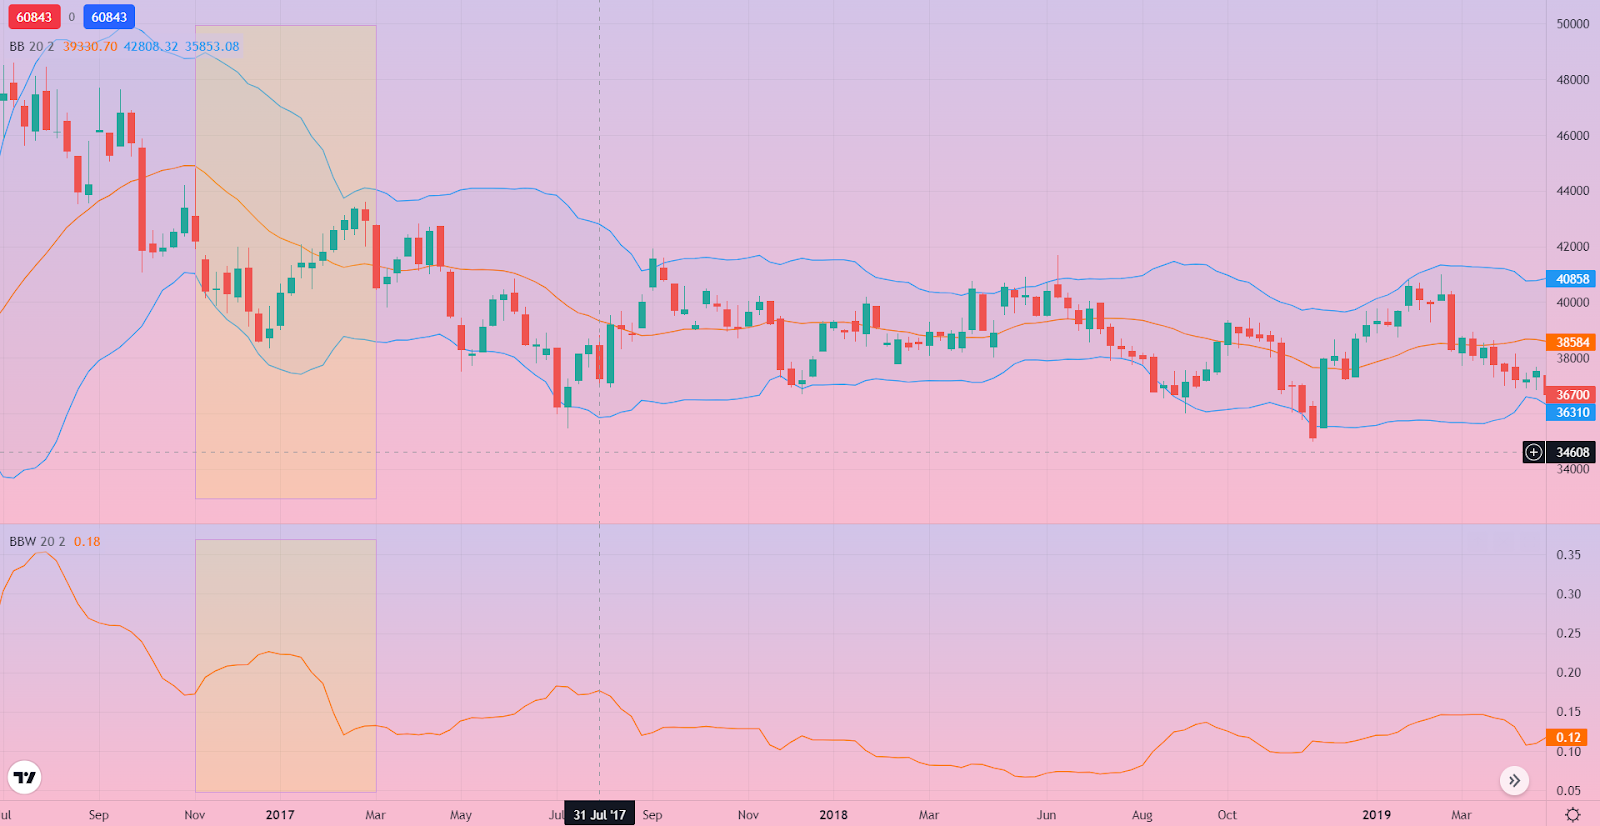
The BB indicator is made up of three lines (bands) as shown in the image below.

A Simple Moving Average (SMA) is used to plot the movement of the middle band, which is the price of a stock, commodity, or currency over 20 periods.
The upper and lower bands are typically two standard deviations from the SMA.
BBW is obtained by dividing the difference between the upper and lower bands by the middle band.
The goal of the BBW indicator is to determine the nature of Bollinger Bands that can expand or contract based on volatility.
Volatility is a given in any securities market sooner or later.
That’s why the Bollinger Bands ecosystem is in place – to benefit from “The Squeeze”, a widely accepted phenomenon that occurs after a period of historically low volatility.
We’ve covered the phenomenon in detail here: Bollinger Bands Squeeze Explained! Check it out and return to this blog.
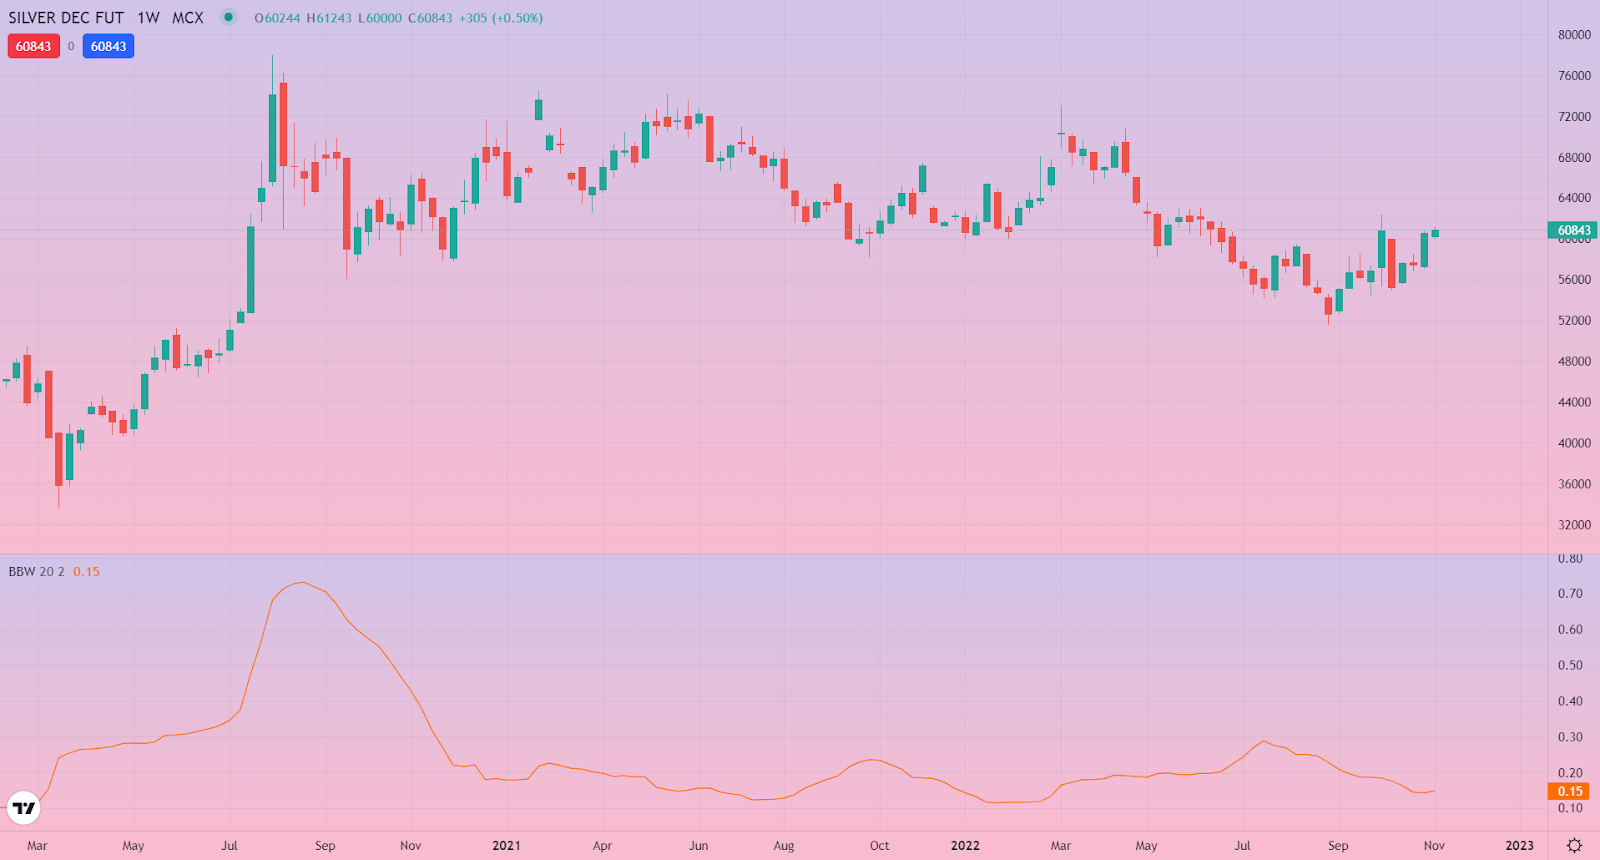
On charts, the BBW indicator is represented as a single line as shown in the image below.
Bollinger Bands Width Formula
Calculating the BBW is simple. All you need to do is subtract the value of the lower band from the upper band and divide the result by the value of the middle band.
The three components are typically as follows:
- Upper Band: 2 Std. Dev. above Middle Band
- Middle Band: SMA of price across 20 periods
- Lower Band: 2 Std. Dev. below Middle Band
Bollinger Bands Width Formula = (Upper Band – Lower Band) / Middle Band
How to Interpret Bollinger Bands Width?
Bollinger Band Width was created by John Bollinger as a part of his broader technical indicators system as a means to listen to the market.
The market often tells you when a period of high volatility (trading opportunities) is about to begin after The Squeeze. The BBW indicator is adept at identifying it.
The Bollinger Bands Width will increase during a period of high volatility. You can see this visually as a rising line and numerically as a high value. Both are shown in the image below.

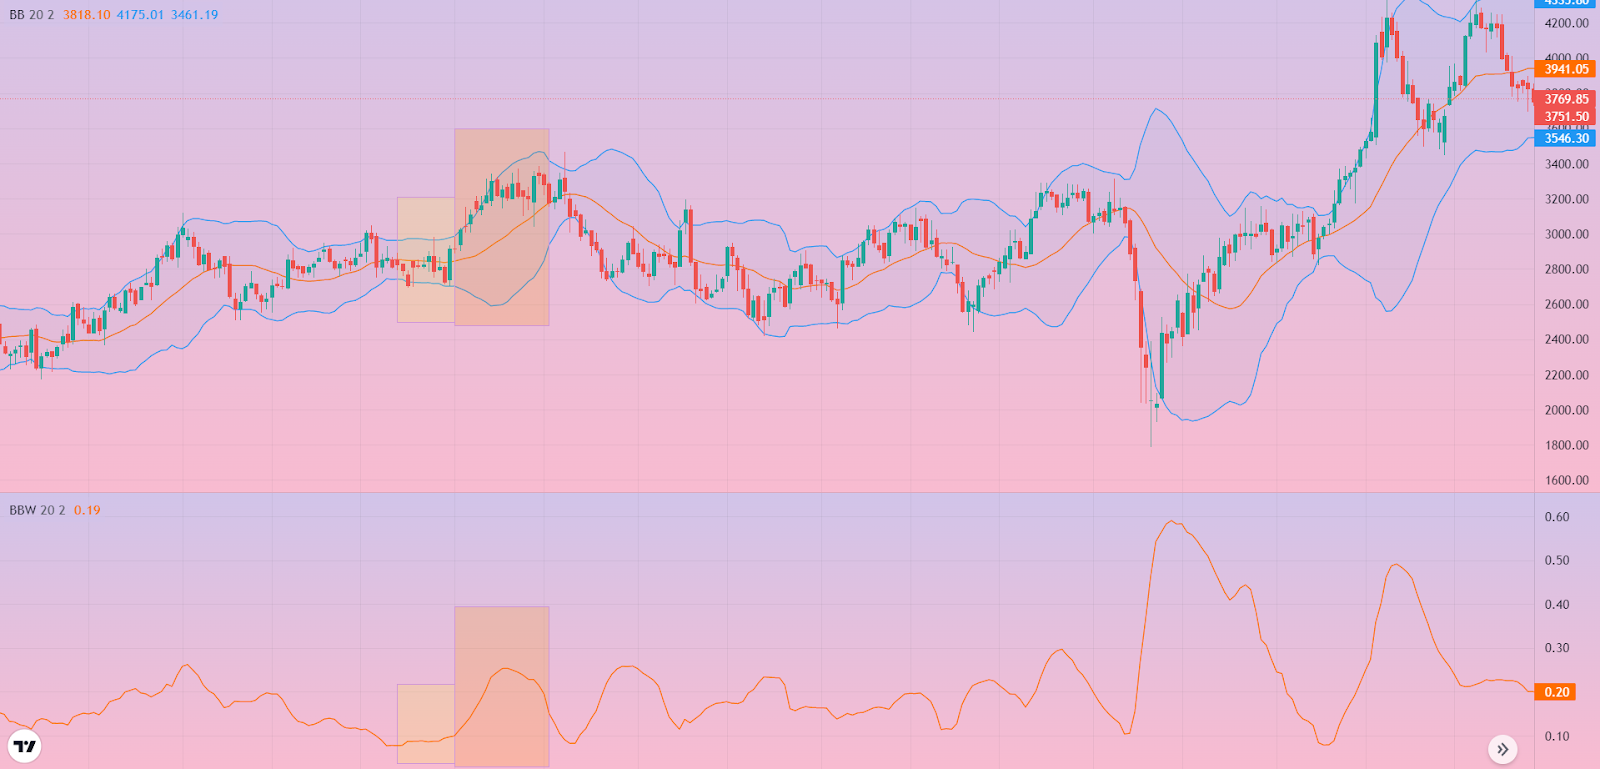
When volatility goes down, the BBW value will decrease. Visually, you will be able to see the BBW indicator line falling as well as the value dropping as shown in the image below.
The Squeeze is triggered soon after volatility falls sharply, often hitting historical lows. The width between the Bollinger Bands contracts sharply.
This is immediately followed by expanding bands and a breakout above the upper band during a Bullish Squeeze or a breakout below the lower band during a Bearish Squeeze.
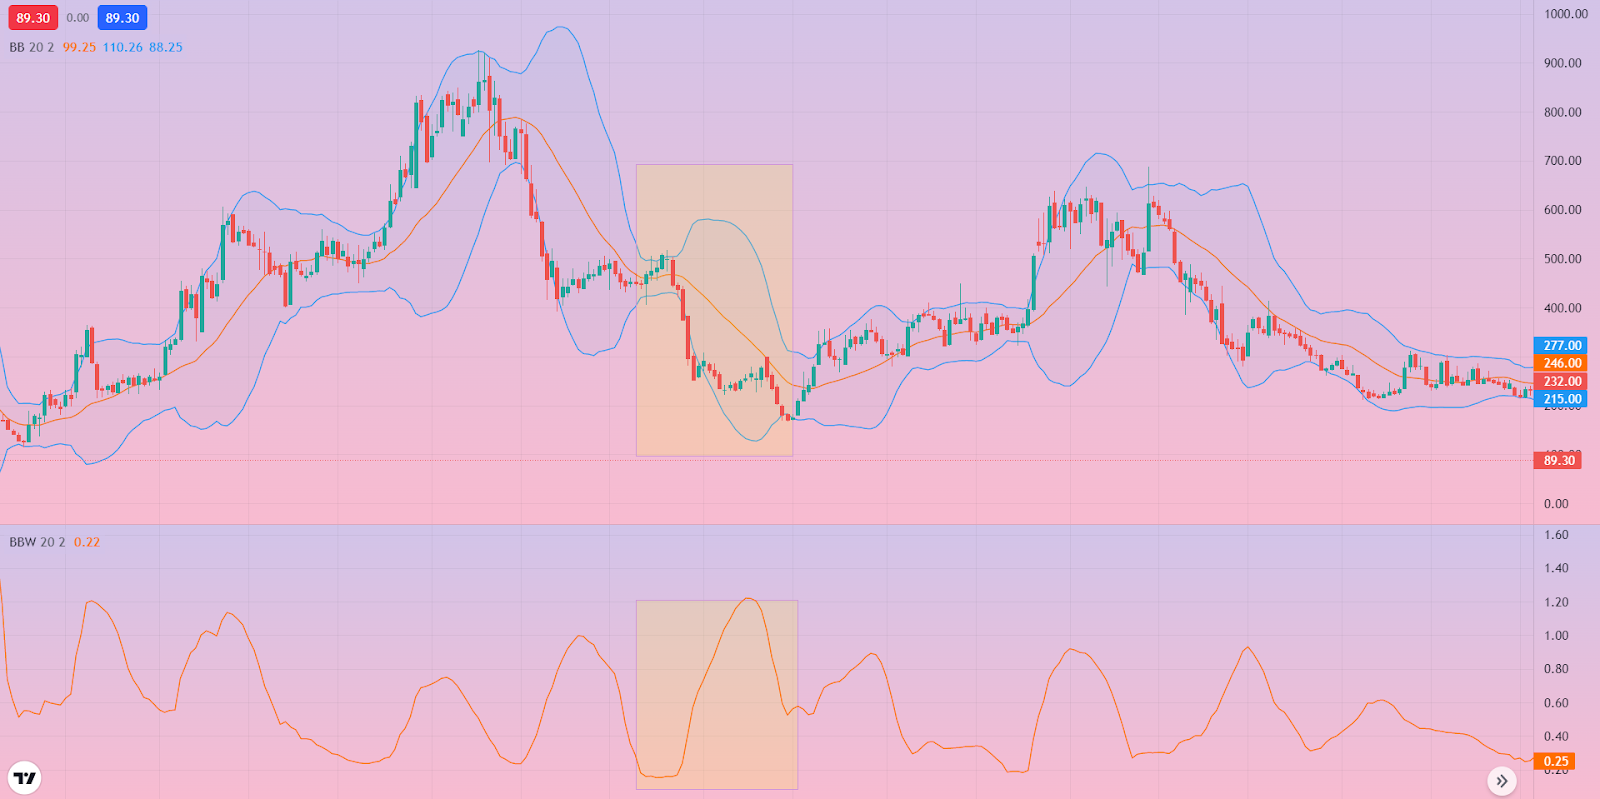
In either case, the BBW value drops before increasing again when the distance increases between the bands, which also signals the rise and rise of volatility.
The opposite of The Squeeze happens when Bollinger Bands Width expands. When the upper and lower bands are quite a distance apart, it means that a move is coming to an end.
Conclusion
The Bollinger Bands Width is an extension of the Bollinger Bands Indicator, both of which are useful technical indicators to identify The Squeeze and its resultant volatility.
That said, BBW and BB are prone to head fakes wherein the breakout happens in one direction and moves in the opposite direction soon after.
Thus, it is important to use BBW smartly in tandem with a directional indicator like the Relative Strength Index to ensure that you enter and exit trades with more confidence.
Like this? Then you’ll love these blogs on technical indicators:
- The Complete Guide to Average True Range Indicator
- The Complete Guide to Average Directional Index
- How to Read Candlestick Charts for Day Trading?
P.S: You can access Bollinger Bands Width and hundreds of other indicators for free from TradingView Charts on Dhan.