If someone says Xs and Os, what do you think of – the game? Well, there’s a technical chart that uses Xs and Os instead of traditional candles. This type of chart is known as a Point and Figure chart for online share trading. Let’s talk all about it in this blog.
What are Point and Figure Charts?
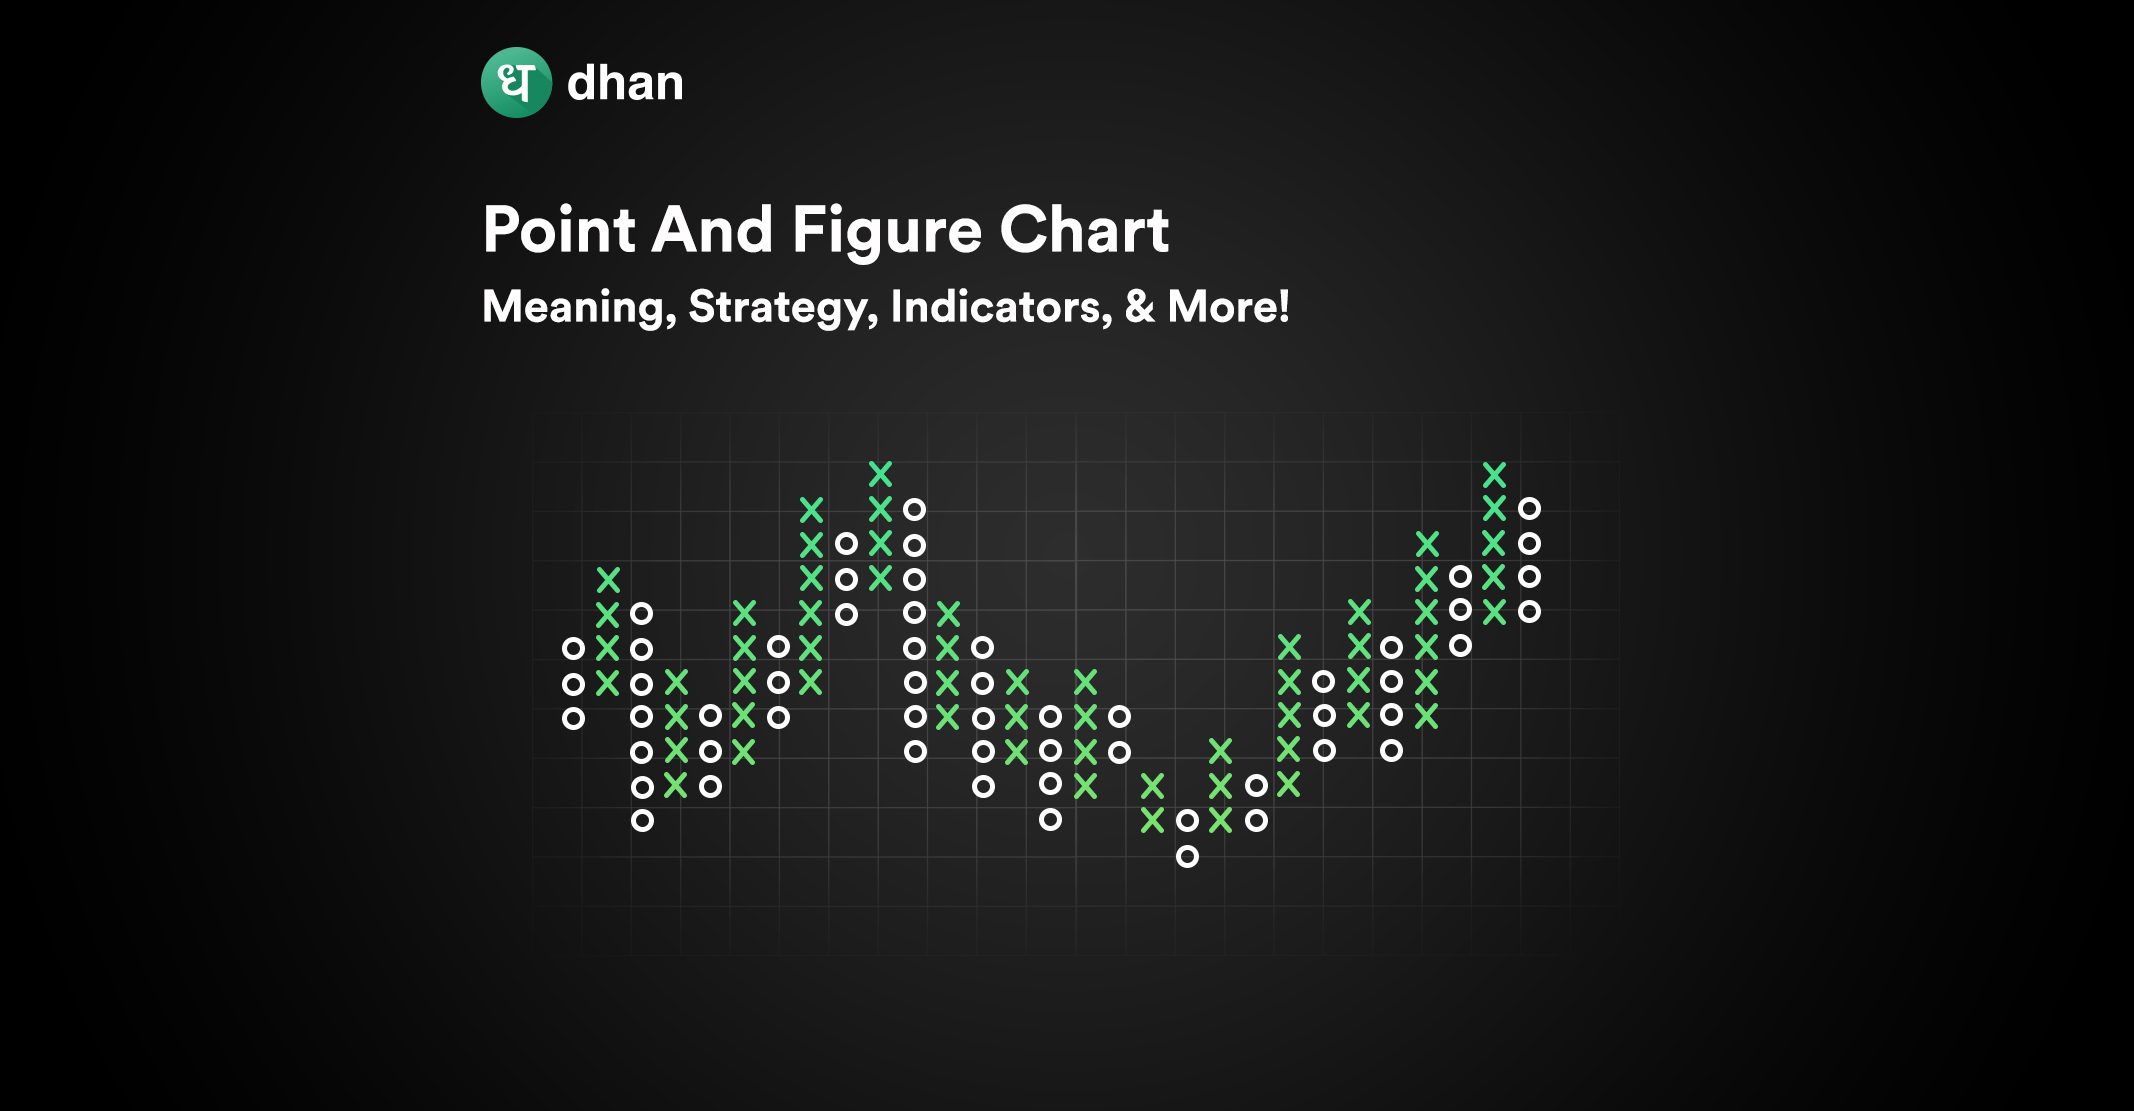
Point and Figure charts are a type of tool for technical analysis on charts used to identify and analyze trends in the stock market. Unlike other types of charts like line charts, bar charts, and candlestick charts, Point and Figure charts use Xs and Os to represent price movements.
The image below will show you what a Point and Figure chart looks like.
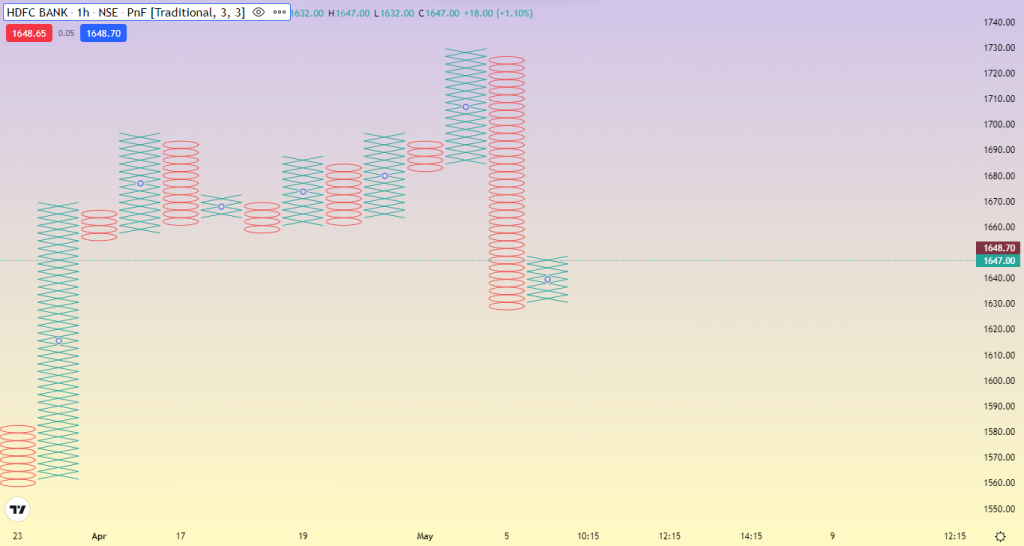
Each X or O represents a specific price point, with Xs representing a rise in prices and Os representing a fall in prices. When the price moves by a certain amount, a new X or O is added to the chart in the corresponding column.
You as a trader get to decide the reversal amount, which is the price after which an O is formed on the P&F chart. Notice how we’re talking about everything except time. That’s because Point and Figure charts ignore the impact of time altogether.
A new X or O is formed only when a price movement that you set (increase or decrease) happens. Thus, Point and Figure charts are useful to filter out the “noise” of small price fluctuations and focus on the overall trend.
Benefits of Point and Figure Charts
Point and Figure charts offer several benefits to traders, as mentioned below.
- Help traders identify entry and exit points. These charts can help minimize the emotional influence on decision-making, but it’s essential to understand that there is no perfect technical indicator or chart type in trading.
- Trendlines on these charts are drawn using mechanical rules, which makes them more consistent and reliable than other chart methods.
- Filter out noise, allowing traders to identify support and resistance bands more conveniently.
- Make it easier to identify chart patterns such as double tops, head and shoulders, and flags. We’ve covered several of these patterns here: How to Read Candlestick Charts
Point and Figure Chart Strategy
While being a simple yet effective charting method, Point and Figure charts can help you identify potential trading opportunities. Here is a simple point and figure chart strategy that you can use with Point and Figure charts:
1. Determine the Trend
The first step is to determine the trend. Check the charts X’s and O’s. If there are more Xs than Os, the trend is bullish. Otherwise, it’s bearish. The following image will show you the different between bullish and bearish P&F chart.
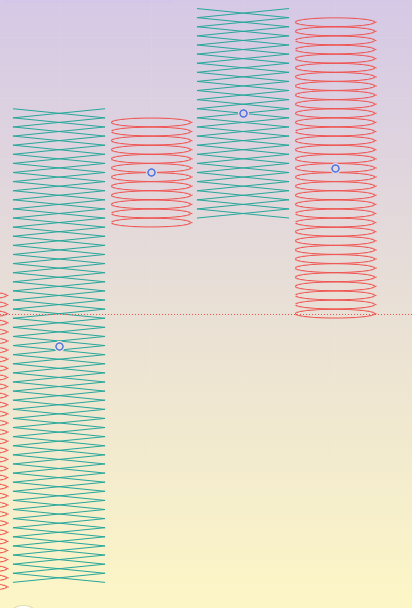
As you can see, the sustained period of Xs was the bullish phase of the trend. Once the reversal amount hit, the Os started forming consistently, leading to a bearish phase.
2. Identify Support and Resistance Levels
Look for areas on the chart where the price has repeatedly bounced off of or failed to break through. These are the support and resistance levels that traders are watching, and they can be used as potential entry and exit points.
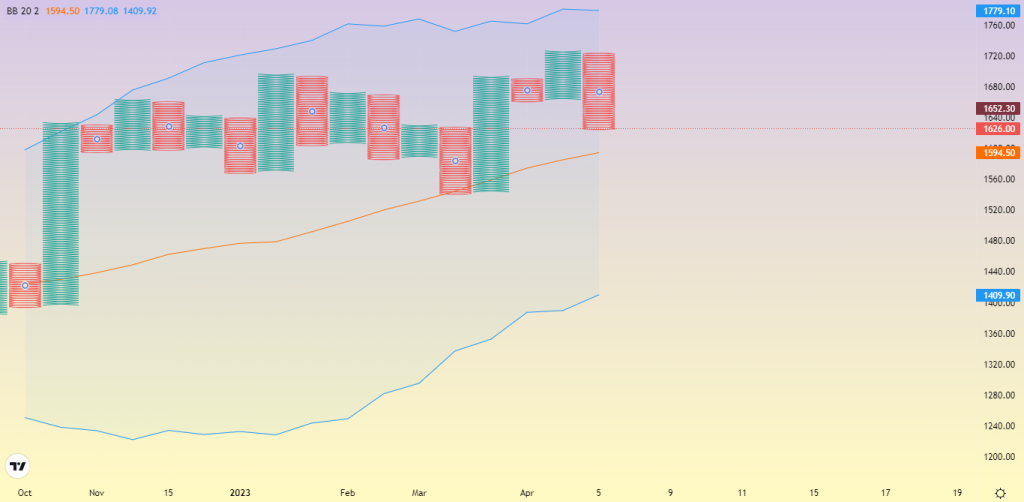
You could also throw one or more indicators on top of the P&F chart to identify support and resistance. For example, Bollinger Bands are often used on P&F charts.
3. Use Price Targets
Point and Figure charts use price targets to determine where the price will likely go next. To calculate a price target, multiply the height of X’s or O’s column by the box size. For example, if the column of X’s is three boxes tall and the box size is ₹1, the price target would be ₹3.
4. Use Stop-Loss Orders
Stop-loss orders are essential for every trading strategy to minimize losses. You may create stop-loss orders using the chart’s support and resistance levels.
5. Monitor the Chart
Finally, checking the chart frequently shows market movement. Point and Figure charts move slower than other charts, so you may not need to check them as regularly, but market moves are still significant.
Best Suited Indicators for Point and Figure Charts
P&F chart should not be drawn on any smoothed indicator. Instead, they are best suited to two types of indicators: Relative Strength and On-Balance-Volume.
1. Bollinger Bands
Bollinger Bands are a volatility indicator made up of a two-line envelope above and below a center line which is the Simple Moving Average (SMA) of the price. The two-line envelope is often 2 standard deviations away from the SMA.
The benefit of using Bollinger Bands is that it can help you identify entry-exit points based on expanding and contracting volatility. This is known as the Bollinger Bands Width. Add this indicator to the chart and you have a healthy possibility of finding buy and sell signals.
2. Relative Strength
Relative Strength is a momentum oscillator that compares the Strength of one asset or index relative to another. It is important to normalize the data before plotting the chart, as it will otherwise display too much fluctuation.
Point and figure counts may be used on Point and Figure charts of Relative Strength, but the numbers don’t imply anything.
3. On-Balance Volume
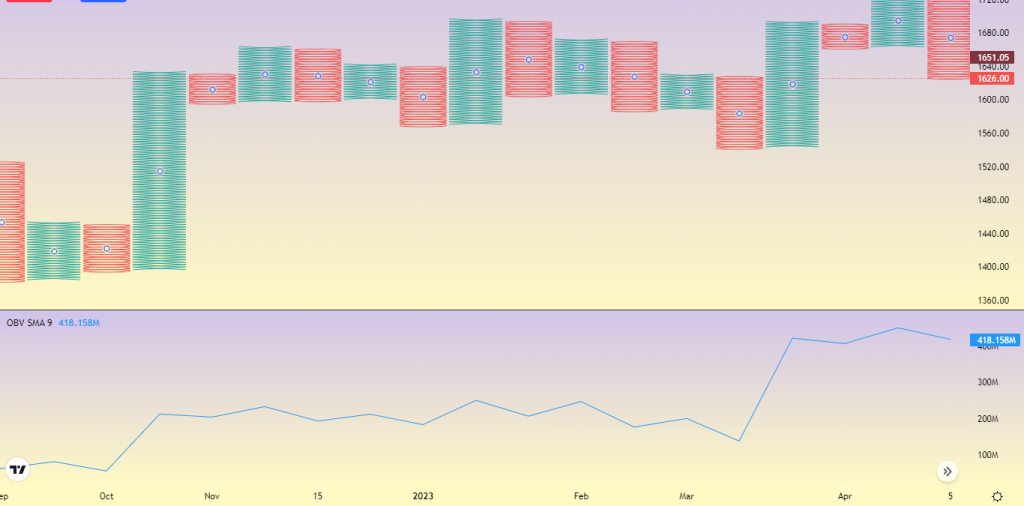
On-Balance Volume is an indicator that uses Volume to identify the Strength or weakness of a security’s price movements. This can be incorporated into Point and Figure charts by plotting the OBV values and price points.
A rising trend on an OBV chart shows collection, while a falling trend shows the distribution. Check out the image below to know more.
Conclusion
Point and Figure charting is a unique approach to technical analysis that has been used for over a century. Unlike traditional charts, a Point and Figure chart focuses solely on price movements irrespective of time.
This type of charting can provide traders with a simplified view of market trends, making it easier to identify patterns and potential entry and exit points as well as price targets based on objective data rather than emotion, helping them enhance their trading journey.
Its simplicity and clarity make it a popular choice among technical analysts, and its mechanical rules and signals make it easier to identify trading opportunities.
Like this? Then you’ll love: