


What is the ATR Indicator?
Water is wet, the sky is blue, there’s money in the markets and volatility too. Fun rhymes aside,…
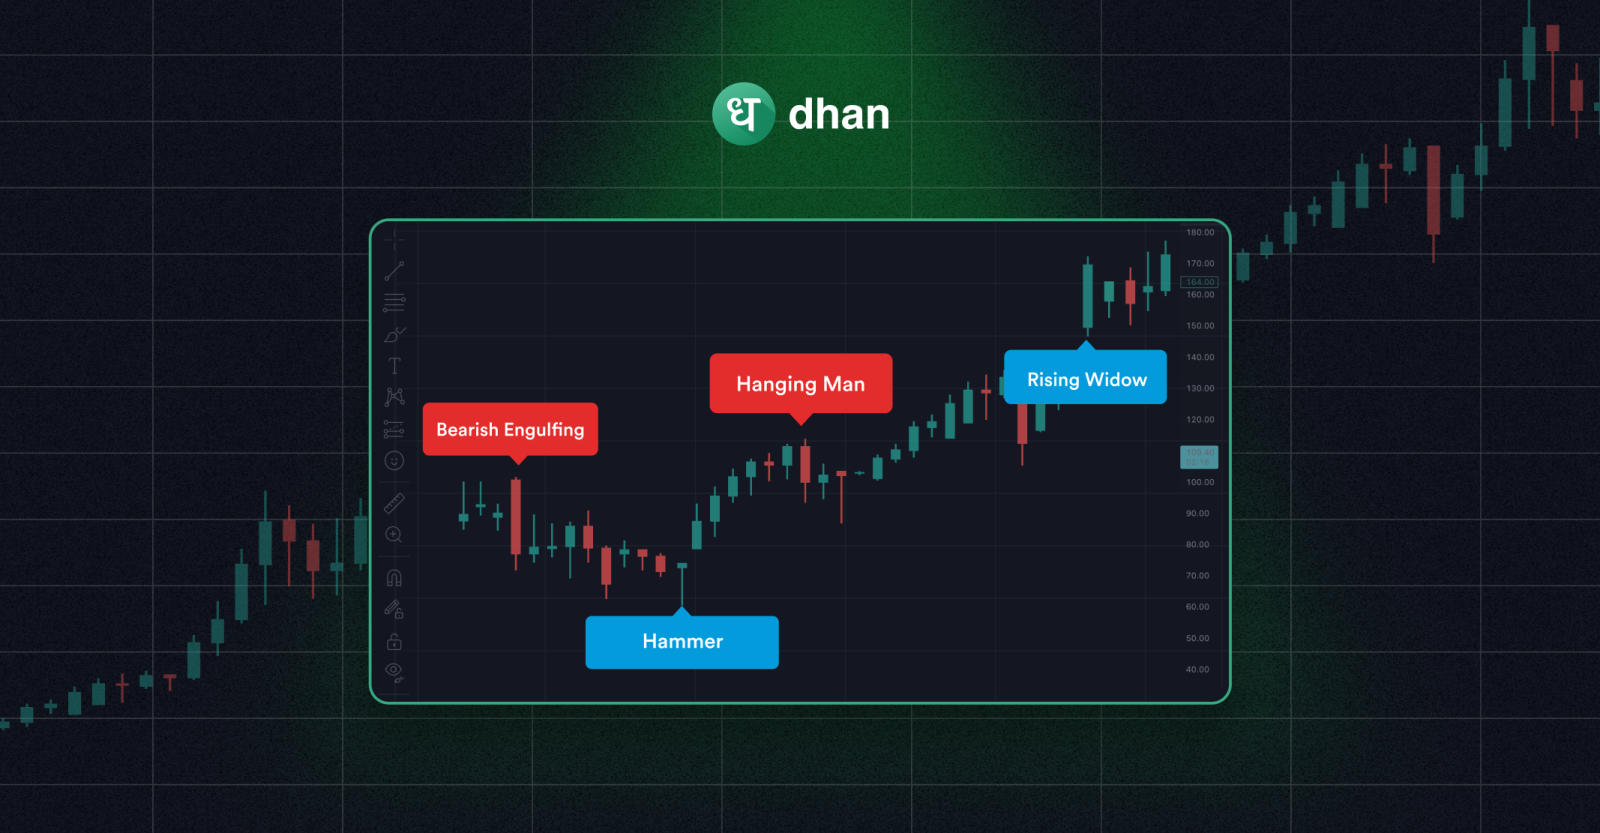
How to Read Candlestick Charts for Day Trading?
The supply and demand dynamics together are crucial factors that drive market prices. But how do you understand…

What is the Average Directional Movement Index?
Trend trading is known to be a lucrative strategy if executed correctly. That’s why there are indicators specially…
Bollinger Bands Squeeze Explained!
Volatility is pretty much a part and parcel of any securities market, be it stocks, commodities, derivatives, or…
List of Stock Exchanges in India: BSE, NSE, MSE & More
Are you ready to start your stock trading journey and learn more about this space? You have come…

Top 10 Most Expensive Stocks in the World
The stock market is rapidly growing every day and the prices for stocks are frequently changing. But there…

The Complete Guide to Bollinger Bands Indicator
Measuring volatility can be a useful tool for understanding risk, value, and much more. Having an indicator that…

The Complete Guide to Average True Range Indicator
What is the Average True Range Indicator (ATR)? The Average True Range Indicator is a measure of volatility…
How to Start Commodity Trading in India?
The commodity market is a place where some of the most essential goods and raw materials exchange hands.…
The Complete Guide to Average Directional Index: Meaning, Uses, Strategy!
What is the Average Directional Index (ADX)? The Average Directional Index (ADX) is a technical indicator that is…