The ascending triangle pattern is a bullish pattern that is popularly used in online stock trading for generating buy & sell signals. In this blog, we’ll help you understand what is ascending triangle pattern
Meaning of the Ascending Triangle Pattern
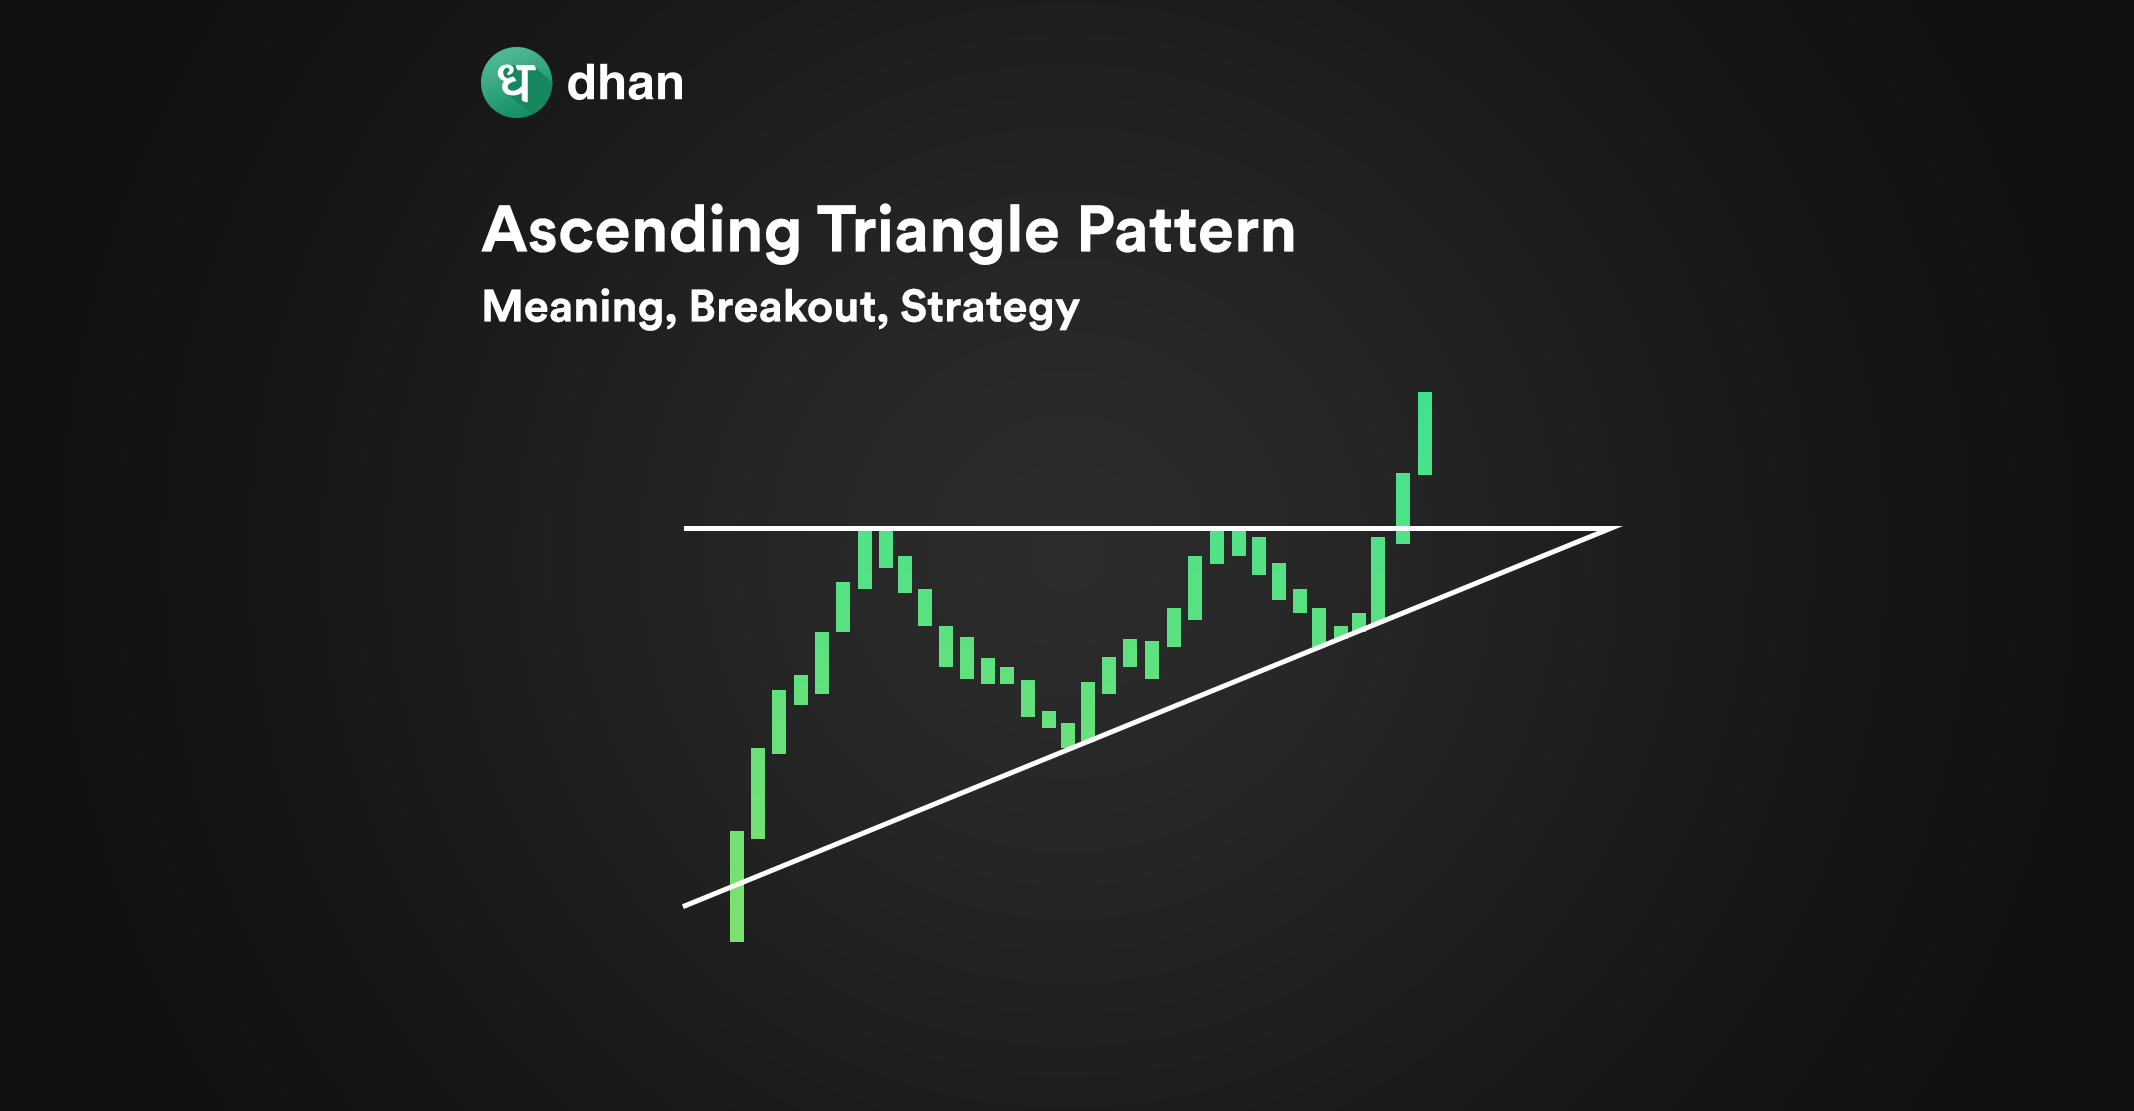
The ascending triangle pattern is a continuation pattern observed during a bullish trend, characterized by at least two swing highs forming a flat horizontal line and more than two rising swing lows eventually coinciding with the flat line.
The swing lows which are the bottom part of the candle are an indication of a rising trend. If the swing high and low lines are drawn, you’ll observe a right-angled triangle. This line is likely to extend upwards in unison.
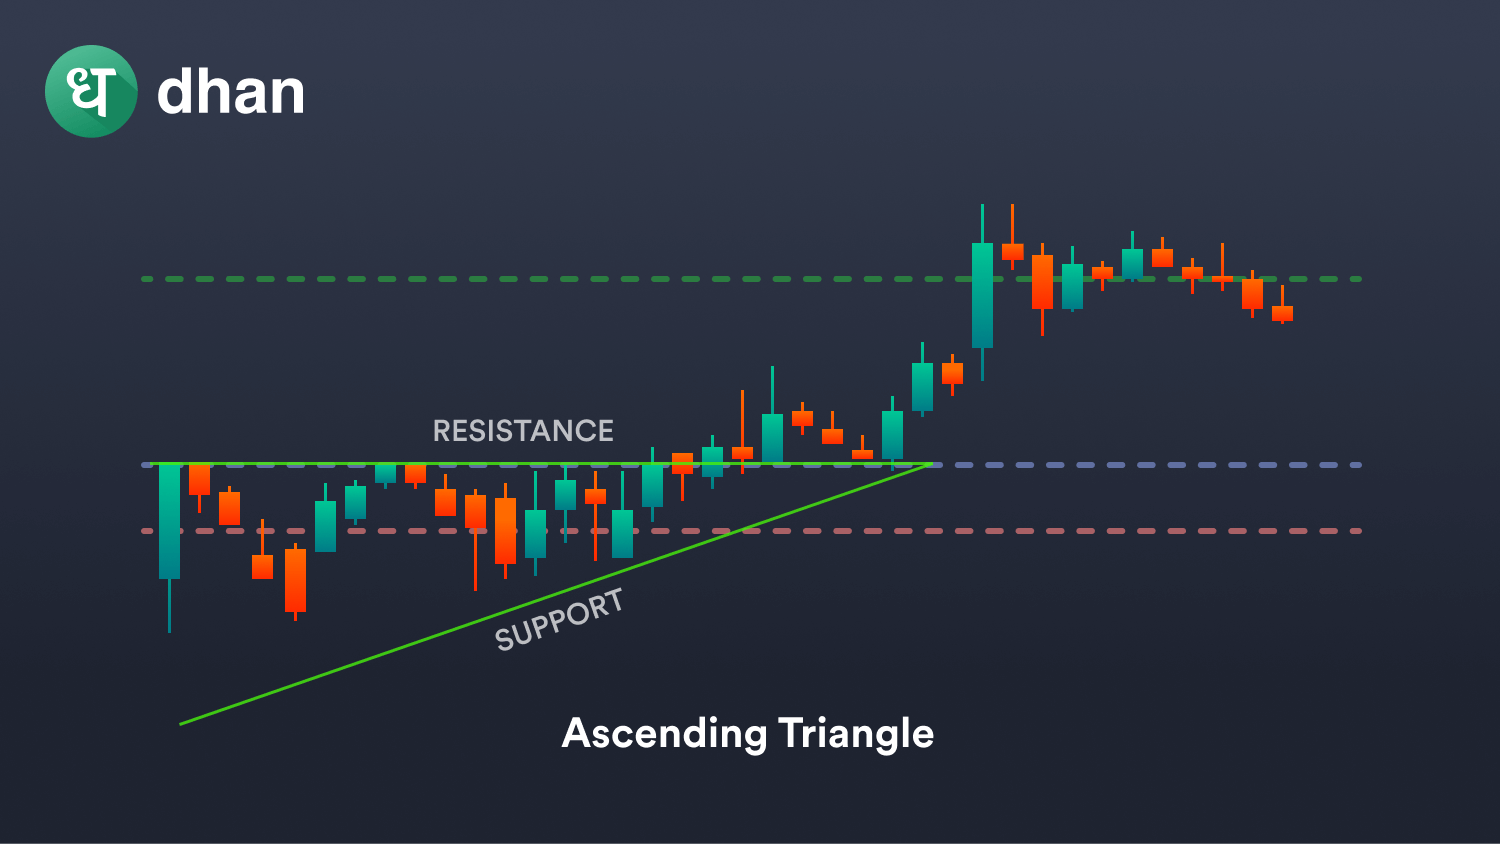
Check out the image above to see the triangle pattern ascending.
The flat horizontal line that connects the swing highs is viewed as a psychological barrier by traders. This simply means that the price level is challenging to break through.
That said, the rising swing lows indicate that buyers are gradually becoming more aggressive. This eventually leads to an upward breakout.
Breakout in Ascending Triangle Pattern
A breakout means that the price of the security has crossed a significant resistance level, in this case, the upper level. Traders refer to this breakout as a bullish breakout.
We haven’t spoken about one part of this breakout yet – sellers. Their lack of a charge or forward push is the reason why swing lows form at the bottom of the pattern.
Buyers eventually take control and push the price upwards at the end of the ascending triangle pattern, and the breakout is a trading signal for potentially going long.
Trading the breakout in ascending triangle patterns requires three of the following tools:
- Technical indicators
- Entry strategy
- Exit strategy
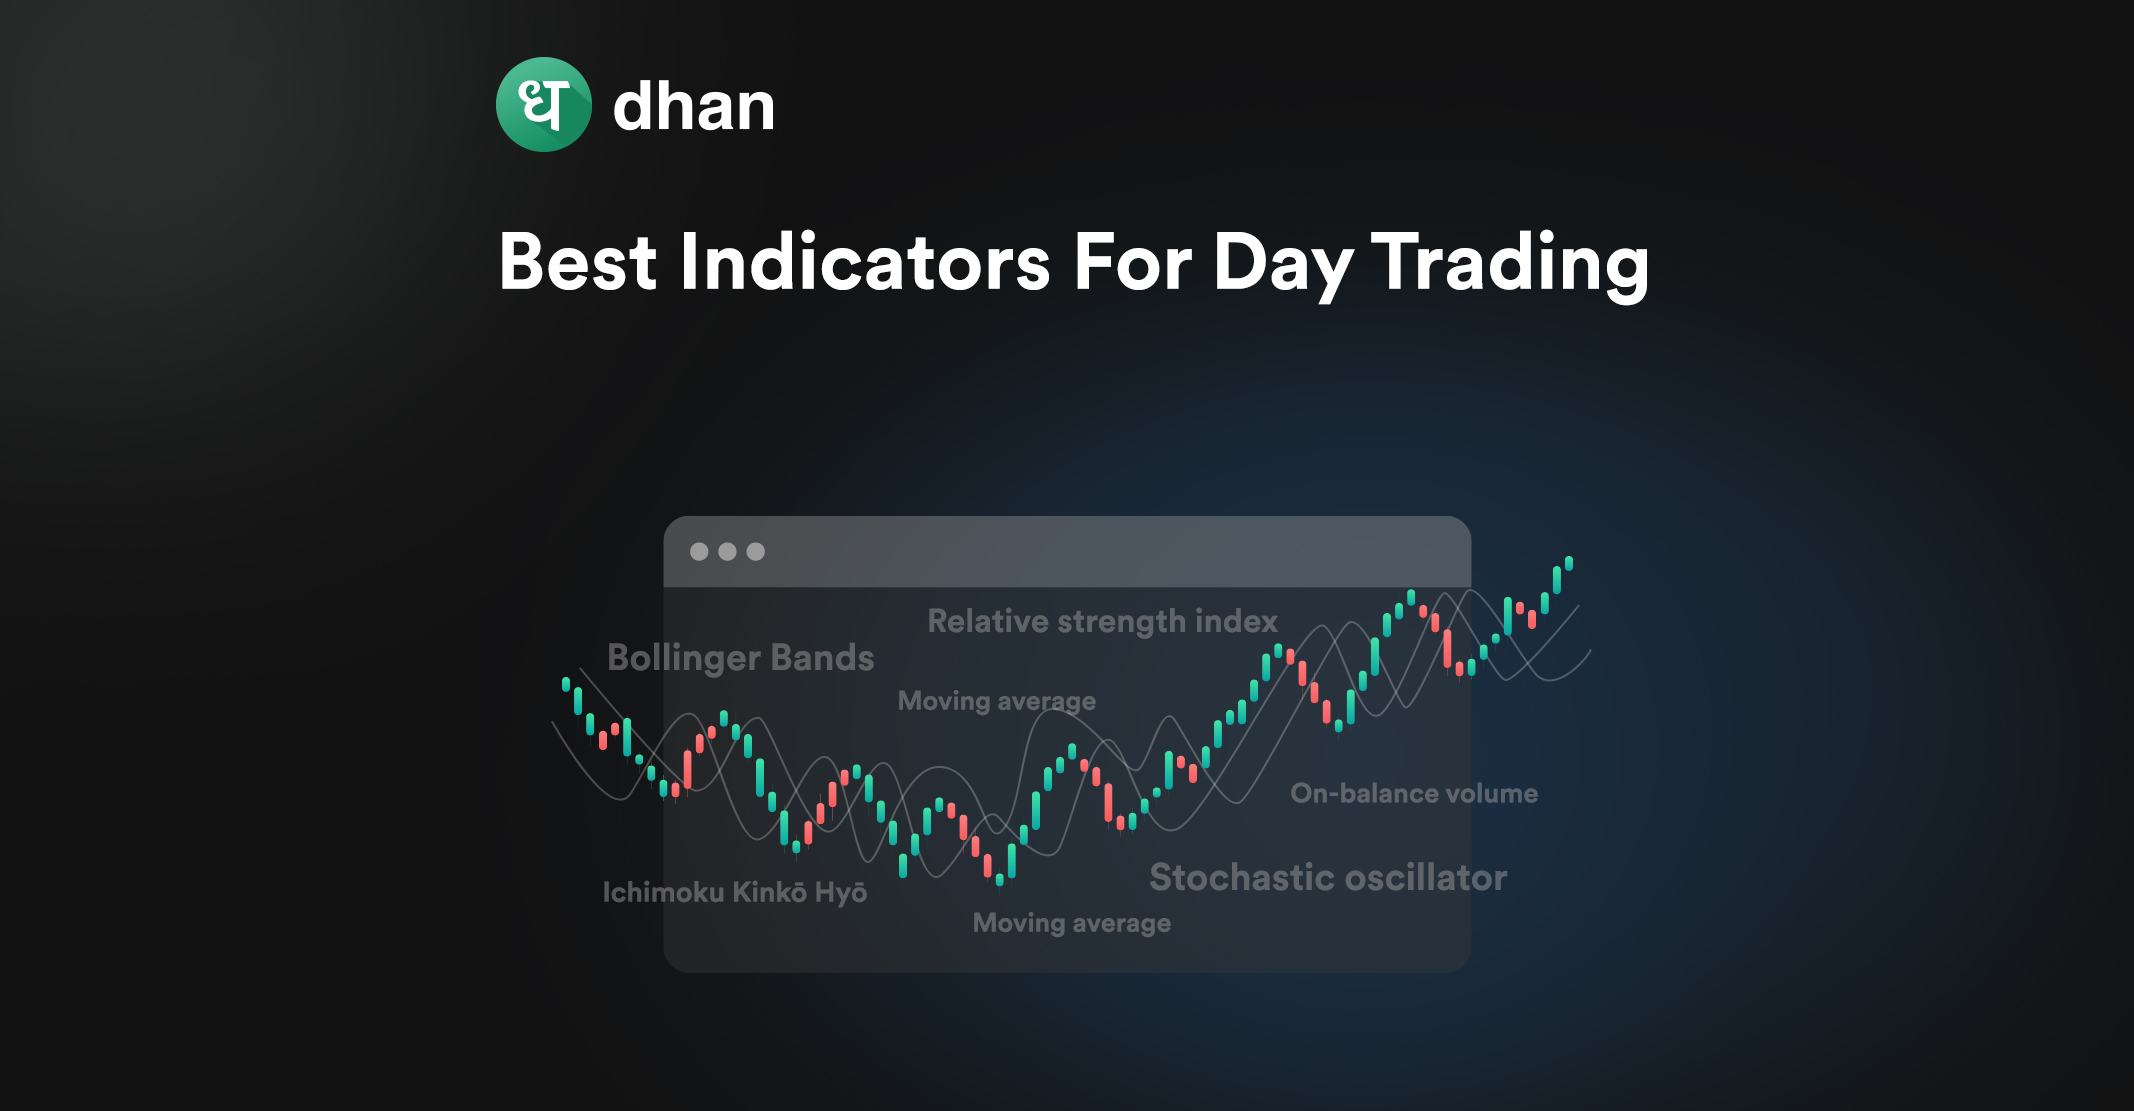
Let’s go one by one. There are a few key indicators that are typically used to trade this breakout:
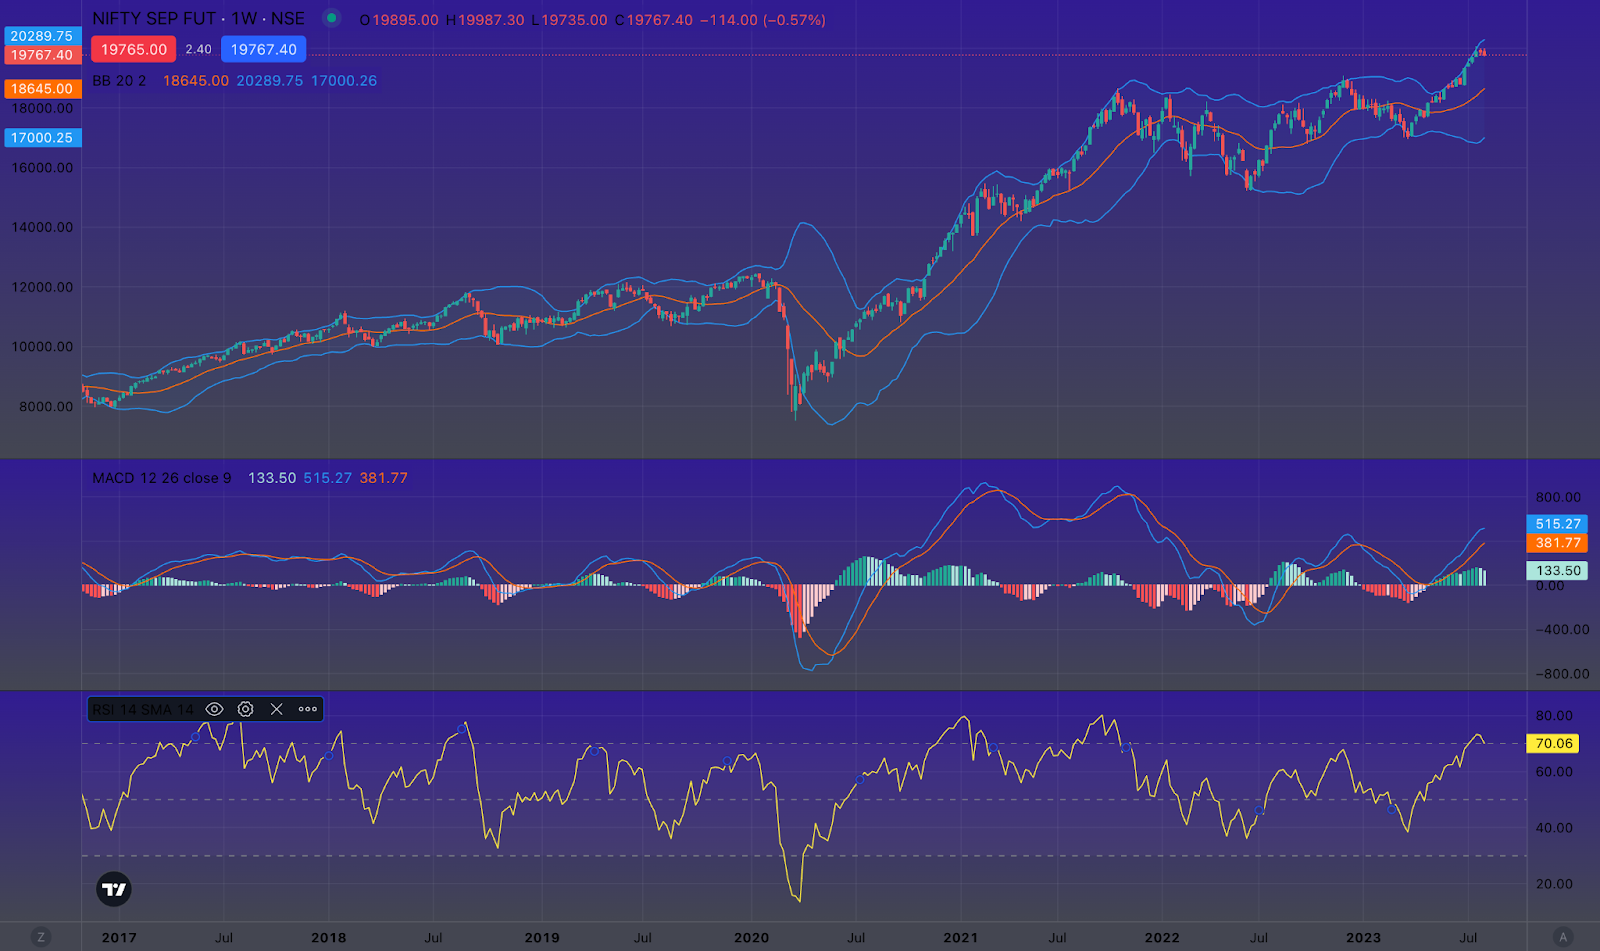
You can learn how to use each of these indicators by clicking on their respective names. The following image will give you a flavor of what each indicator looks like on charts.
On to entry and exit strategies. Crafting a winning trading strategy requires you to set a target for both entering and exiting a position based on your target for the trade.
You should prepare for not just the breakout but also instances like whipsaw in trading. Use a trailing stop loss and if you’re a Dhan user, you’ll have access to risk management tools like Trader’s Controls.
Applying the Ascending Triangle Pattern in Stocks
Once you know the intricacies of any candlestick pattern, the job is half done. However, it is important to spot these patterns and prevent your trading system from generating false signals.
Firstly, you’ll identify the pattern itself. It is characterized by the following:
- Flat horizontal upper line (swing high)
- Rising bottom line (swing low)
- Eventual intersection
- Upward trend
The key lies in spotting the trend at the right time and trading on it before it diminishes. See the chart below for illustrative purposes.
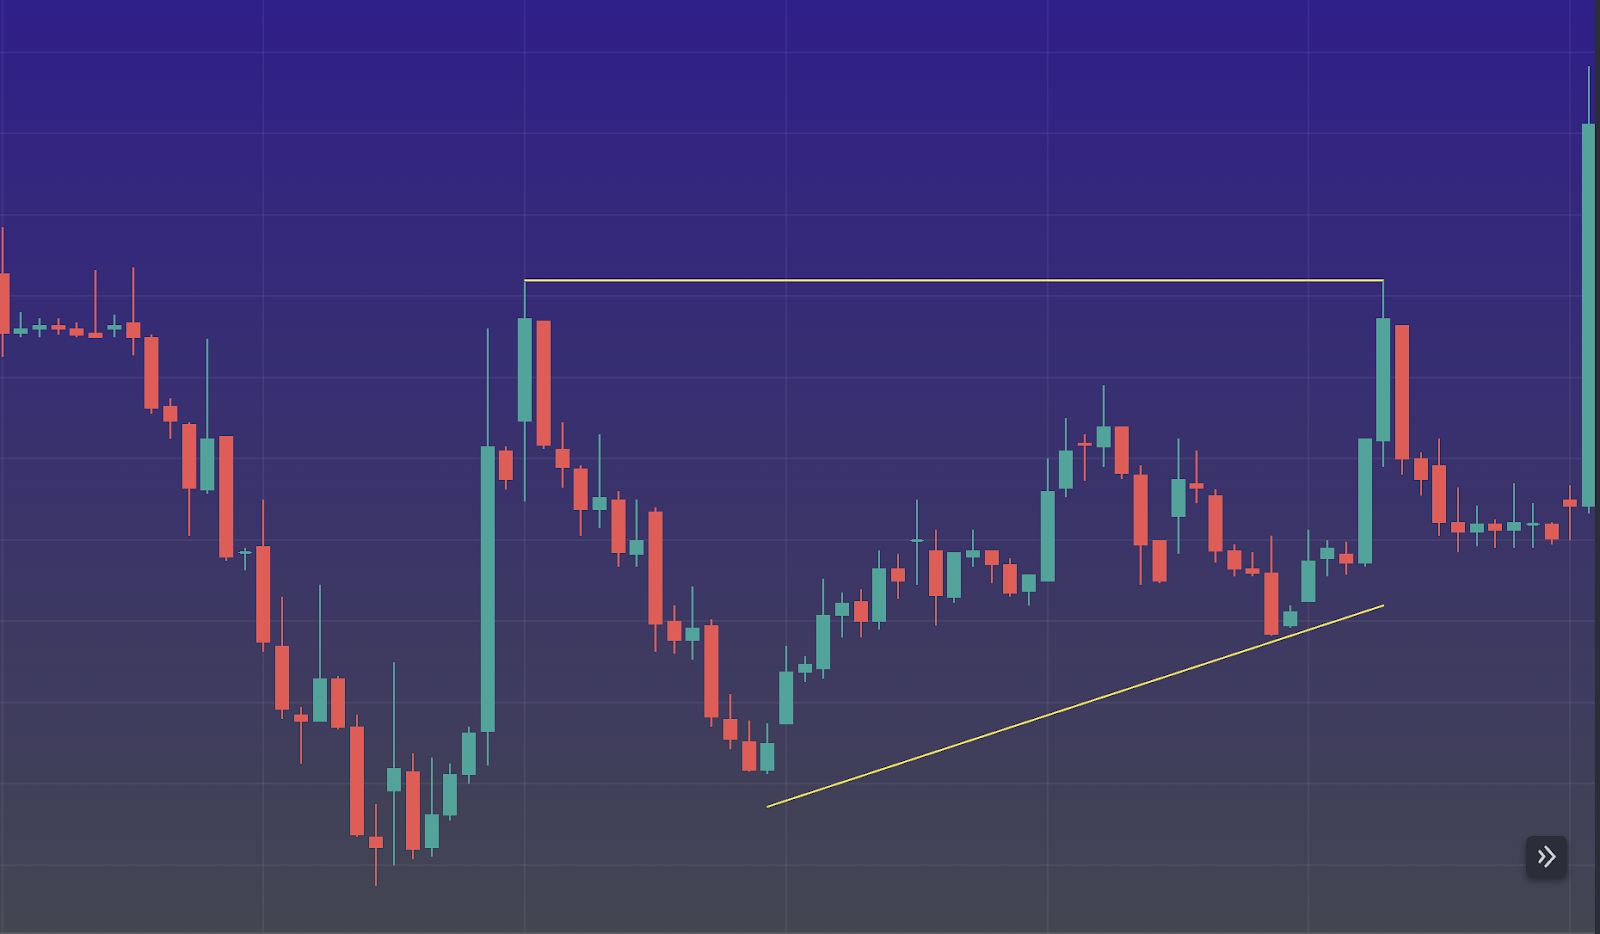
You can clearly see that these ascending triangle pattern stocks have given the breakout post forming the pattern.
The uptrend is clearly visible after the stock tested the resistance levels multiple times and formed higher lows forming an uptrend bottom line.
You can choose to go long past the second or third candle after the formation of the pattern, depending on how you seek to confirm the pattern.
The bulls take control and the stock in the above chart can be seen in an uptrend (though with minor pullbacks) to confirm the hypothesis of the ascending triangle pattern.
Strategies for Trading the Ascending Triangle Pattern
On confirming the ascending pattern, most traders would likely take a long position. You can do this by placing a “Buy” order or trade directly from charts and manage your positions from there.
However, you must be cautious about the false breakout or incomplete formation of the pattern.
The incomplete formation may be a result of choosing a shorter time frame than required for the pattern to form or due to any of the biases.
You can choose to trade in any timeframe like 5 mins, 1 hour, Daily, or even Monthly.
A security’s price may lead to a triangle pattern that ascends over a longer time frame. That’s why it’s optimal to follow a longer time duration, since you want the security to touch the resistance level and form higher lows.
After going long, you should place a stop loss to protect yourself from potential losses due to any adverse price movement, this should be part of every strategy.
You can even use Bracket Order or Cover Order to get the dual benefit of placing a stop loss with your entry (and exit) orders.
Is an Ascending Triangle Bullish?
Yes, an ascending triangle is a bullish pattern that many traders consider to be a green light for purchasing securities.
As you know by now, the horizontal top line and ascending bottom line indicate that buyers are pushing the price higher.
When these lines converge, a bullish breakout may be imminent. But the devil is in the details.
While the ascending triangle is a promising signal, it’s not a guarantee of a bullish trend.
You must look at other factors like volume and market trends to confirm the actual trend.
Conclusion
Ascending triangle pattern forms two lines – one horizontal line above the candle and one rising line below.
The price breaks out in the same direction before the whole triangle takes shape, which makes the ascending triangle a continuation pattern.
You can leverage this pattern and many more with ease on our platform and get access to a range of technical analysis tools.
If you like this blog, then you’ll love these:
FAQs
Q. What is the ascending triangle in price action?
The ascending triangle is a bullish pattern formed by a horizontal top line and a rising bottom line. These are known as swing highs and swing lows and the line itself eventually converges to go straight upward.
Q. What are ascending triangles in a downtrend?
Ascending triangles in a downtrend can signal potential bullish reversals.
Q. What is ascending and descending triangle pattern indicator?
Ascending and descending triangles are chart patterns used to identify potential bullish and bearish trends.