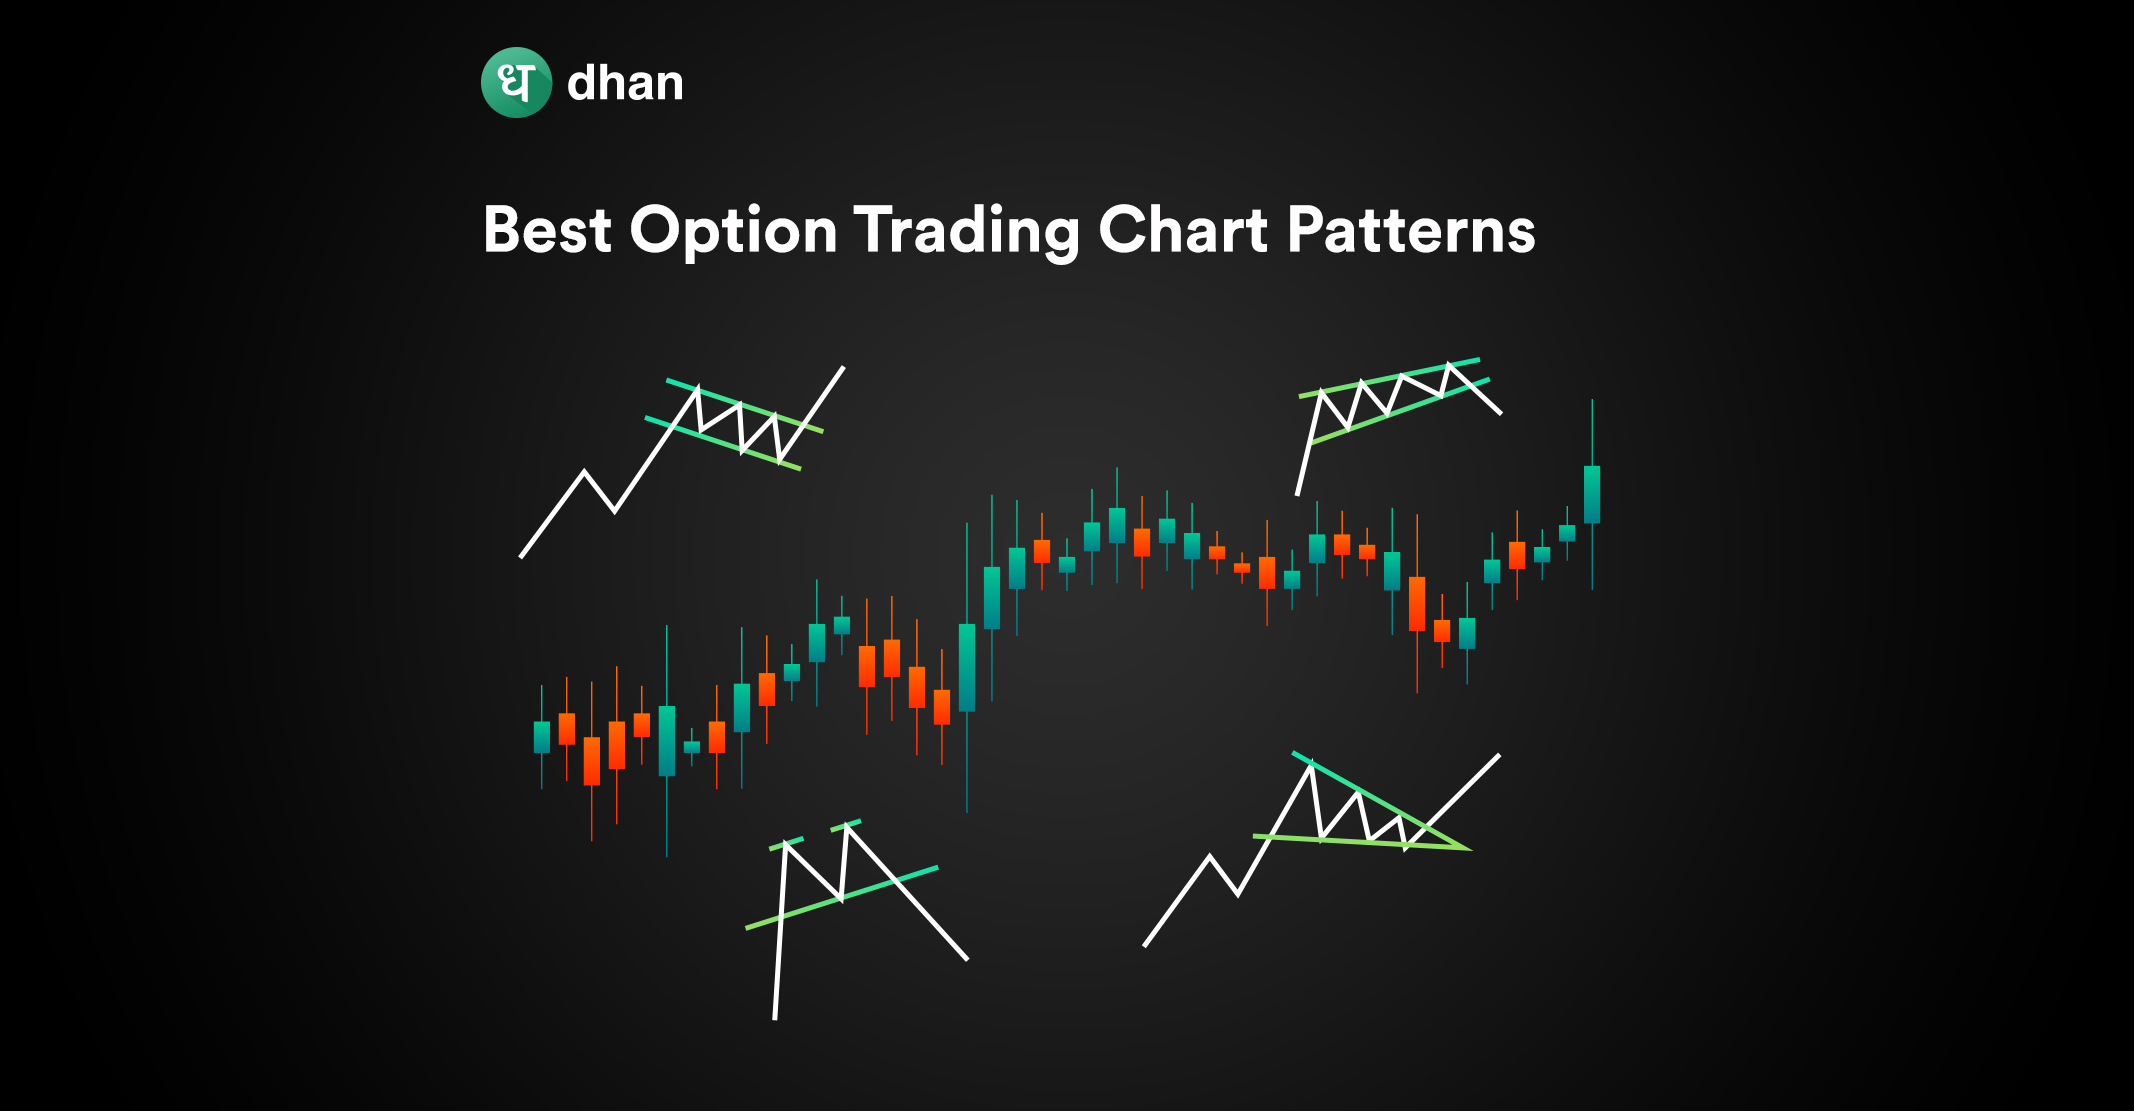
Chart patterns act as visual representations of market psychology and can indicate bullish, bearish, or neutral market conditions. The best traders in the world are known to identify the best option trading chart patterns amongst the many available.
The core goal of analyzing any chart pattern is to understand the future price of a financial instrument, in this case, options contracts. We’ll help you narrow down your research with a list of the best options trading chart patterns. But first…
What are Option Trading Chart Patterns?
Options chart patterns are specific formations or shapes that appear on price charts. These patterns are formed by the movement of price over time and can provide valuable insights into the future direction of an options contract’s price.
The role of chart patterns in technical analysis is to help you, as a trader, identify potential opportunities in the market. By studying and recognizing these patterns, you can decide when to enter and exit a trade while managing risk.
What you should note is that charts themselves come in various forms. Some of them are listed below:
Most traders stick to candlestick charts that look exactly like the name suggests. Check out the image below to know more.
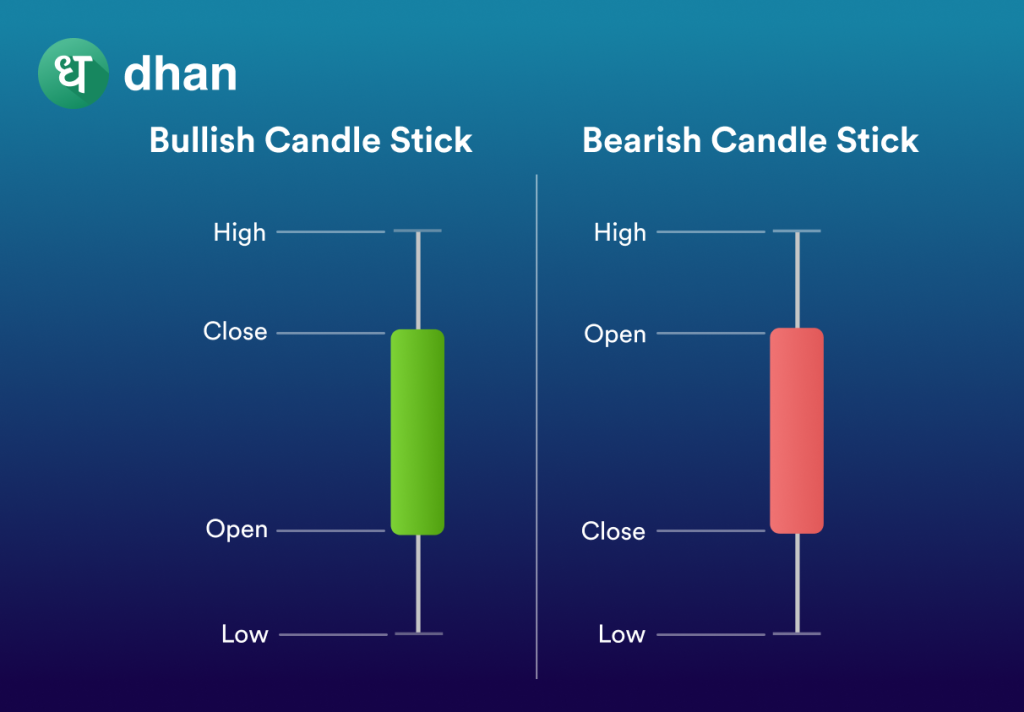
Candlestick charts operate on price and time. This means you’ll see green candles when the price is going up and red candles when the price is going down in relation to a timeframe you’ve chosen.
For example, a 1-hour candlestick will show you the net price movement in the options contract for every hour between 9.15 AM to 3.30 PM. Similarly, you can select multiple chart timeframes ranging from 1 minute to 12 months.
It is on these candlestick charts that you will find some of the best options trading chart patterns. Let’s get right into it.
Best Options Trading Chart Patterns
Chart patterns can vary depending on market conditions and individual trading strategies. However, several chart patterns are commonly used by traders and have shown effectiveness in identifying potential trading opportunities. Here are some of the best options trading chart patterns:
1. Bullish Patterns
Bullish patterns are chart patterns that suggest a potential upward movement in the price of an asset. When you see bullish patterns, buyers are gaining control, and there’s a higher likelihood of the price continuing to rise.
These patterns can help you identify potential buying opportunities and bullish trading strategies. Here are examples of the best bullish chart patterns for options trading:
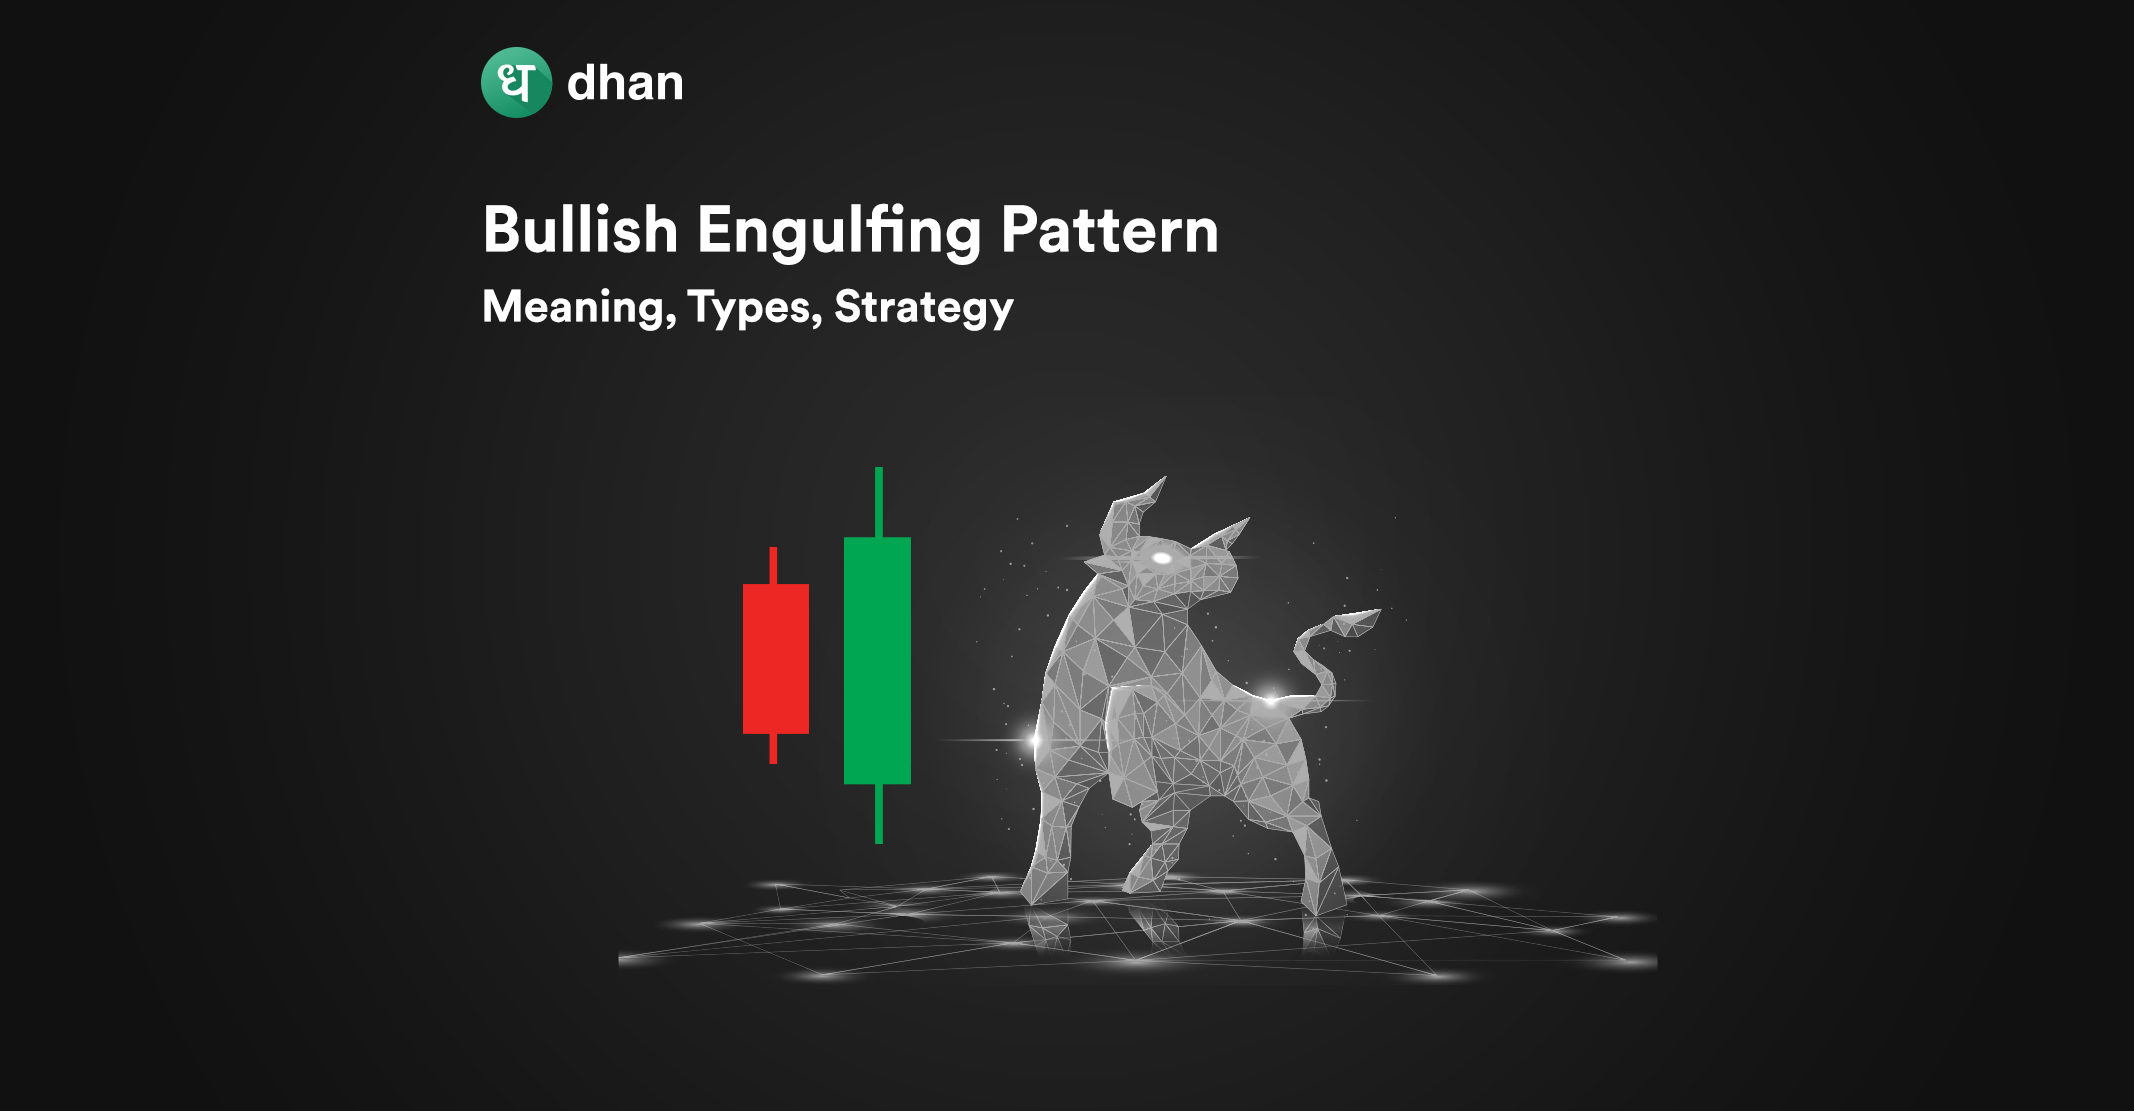
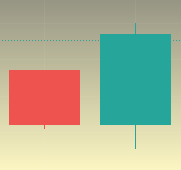
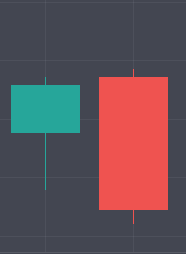
A. Bullish Engulfing Pattern
You can see this pattern on a chart when a red candle is completely engulfed from top to bottom by a subsequent green candle. The bullish engulfing pattern indicates a potential reversal of the downtrend and suggests a bullish bias.
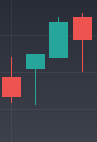
B. Hammer Pattern
A hammer pattern looks exactly like a hammer on charts. You’ll be able to see a hammer pattern when the price drops significantly but the security rallies to close above or near the previous candle’s high. It implies that buyers have stepped in and could signal a bullish reversal.
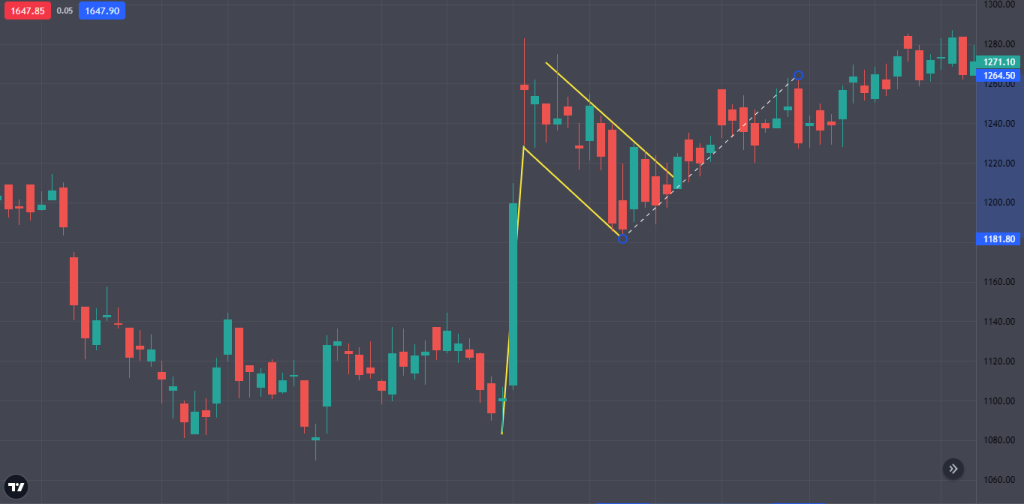
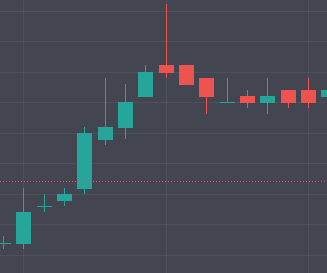
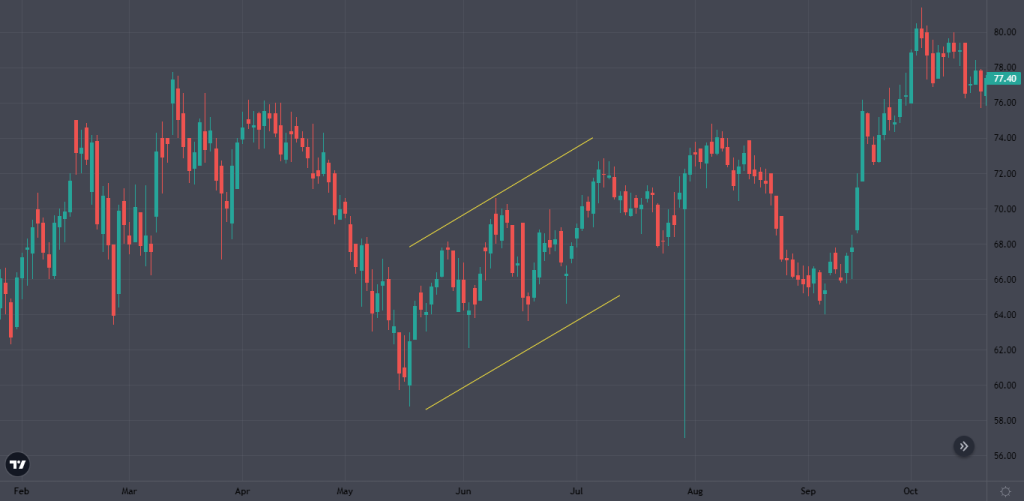
C. Bull Flag Pattern
The bull flag pattern is characterized by a sharp upward price movement followed by a consolidation phase in the form of a downward-sloping channel. Once the price breaks out of the channel, it suggests a continuation of the upward trend.
2. Bearish Patterns
Bearish patterns are options chart patterns that indicate a potential downward trend in the price of an asset, suggesting a selling opportunity for traders.
A. Bearish Engulfing Pattern
The bearish engulfing pattern stands as the direct counterpart to the bullish engulfing pattern. It occurs when a small bullish candle is followed by a larger bearish candle that engulfs the previous candle’s range. It suggests a potential reversal of the uptrend and indicates a bearish bias.
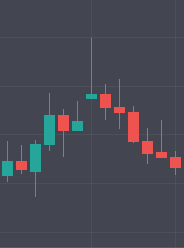
B. Shooting Star Pattern
A shooting star pattern forms when the price opens higher, then falls significantly to close near or below the opening price. It indicates a potential bearish reversal as sellers overpower buyers.
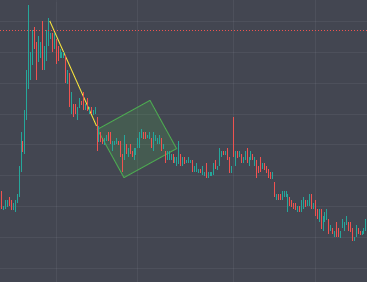
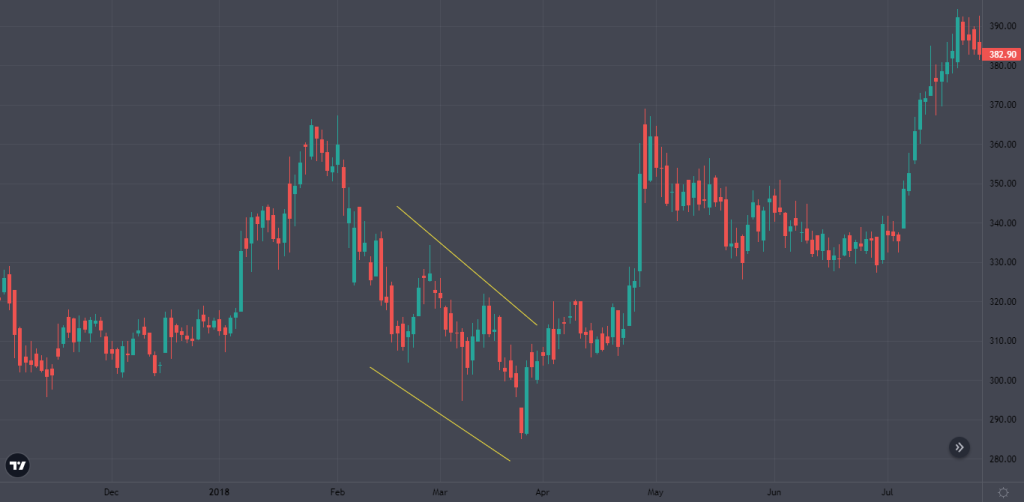
C. Bear Flag Pattern
Think of the Bear Flag Pattern as the opposite of the Bull Flag Pattern. It consists of a sharp downward price movement followed by a consolidation phase in the form of an upward-sloping channel.
A break below the channel suggests a continuation of the downward trend. Check the image below to know more.
3. More Options Chart Patterns
Neutral patterns are chart formations where the price consolidates within a specific range, indicating indecision between buyers and sellers. Breakouts from these patterns can result in either upward or downward movements.
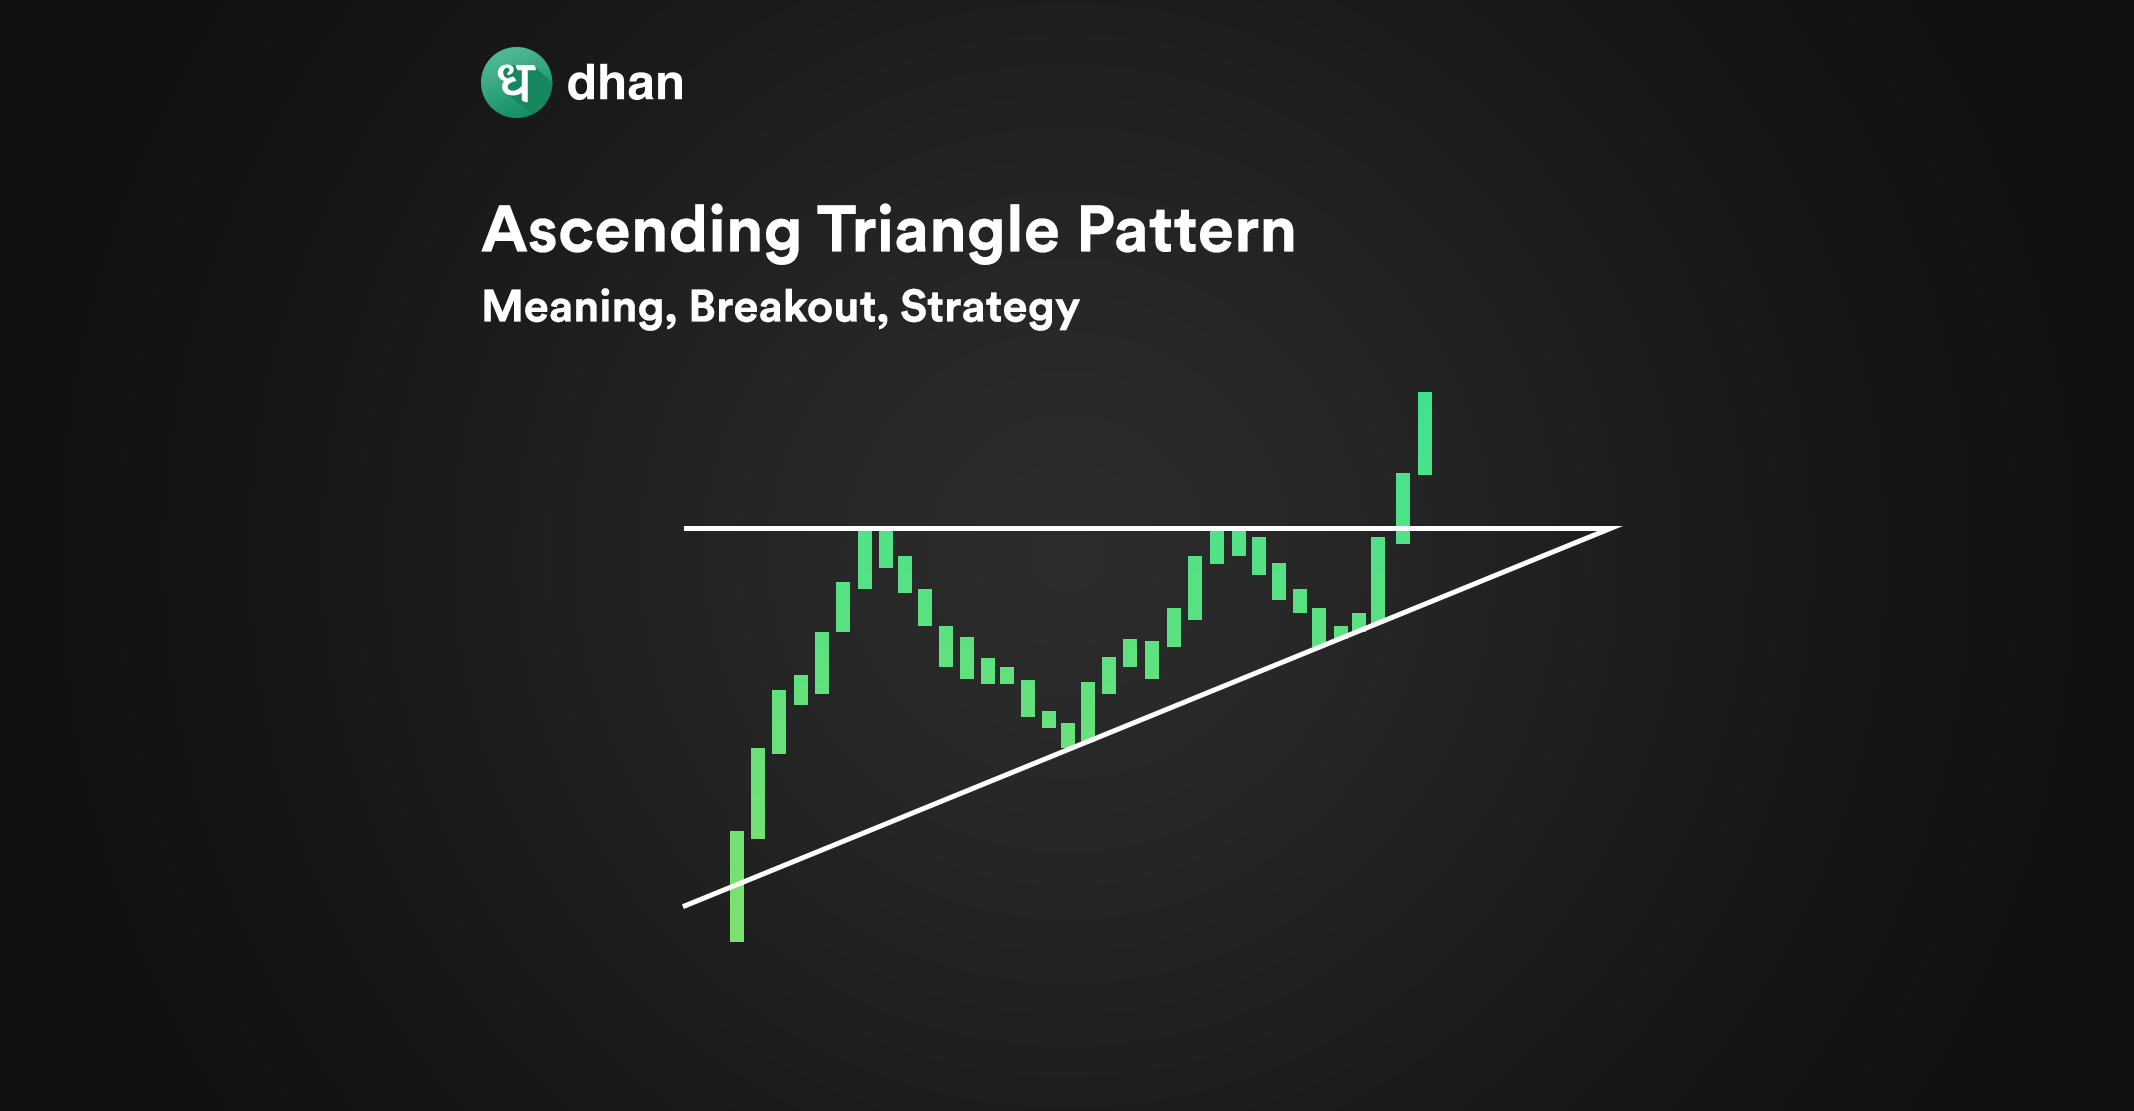
A. Ascending Triangle Pattern
If you see consecutive triangles on a chart that are rising upwards with a horizontal resistance line and a rising support line, it’s an Ascending Triangle Pattern. The pattern is an indicator of a potential upward breakout.
B. Descending Triangle Pattern
The Descending Triangle Pattern is the reverse of the Ascending Triangle Pattern with a declining support line and resistance line. It suggests a potential breakdown to the downside, indicating a continuation of the previous trend.
C. Symmetrical Triangle Pattern
There are times when the price of an options contract consolidates in a particular range. That’s when you’ll see a Symmetrical Triangle Pattern. The triangles will have similar slopes and would look like the image below.
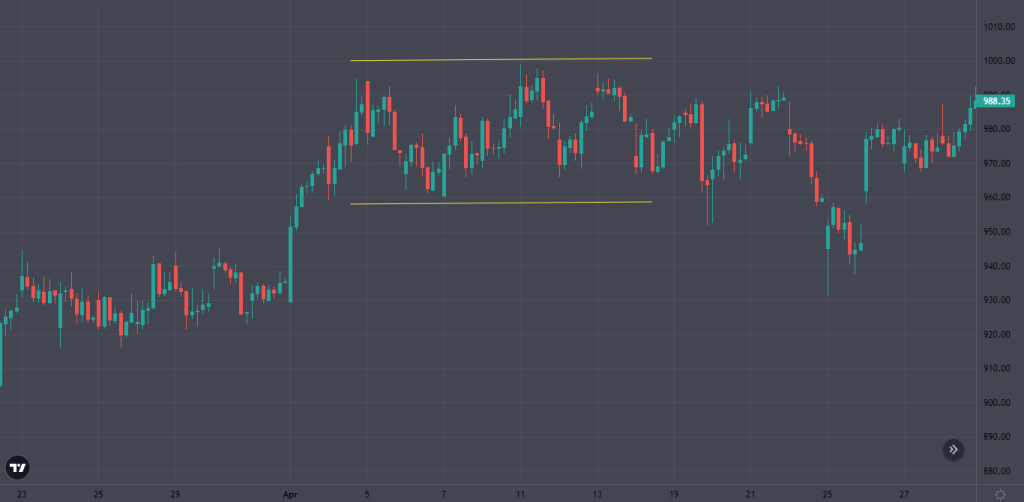
A Symmetrical Triangle Pattern indicates an imminent breakout, but the direction of the breakout may not be clear. You’ll have to typically wait for a breakout confirmation before taking action.
Why Use Best Option Trading Chart Patterns?
Confirming patterns can be useful to build your entry and exit strategies. By confirming a chart pattern, you can validate the reliability of a strategy and increase the probability of a successful trade in Finnifty options, Bank Nifty Options, and others.
Each pattern serves as a waypoint for future bullish, bearish, or neutral movements. At the same time, chart patterns may not always lead to what they’re supposed to.
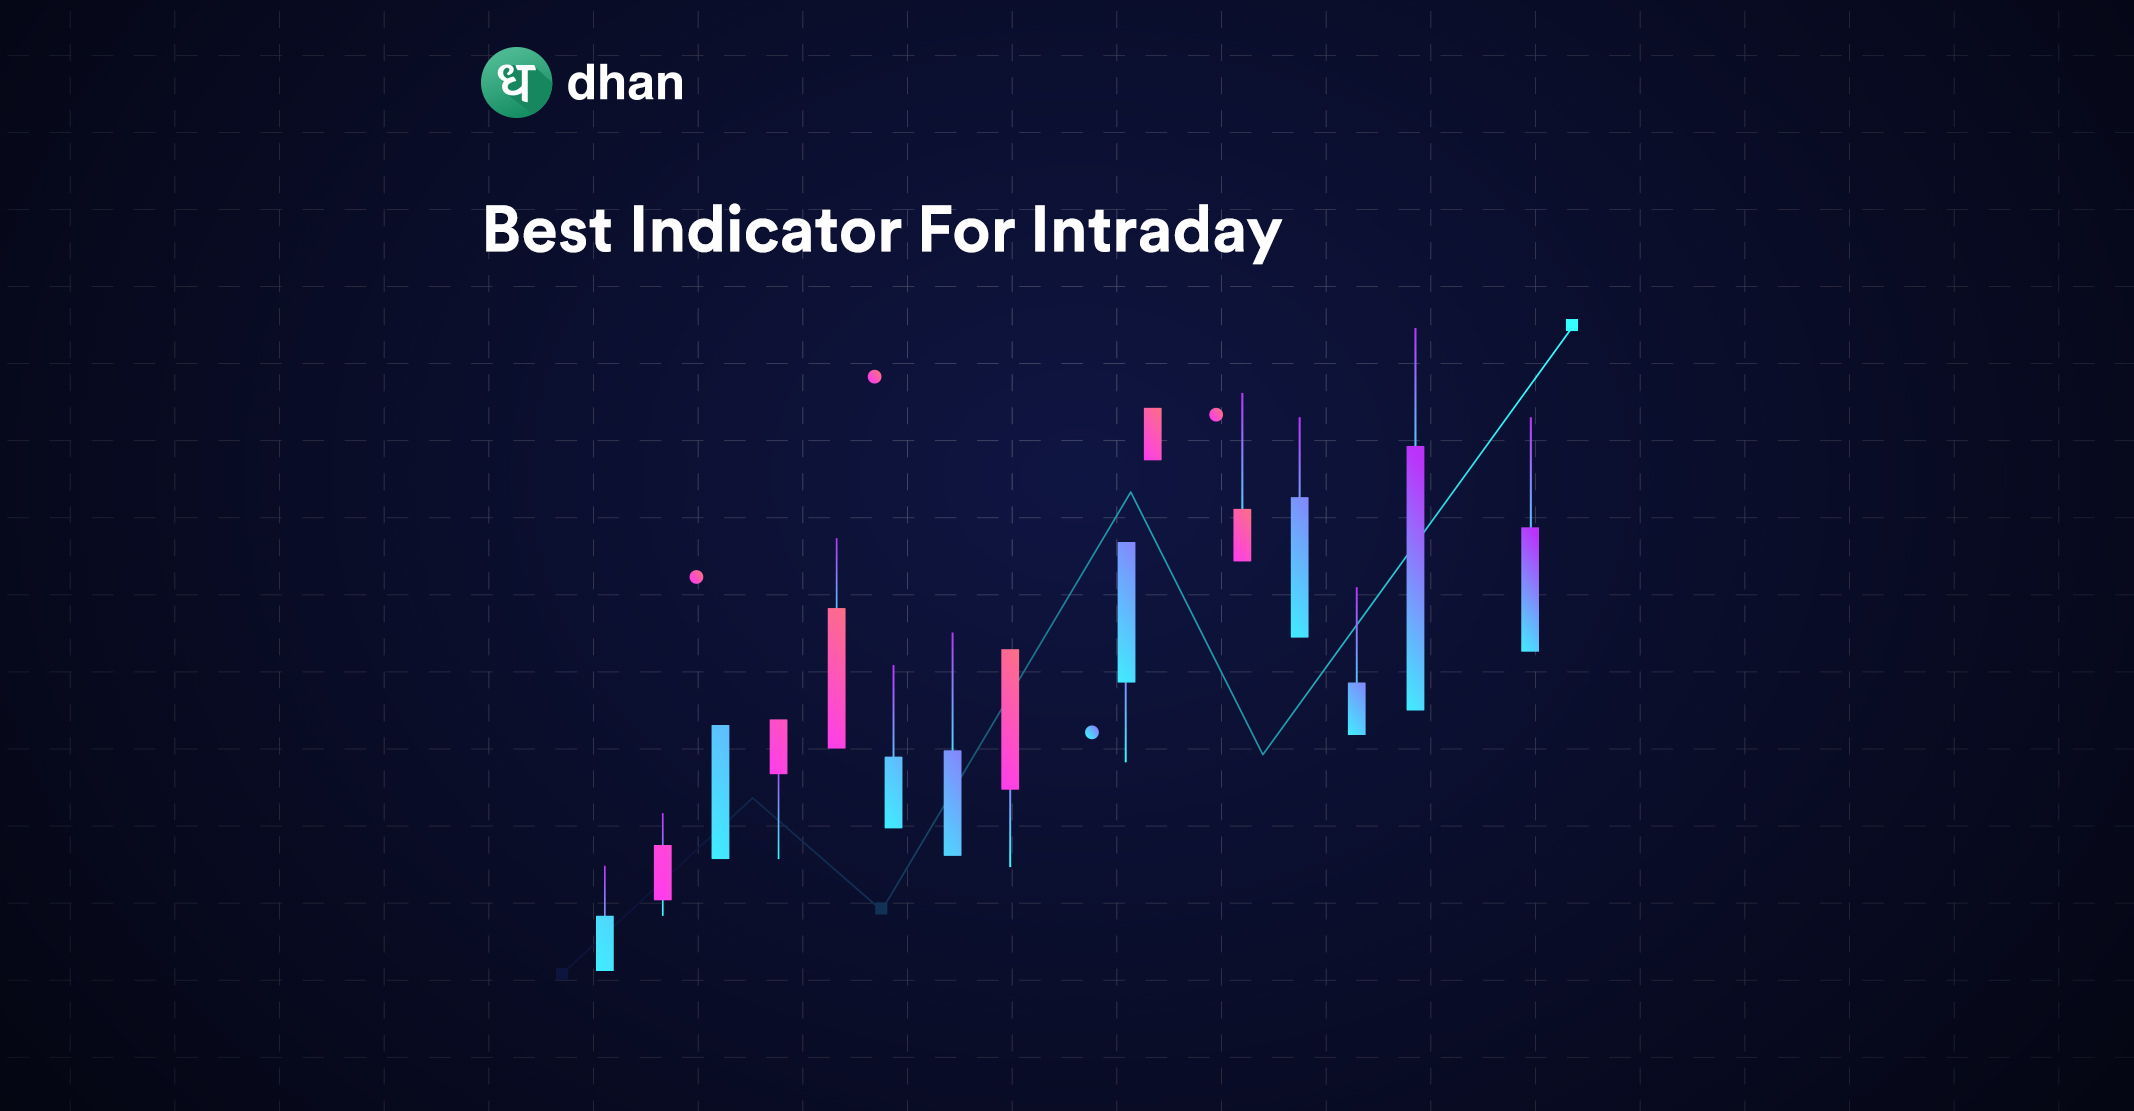
With the added help of technical indicators, you can avoid false signals and minimize the risk of entering into unfavorable positions due to relying on chart patterns alone.
Some of the most commonly used options trading indicators include the following:
Conclusion
Chart patterns play a crucial role in options trading, providing valuable insights into potential price movements. By identifying and understanding the best options trading chart patterns, traders can improve their decision-making process and increase their chances of successful trades.
Remember to confirm patterns, develop effective entry and exit strategies, and prioritize risk management. Continuously learning and practicing chart patterns will enhance your skills as an options trader.