NIFTY 200 Today
NIFTY 200 is trading at 14,407.15 on the NSE as of November 12, 2026 at 06:14 PM, up 39.85 points (0.28%) from its previous close of 14,367.30. In today's session, the index reached a high of 14,456.75 and a low of 14,314.85. Out of the 200 stocks in the index, 107 are trading higher and 92 are trading lower. PB FinTech, One 97 Communications and Kalyan Jewellers have added the most points to the index today. The 50 DMA stands at 13,487.36 and the 200 DMA is at 13,735.70.
Index Overview
- Open : 14,356.95
- Previous Close : 14,367.30
- Day's Range : 14,314.85 – 14,456.75
- 52-Week Range : 12,396.10 – 14,700.95
- Top Gainer : PB FinTech
- Top Loser : Page Industries



Get 20+ Chart Types, 180+ Indicators, 80+ Drawing Tools & Create Custom Indicators for FREE.
NIFTY 200 Stock Performance
Markets Today
High
14,456.75
Low
14,314.85
Open at
14,356.95
Prev Close
14,367.30
Volumes
0
Avg Price
0.00
Lower Circuit
0.00
Upper Circuit
0.00
Last Traded Details
Quantity
0
Time
18:14:45
Price Movement


Historical Performance
3 M High
14,456.75
3 M Low
12,757.90
1 Yr High
14,700.95
1 Yr Low
12,396.10
3 Yr High
14,833.75
3 Yr Low
10,459.05
5 Yr High
14,833.75
5 Yr Low
7,978.20
1-Year Performance
Market Insights
Positive Stocks
107
Negative Stocks
92
Neutral Stocks
1
NIFTY 200 Technicals
Moving Averages
Technical Indicators
Summary of Technical Indicators for NIFTY 200
NIFTY 200 Companies

Sorry, No Data Available at this Moment!

NIFTY 200 Sector Weightage
Sectors | Companies | Weightage  | Market Cap (Cr.) |
|---|---|---|---|
Energy | 9 | 8.46% | 30,28,164.34 |
Telecom | 4 | 4.47% | 16,00,315.48 |
Financial Services | 48 | 27.96% | 1,00,15,057.94 |
Information Technology | 10 | 7.09% | 25,39,782.33 |
Industrials | 2 | 1.72% | 6,15,088.56 |
FMCG | 14 | 5.57% | 19,95,953.57 |
Healthcare | 15 | 5.94% | 21,28,999.89 |
Services | 4 | 2.24% | 8,03,424.63 |
Consumer Discretionary | 29 | 11.73% | 42,02,256.67 |
Utilities | 9 | 4.71% | 16,85,135.33 |
Metals & Mining | 12 | 5.59% | 20,02,950.19 |
Construction Materials | 3 | 1.88% | 6,72,285.17 |
Consumer Services | 12 | 4.08% | 14,61,199.03 |
Capital Goods | 24 | 7.21% | 25,81,992.16 |
Chemicals | 5 | 1.35% | 4,81,978.13 |
NIFTY 200 Share Price History
NIFTY 200 Historical Returns

Sorry, No Data Available at this Moment!
NIFTY 200 Investment Returns
Short Term
1 Week
1 Month
3 Month
6 Month
9 Month
Long Term
1 Year
2 Years
3 Years
4 Years
5 Years
- In Short Term
- In Long term
1 Week
1 Month
3 Month
6 Month
9 Month

Create Wealth in Longterm with Weekly and Monthly SIP in Stocks.
NIFTY 200 Comparison
Sorry, No Data Available at this Moment!
NIFTY 200 Performers
Sorry, No Data Available at this Moment!
NIFTY 200 Mutual Funds
NIFTY 200 ETF
FAQs on NIFTY 200
How many companies are in NIFTY 200?
What is the NIFTY 200 share price today?
What are the historical returns of NIFTY 200?
- Past 1 year: -0.41%
- Past 3 years: 37.04%
- Past 5 years: 49.64%
What is the market capitalization of NIFTY 200?
Can you buy NIFTY 200 directly?
Is it possible to purchase the stocks of NIFTY 200?
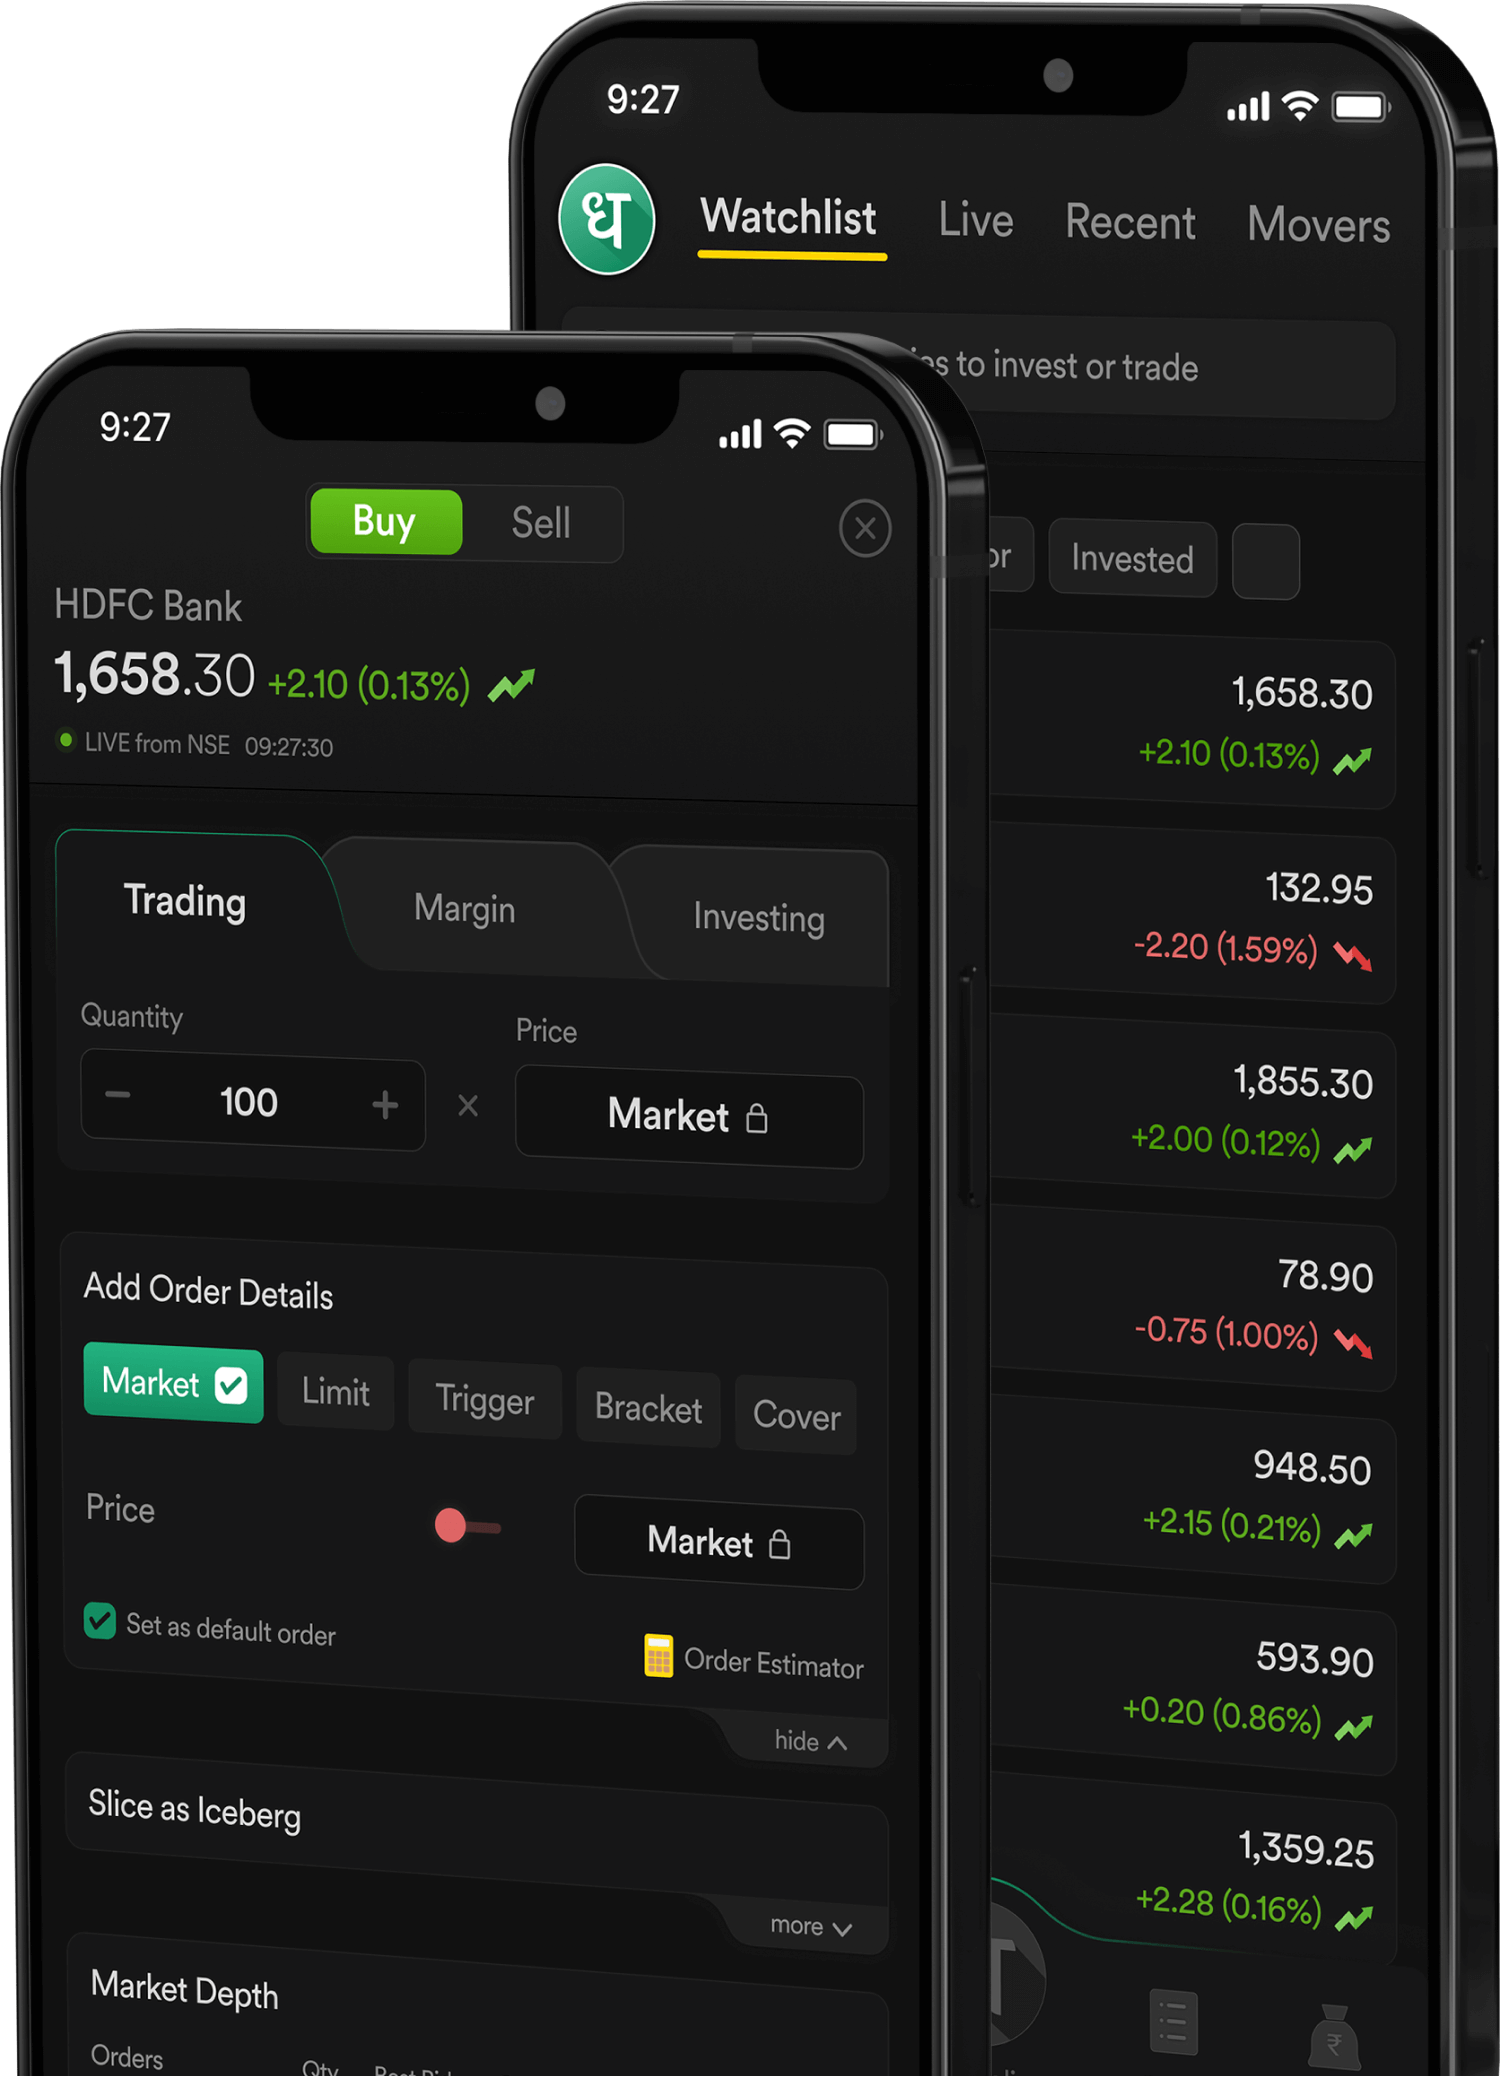
How to buy the stocks of NIFTY 200 on Dhan?
- Download the Dhan App to open a Open Demat Account
- Navigate to the “Money Tab”
- Add money to your account
- Search for the stock you want to buy
- Tap on “Buy”.

NIFTY 200

Pay Zero Brokerage on Delivery

Open FREE Demat Account

+91
Or Scan the QR Code to download the Dhan App