Understanding the flow of money in or out of a stock can help you as a trader gain insights into possible trends, reversals, and more. That’s why technical indicators like Chaikin Money Flow (CMF) exist. But should you use a Money Flow Indicator at all? Read to find out.
What is the Chaikin Money Flow Indicator?
The Chaikin Money Flow Indicator (CMF) helps you identify how much volume of money is flowing into a stock over a period of time, typically 21 days.
Using the weighted average of this data, the CMF helps generate trading signals, which are nothing but entry and exit points for a stock during a specific period of time.
The indicator is the brainchild of Marc Chaikin who created CMF in the 1980s. Much of his work revolved around the Accumulation/ Distribution Line, which also plays a part in the CMF.
Let’s take a step back. The flow of money is called accumulation and distribution. Accumulation happens when money is poured into a stock while distribution happens when money exits a stock.
The CMF indicator calculates the weighted average of accumulation and distribution and plots it over a range from +1 to -1.
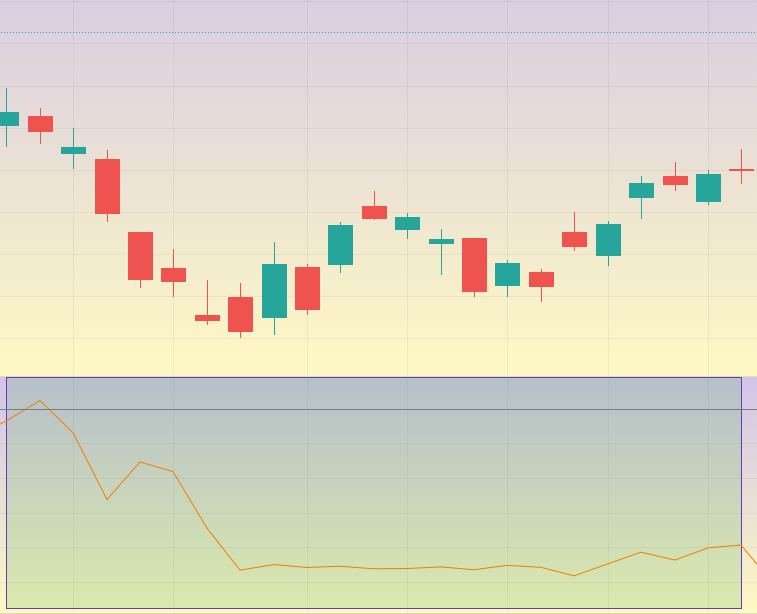
That’s why CMF is known as an oscillator, an indicator that floats around a range. The next image will show you what CMF looks like on a chart:
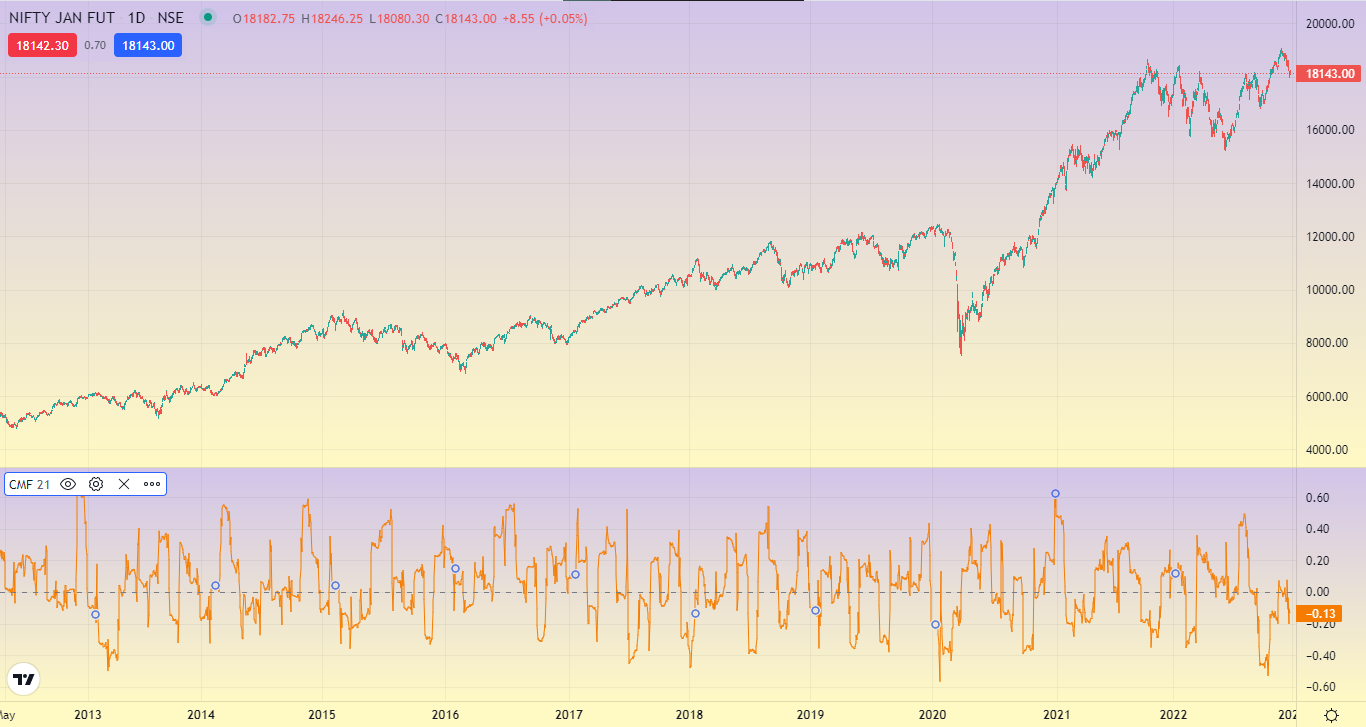
Question is, what can you do with this information. A CMF value close to +1 indicates buying pressure (more accumulation) whereas a value floating around -1 indicates selling pressure (more distribution).
You must be wondering what a CMF value of 0 indicates. It’s simple – there’s equal buying and selling pressure and the stock is most likely floating around a trendless state.
P.S: There are traders who engage with trendless instruments. In fact, this type of trading has a name – range trading – which we’ve covered in this blog: Top Forex Trading Strategies for 2022
Chaikin Money Flow Formula
We’ve established that the Chaikin Money Flow uses a volume-weighted average of money flow to generate trading signals.
As money flow is at the center of CMF, you’ll need to calculate two things related to it:
1. Money Flow Multiplier
2. Money Flow Volume
Once you’ve got the results of 1 & 2, calculating CMF will be a piece of cake.
The Money Flow Multiplier is calculated first by choosing a period which we’ve discussed is typically 21 days and then by:
- Subtracting the period’s low from the previous close
- Subtracting the period’s high from the previous close
- Subtracting A & B
- Calculating the period’s high minus low
- Dividing C by D
This is what you get as a result:
Money Flow Multiplier (MFM) = [(Close Price – Low Price) – (High Price – Close Price)] /(High Price – Low Price)
Next up is the Money Flow Volume, which is linked to the Money Flow Multiplier. To get it, simply multiply the MFM by the Volume for the same period. This is what you’ll see:
Money Flow Volume = MFM x Volume for the Period
Finally, you can calculate the CMF for a 21-day period with the following formula:
CMF Formula = Sum of Money Flow Volume for 21 periods/Sum of Volume for 21 periods
If you’ve got this far, well done. But the good news is that you don’t have to manually make any of these CMF calculations.
Modern-day charting tools and trading platforms do that for you. For example, you can use the CMF indicator on Dhan for free and customize it based on periods, timeframe, colors, and much more.
How Chaikin Money Flow Indicator Works
You already know that the CMF indicator works by taking a volume-weighted average of a 21-day period accumulation and distribution. Based on this, it oscillates between +1 to -1.
| Value | Meaning |
| +1 | Buying pressure |
| 0 | Flat (no trend) |
| -1 | Selling pressure |
Very rarely does it happen that a stock trades at the extremes (+1 or -1) as it would have to hit consecutive highs and lows over the 21-day period.
If the value moves to the positive territory, then the CMF is indicating that there’s buying pressure. If more people want to buy something, then the value of that something is likely to go up.
Furthermore, if the CMF value moves toward the negative territory, then it means that more people are looking to exit the stock, which means the price of the stock is likely to plummet.
The good news is that you need not rely on these two factors alone. There are three signals that CMF can generate.
1. Incoming Trends
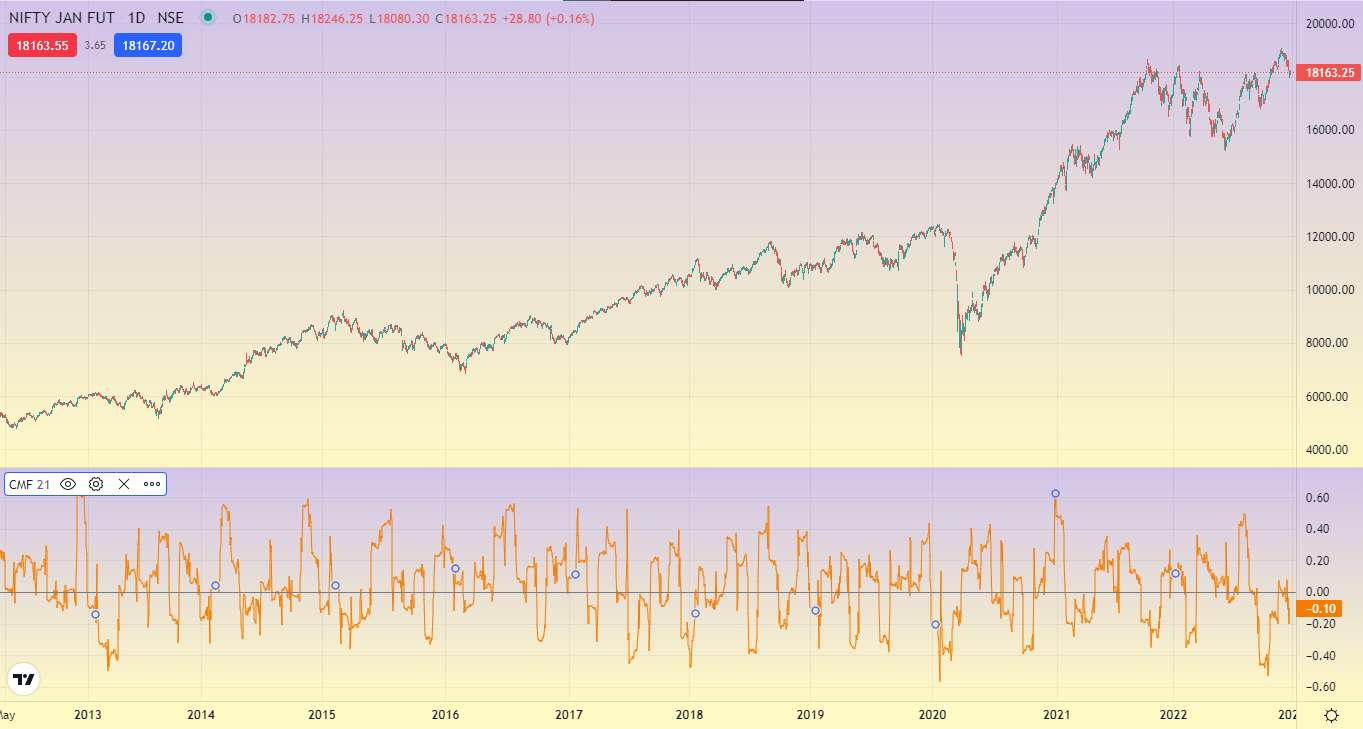
If the CMF value is consistently above or below 0, you have a bullish or bearish trend that can be used to enter and exit positions, generally in conjunction with other indicators for technical analysis.
Here are examples of both. Image #1 shows a period that has a consistently positive trend because the CMF value is above 0 at all times. This indicates more buying pressure.
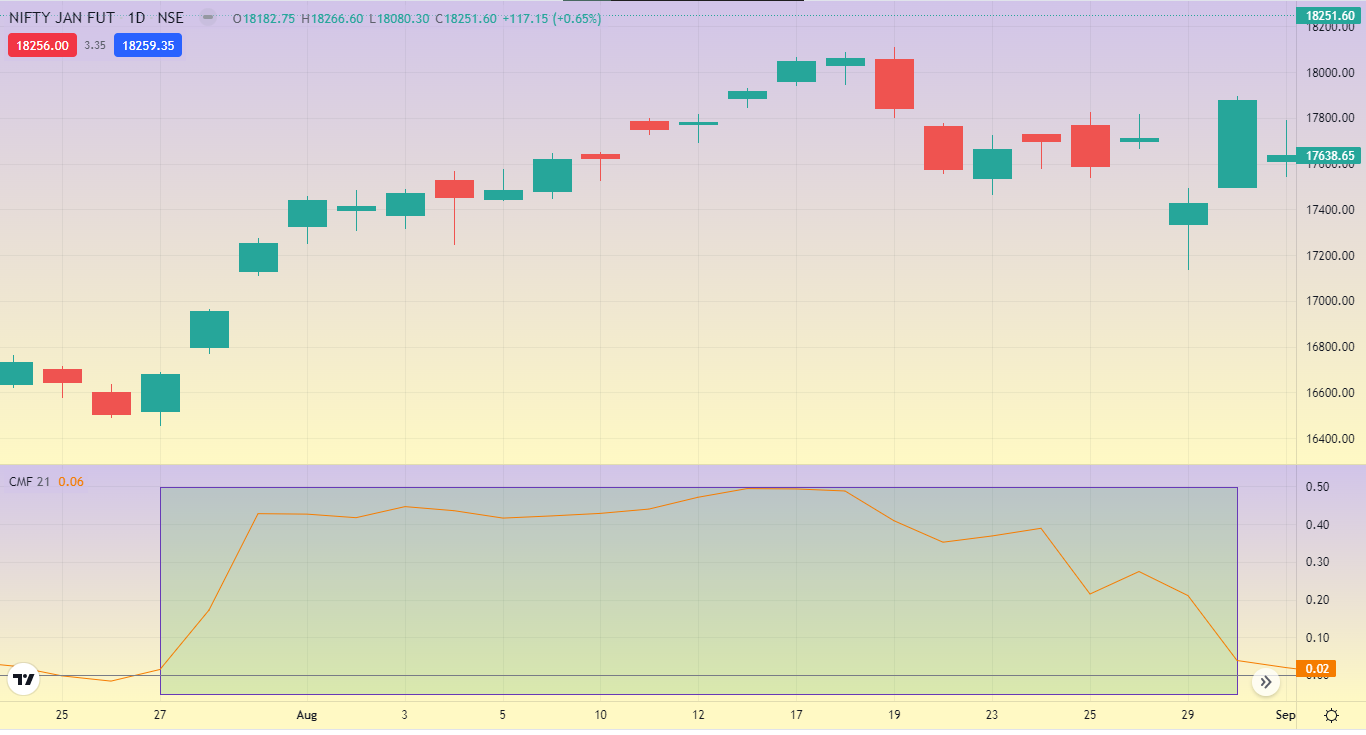
On the flip side, if the CMF value is consistently below the 0 line, then there’s selling pressure. You can see this in image #2 that’s been added below.
2. Trend Reversal
Apart from incoming trends, CMF can also tell you when a trend reversal is about to happen. A trend reversal, by the way, happens when a bullish trend turns to bearish or vice versa.
The easiest way to identify reversals with CMF is to look at the zero line. If there’s a movement from above to below the zero line, then the event is termed as a bearish cross.
This means the stock is entering the sell zone from the buy zone and is no longer bullish. A bullish reversal happens when the CMF line moves from the bottom to above the zero line.
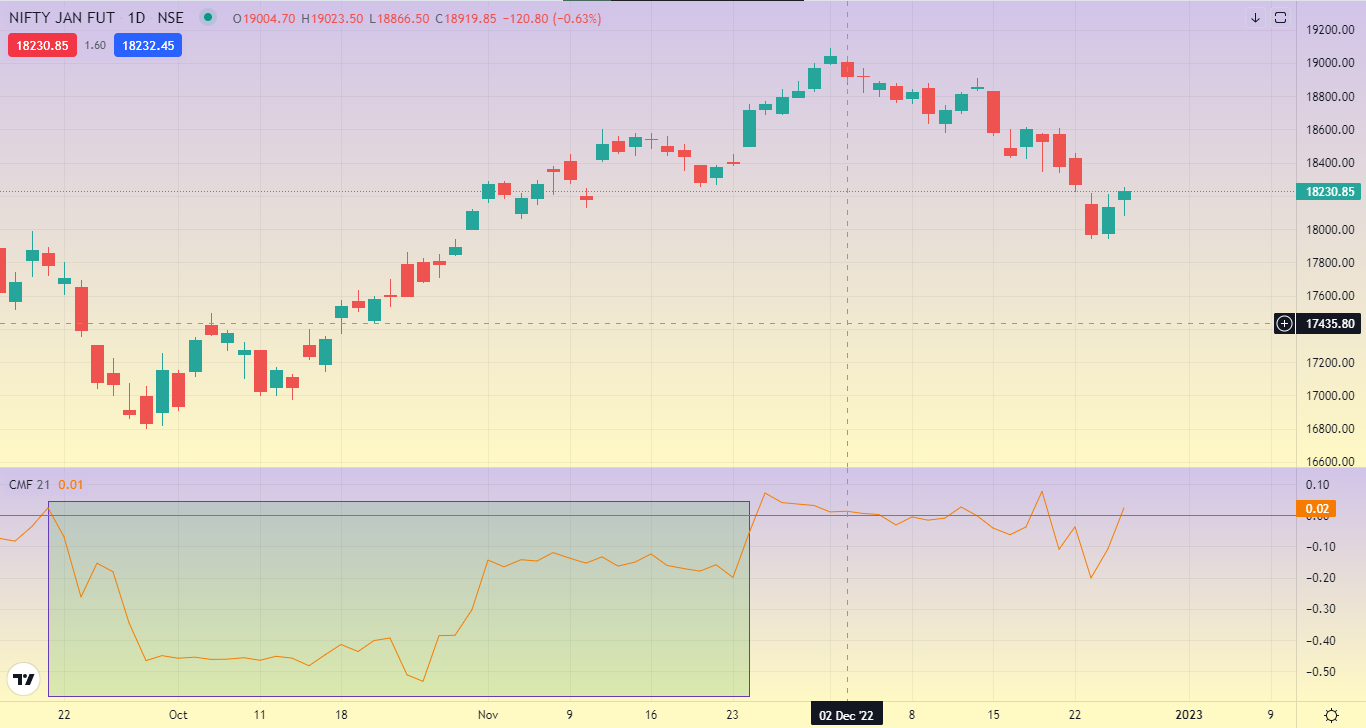
That said, CMF crosses can oftentimes be false trading signals. Look at the image below – the CMF line temporarily moves above zero but plummets soon after.
But CMF isn’t the only indicator prone to this. There are several indicators like Bollinger Bands in which you can observe a phenomenon called the head-fake – a false trading signal.
3. CMF Divergence
Across all screenshots so far, you must’ve noticed a rise and fall in the CMF line. However, did you notice the corresponding change in price levels? This is an important detail for two reasons.
One, a rise or fall in the price that does not correspond to a change in the CMF line indicates an impending reversal. Two, this phenomenon is known as a divergence, which is a trading signal.
You wouldn’t be surprised to know that traders use divergence as a part of their Chaikin Money Flow indicator strategy. But just like trend reversals, divergence may not always be an accurate trading signal.
Pros & Cons of Chaikin Money Flow Indicator
| Pros of Chaikin Money Flow | Cons of Chaikin Money Flow |
| Measures Buying Pressure | Doesn’t Factor in Market Sentiment |
| Identifies Potential Reversals | Sensitive to Price Gaps |
| Easy to Interpret | False Signals in Ranging Markets |
| Works Well with Volume | Doesn’t Factor Market Sentiment |
Conclusion
The Chaikin Money Flow Indicator is a useful indicator to understand whether money is flowing in or out of a stock at any given point in time. In fact, the indicator can generate three trading signals:
- Trends
- Reversals
- Divergences
That said, every technical indicator has pros and cons. We’ve already discussed CMF’s pros. The cons of CMF include false trading signals and the fact that it can’t help you set a stop loss.
Thus, it’s best to use CMF with other indicators to build a solid and reliable trading system. By the way, traders typically use CMF with MACD and RSI, both of which are widely used for technical analysis.
More blogs about technical indicators:
FAQs
Q. What is the Chaikin indicator?
The Chaikin Indicator is used to understand money flow, meaning the flow of money into a stock using a volume-weighted average.
Q. Is Chaikin Money Flow reliable?
Chaikin Money Flow can give you trading signals based on the volume of money that’s flowing in an out of a stock. But it is prone to producing false trading signals. That’s why CMF is typically used in combination with Chaikin Money Flow.
Q. How do you trade Chaikin Money Flow?
You can trade the Chaikin Money Flow in three ways:
- Trends: Values above or below 0 indicate bullish and bearish trends
- Reversals: CMF line moving above or below the 0-line after consistently being in the opposite direction indicates a reversal
- Divergences: When the CMF line doesn’t move in tandem with the price action, it’s a trading signal
- Like this? Then you’ll love these blogs:
- Forex Market Hours & Holidays in India for 2023
- Currency Derivatives: Meaning, Types, Uses, & More!
- Types of Currency Pairs for Trading in India