Momentum oscillators are quite popular in the world of technical analysis, especially when it comes to intraday or swing trading. The Aroon Indicator is also a momentum indicator but has a unique characteristic that makes it different.
What is the Aroon Indicator?
The Aroon Indicator is a system of two technical indicators that determines the presence or strength of a trend. Aroon can also be used to identify temporary price reversals known as retracements or periods where a security trades within a range known as consolidation or range trading.
Developed by Tushar Chande in 1995, the Aroon consists of the Aroon Up and Aroon Down indicators in which:
- Aroon Up measures the time since the last high
- Aroon Down measures the time since the last low
This is where the Aroon is different from other momentum oscillators. Instead of showing price relative to time, the Aroon Up and Aroon Down combine to deliver the time relative to price.
By the way, some traders might call Aroon Up as Bullish Aroon and Aroon Down as Bearish Aroon – both are interchangeable names for the two Aroon indicators.
The question is, what can you do with the information displayed by the Aroon indicator.
The answer is, higher Aroon values indicate that there’s a strong trend present. Conversely, lower Aroon values indicate that there’s either a weak trend or no trend at all.
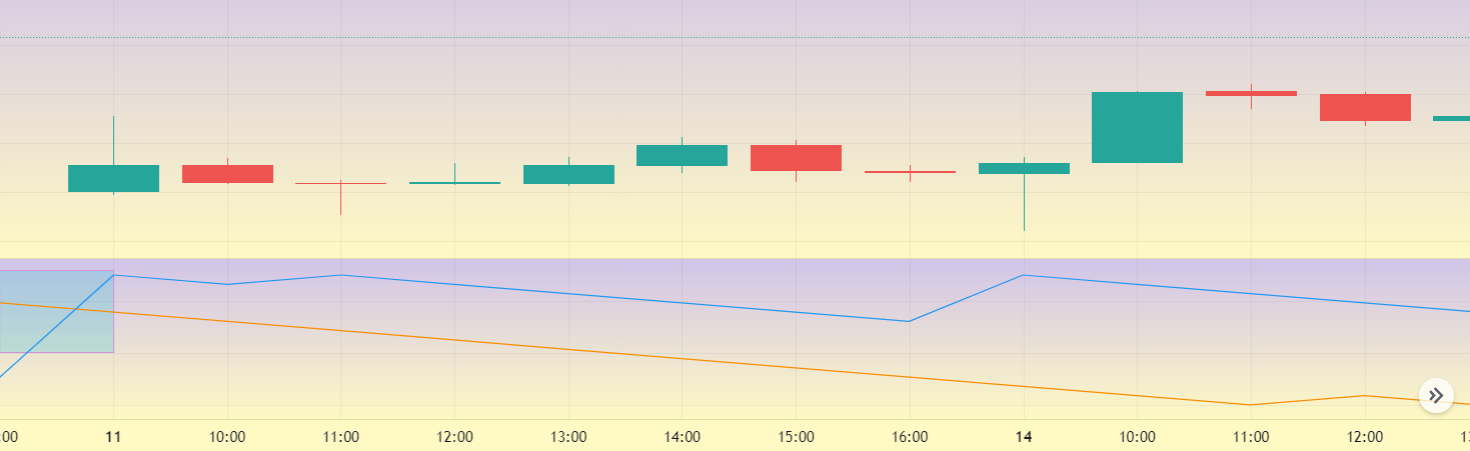
See the image below to know what the Aroon Indicator looks like on a candlestick chart.

Interpreting Aroon Indicator Values
If you’ve got eagle eyes, you must’ve noticed that the Aroon Indicator box at the bottom of the image above shows two percentages.
First off, yes – that’s how the Aroon indicator and its components look like on a chart. They’re shown in a separate box. Secondly, percentage Aroon values indicate the time since the last high or low.
On our chart, the golden percentage displays the value of Aroon Up and the blue percentage represents the value of Aroon Down, corresponding to the color of the two Aroon lines.
Before we move on, a small note. The cool part about the Aroon Up and Aroon Down is that you get to choose the number of periods (timeframe) across which the indicator should work on.
As a result, you’ll get percentage values ranging from 0-100 for your chosen timeframe. A higher percentage means that there’s a strong trend presence.
If you see 100%, then it means that the most recent high or low is within the timeframe you’ve chosen and that a new trend is imminent. The opposite is true when Aroon values are closer to 0.
Here’s a complete interpretation of all Aroon Indicator values:
- Aroon Up = 100: the beginning of a new uptrend
- Aroon Up = 30 to 70 while Aroon Down = 0 to 30: possible uptrend on the way
- Aroon Down = 100: the beginning of a new downtrend
- Aroon Down = 30 to 70 while Aroon Up = 0 to 30: possible downtrend on the way
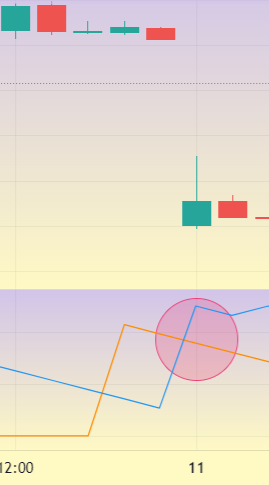
There are times when the Aroon Up and Aroon Down intersect or crossover. This phenomenon has a name – Aroon Crossover. See the image below to understand the phenomenon.
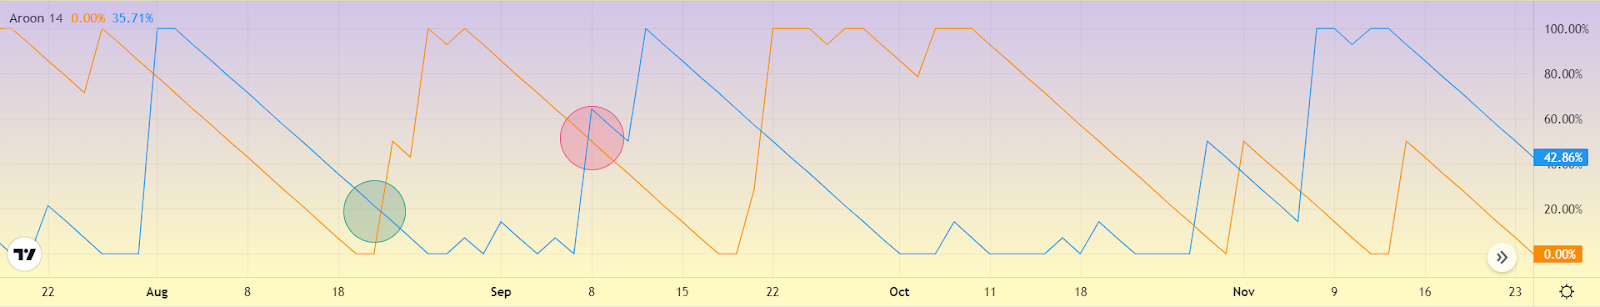
- A new uptrend is believed to be in motion when the Aroon Up crosses the Aroon Down (highlighted in the green circle)
- A new downtrend is believed to be in motion when the Aroon Down crosses the Aroon Up (highlighted in the red circle)
- If the Aroon Up and Aroon Down are in the same range without crossing, then the price is consolidating or range trading
These Aroon crossovers can be used as trading signals, with Aroon Up moving above Aroon Down being a Bullish Crossover and the Aroon Down moving above the Aroon Up being a Bearish Crossover.
The “100” value is an early sign that can help traders and analysts plan for an oncoming trend or reversal.
But… the Aroon Indicator can generate false trading signals. That’s why it would be wise to use Aroon in conjunction with other indicators.
P.S.: Aroon isn’t the only indicator that’s prone to false trading signals. Bollinger Bands too can generate a “headfake”, which we’ve covered in this blog about Bollinger Bands Indicator.
Example of Aroon Indicator Strategy
Meet Mr. Arun – he’s a trader who loves the Aroon Indicator because it sounds exactly like his name.
In fact, he’s been Aroon trading currency futures for the past year and likes to split the trading signals from it into two types:
1. Crossover
2. Value
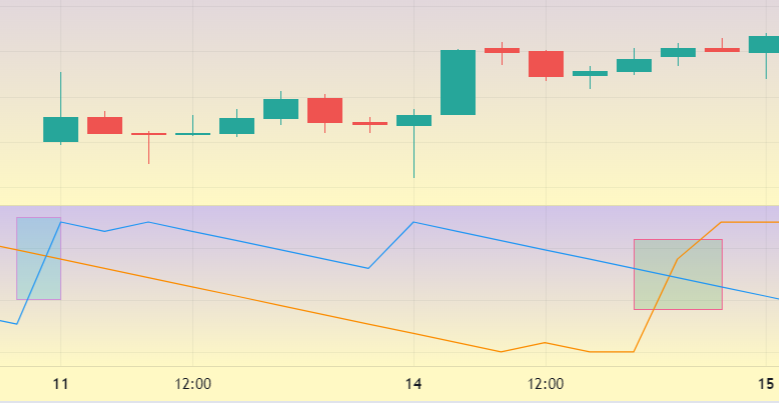
One fine morning on the 11th of November, his Aroon indicator generates the first signal. It’s a crossover. This is what Mr. Arun sees on his candlestick chart.
Being the shrewd trader he is, Mr. Arun checks the value of the Aroon Down when it crosses over the Aroon Up. It’s a solid 99%. Now both his trading signals are in motion.
What should he do at this point? Take a minute to think about it.
Alright, if your answer was to buy low and sell high – you’re right! Mr. Arun will have to execute a buy order for this particular currency futures so that he can sell later.
Considering he’s a swing trader, he has the luxury of waiting for a few days or weeks before hitting the sell button. Over the next few trading days, the trend is pretty much in favor of the bears.
Until… there’s another crossover on the 14th of November. This time around, the golden line crosses above the blue line, which means that the bulls are taking control.
What would you do in this situation – wait or sell immediately?
Mr. Arun hits the sell button and books a profit of 3800 PIPs, which is approximately Rs. 380. Note: we’ve avoided complex concepts like margin and leverage for the sake of simplicity.
How to Calculate Aroon Indicator Formula?
The best part about modernity is that you don’t have to know how calculations work. Online trading platforms and their systems take care of that for you.
If you’re still curious, then read on. The Aroon Indicator is made up of two components. You’ll have to calculate both in order to get an accurate reading from the indicator.
Start by calculating the Aroon Up, whose formula is as follows:
Aroon Up = [Timeframe – # of Days Since Recent High] / Timeframe
Then move on to calculating the Aroon Down, whose formula is as follows:
Aroon Down = [Timeframe – # of Days Since Recent Low] / Timeframe
Once you’ve got both values, multiply each by 100 to get a percentage and that’s it! This is how the formula behind the Aroon Indicator works in a nutshell.
Conclusion
The Aroon Indicator helps identify bullish and bearish trends and their strength with its two components – Aroon Up and Aroon Down.
When these two components crossover, a trading signal is generated and the phenomenon is known as an Aroon Crossover.
However, the Aroon Indicator is prone to generating false signals. That’s why traders generally use Aroon with other indicators like the RSI.
More technical indicator blogs:
FAQs on Aroon Indicator
Q. Is Aroon indicator accurate?
The Aroon indicator can generate trading signals that are not always accurate, especially in cases where the trend has already begun but the indicator picks it up later (or much later).
Q. How do you trade the Aroon indicator?
You can trade in two ways using the Aroon indicator:
- Based on values
- Based on crossovers
| Aroon Up Value | Aroon Down Value | Signal |
| 30-70 | 0-30 | Uptrend |
| 0-30 | 30-70 | Downtrend |
| 100 | – | Uptrend |
| – | 100 | Downtrend |
| Aroon Up Position | Aroon Down Position | Signal |
| Above | Below | Uptrend |
| Below | Above | Downtrend |
| Flat | Flat | Ranging (flat) |
Q. Is the Aroon indicator a lagging indicator?
Depending on how you look at it, the Aroon oscillator can be leading or lagging. At its core, the indicator attempts to determine trends right before or as they happen. That’s why it falls in the category of a potential leading indicator. However, the trading signals that Aroon generates can be late and as a result, it is also a lagging indicator.
Like this? Then you’ll love: