Online stock trading is all about spotting trades efficiently and what better way to do so than with technical indicators. Oscillators are known to work well in this regard and in this blog, we’re going to talk about the Awesome Oscillator Indicator.
What is the Awesome Oscillator Indicator?
The Awesome Oscillator is a technical indicator that helps identify market momentum by analyzing price changes relative to past behavior. It compares the price movements of two moving averages and plots them on either side of a central zero line.
One moving average is fast and typically takes 5 recent periods into account. The other moving average is slow and takes 34 periods of historical data for calculation.
Moreover, the Awesome Indicator incorporates the median price of a set of candlesticks instead of the closing price which other indicators use. Not to forget, the AO is an oscillator which means that it can return a positive or negative value.
As a result, there are two things you can observe while using the indicator. If the Awesome indicator floats above the zero line, it means that security is bullish but the momentum may swing towards bearish.
Similarly, if the Awesome indicator floats below the zero line, the security is bearish but the momentum may swing towards bullish. The creator of the Awesome Oscillator Indicator, Bill Williams,
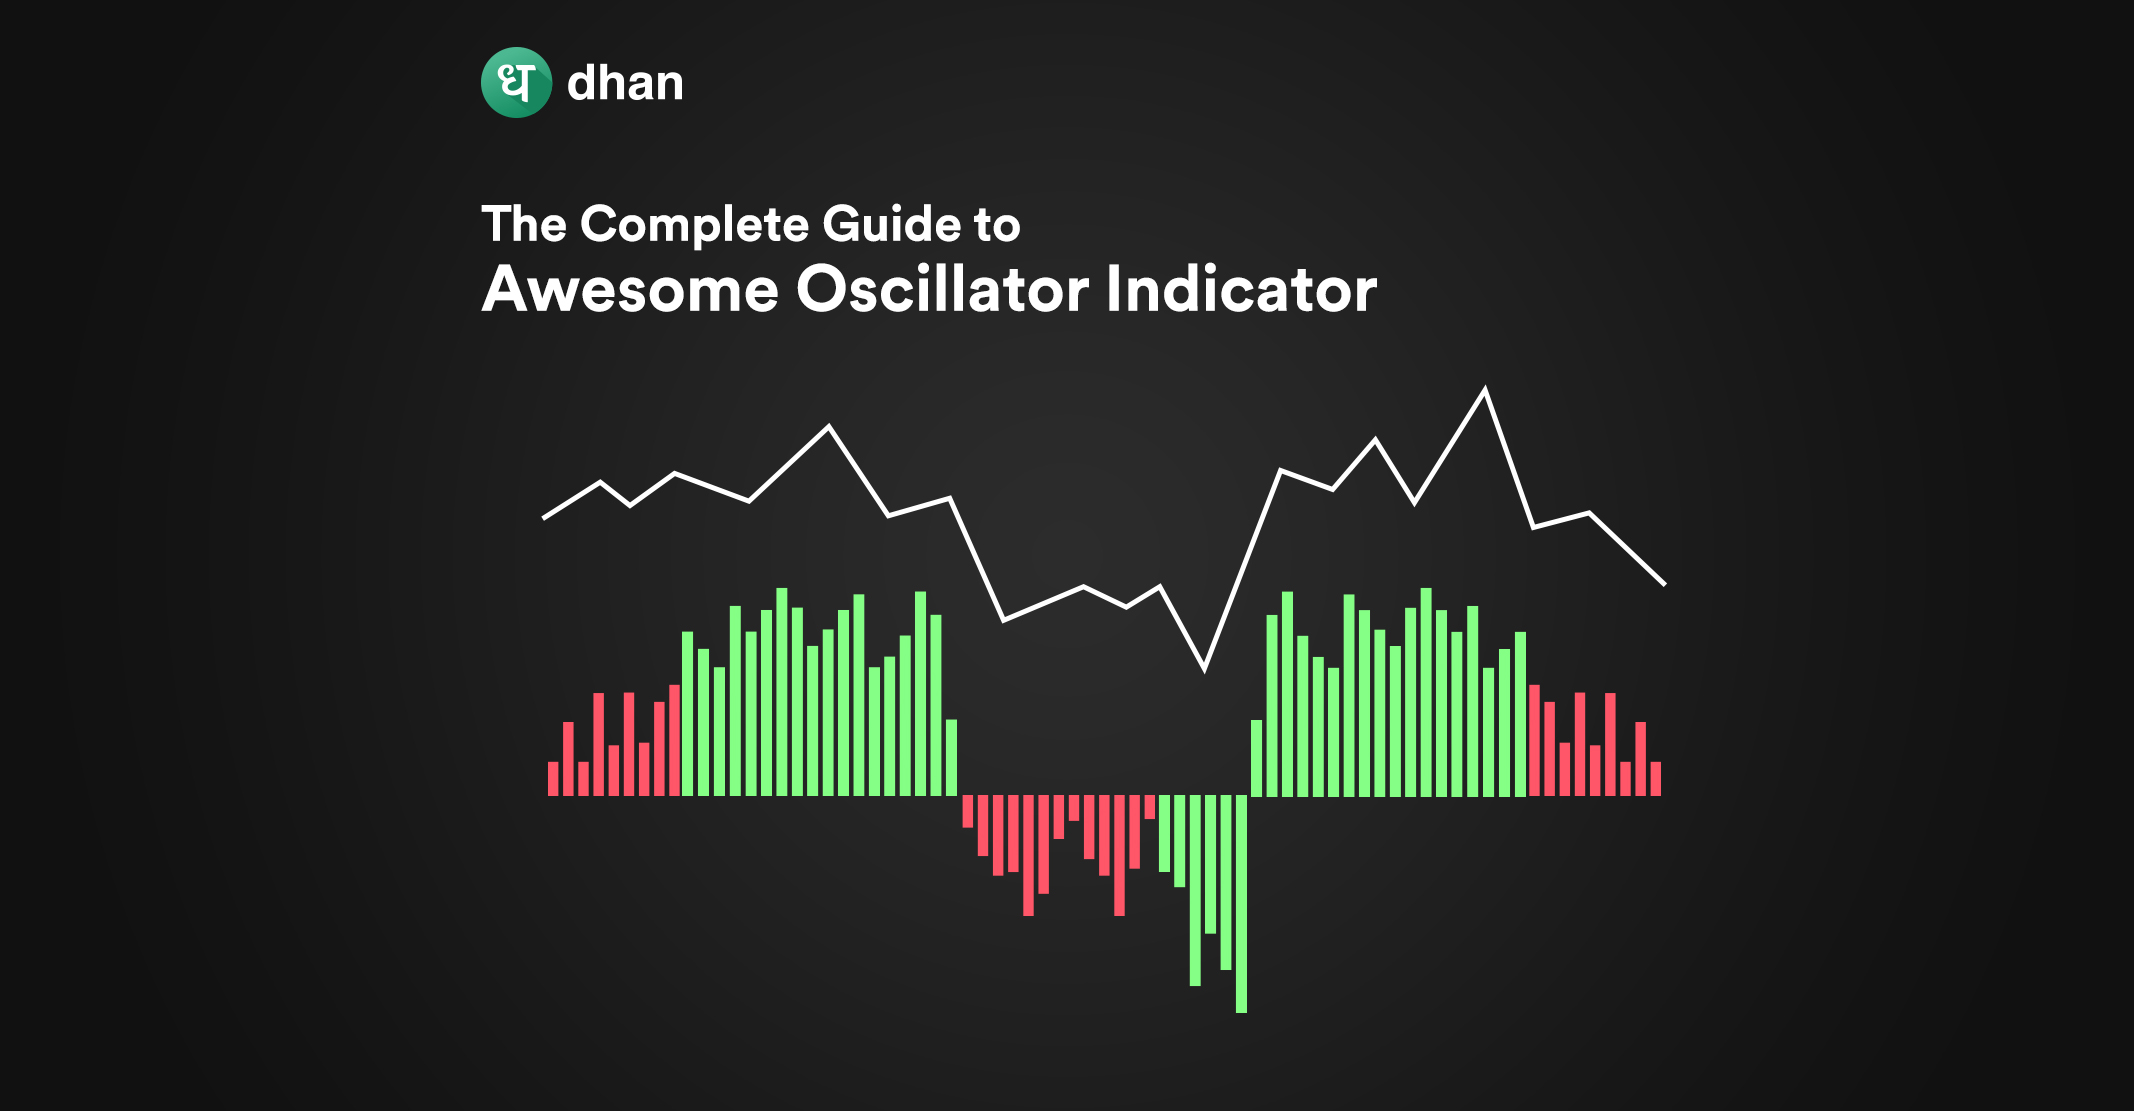
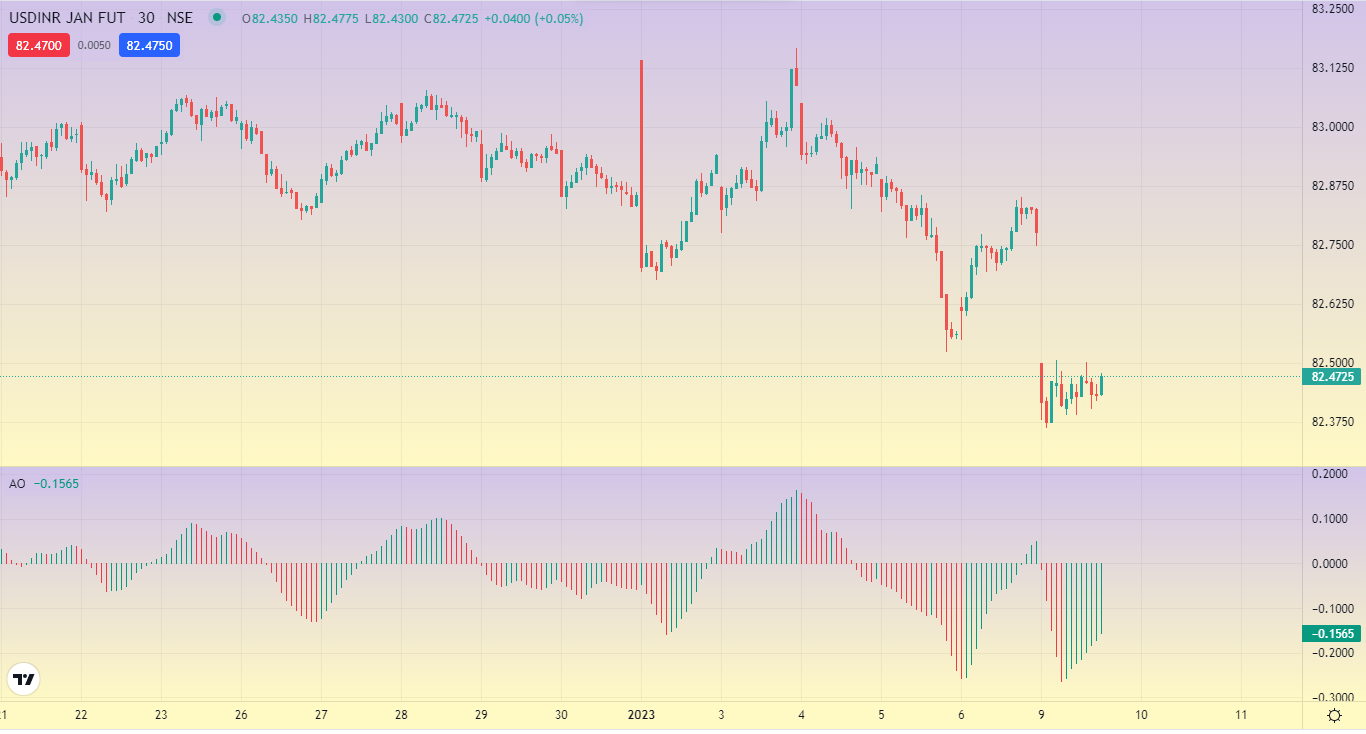
This indicator is the creation of renowned trader Bill Williams. In fact, the Awesome Oscillator was first revealed to the world through one of Bill Williams’ books. Here’s how the Awesome Indicator looks on a candlestick chart.
How to Use the Awesome Oscillator Indicator?
The Awesome Oscillator Indicator provides traders with valuable data for determining the direction of market momentum and whether the current trend will continue or reverse.
If the AO is above zero, the market is bullish but subject to a reversal if momentum shifts in the opposite direction. This is, of course, contingent on trading activity and other factors like earnings reports.
A reading below zero for the Awesome Oscillator indicates a bearish market condition, yet bullish momentum may soon prevail. Possible reasons for this may include earnings reports or buyers trying to win against sellers.
Interpreting Awesome Oscillator Values
| Awesome Oscillator Value | Bullish | Bearish | Neutral |
| Above Zero | Yes | Possible | Possible |
| Below Zero | Possible | Yes | Possible |
Awesome Oscillator Formula
You can use the Awesome Oscillator formula to know how it functions at its core. The Awesome Oscillator formula begins with the difference between a simple moving average (SMA) of median prices over 34 periods and an SMA of median prices over 5 periods.
Although many traders utilize a daily SMA as part of their Awesome Oscillator strategy to determine the market’s dominant trend, any period from minutes to days can be used.
Awesome Oscillator = SMA (MEDIAN PRICE, 5) – SMA (MEDIAN PRICE, 34)
Where,
SMA = simple moving average
Median Price = (HIGH+LOW) / 2
The Awesome Oscillator can be plotted on a price graph automatically by many trading platforms, including Dhan where you can access the indicator for free.
3 Awesome Oscillator Strategies Explained!
Here are a few strategies based on the Awesome Oscillator, which you can implement in your trades.
1. Bullish & Bearish Twin Peaks
Two peaks on opposite sides of the Zero Line are compared using the Twin Peaks technique. As a result of using this method, you can identify promising opportunities to take a contrarian stance.
For this tactic to work, the Awesome Oscillator must show a trough followed by two peaks.
Just below the zero line, two peaks, the second one higher than the first, will form, followed by a green candle signaling a bullish continuation of the trend.
Contrarily, a bearish twin peak forms above the zero line, with the second peak being lower than the first and followed by a red bar.
Put a buy order in when you see a bullish twin peak and a sell order in when you visit a bearish twin peak.
2. Crossing Zero Line
In this, the short-term momentum increases at a greater rate than the long-term momentum when AO rises above the Zero Line. It may be an optimal time to make a bullish purchase.
Short-term momentum loses ground faster than long-term momentum when AO drops below the Zero Line. For bears, this may be an optimal time to sell. This strategy can both be bullish or bearish.
3. A Saucer Approach
The name “saucer strategy” comes from the shape of the plan, which is said to resemble a saucer. A total of three histograms, one each for long and short entries, make up the setup.
Traders who employ this strategy are better able to spot promising opportunities to adopt a contrarian stance.
The Awesome Oscillator needs to display a trough, then two peaks, for this strategy to be effective.
Two peaks, the second one higher than the first, and then a green candle below the zero line indicate that the upward trend will continue.
The opposite is true above the zero line, where a bearish twin peak appears; the second peak is lower than the first and followed by a red bar.
Interpretation of the Awesome Oscillator
Here are a few pointers to help you make the most out of the AO.
- Realize that AO can fool you on occasion. Avoid reacting hastily to every setup you encounter; many may be useless.
- Confirmation can be gained from additional indications or by observing prior price trends. Contrary to relying on the AO’s recommendation, trading only when many signals point in the same direction is riskier.
- Give your method a thorough check. Before committing to it, you should run backtests and demos of your AO strategy. Validate your trading system to ensure that it can generate results with every shift in momentum.
Conclusion
An indicator of market momentum, the Awesome Oscillator is based on the activity of the indicator’s candles and the pattern they reveal.
There are several ways in which the Awesome Oscillator indicator might improve your stock, commodity, or forex trading strategies.
If you use it, remember that it has some caveats and that you should always check for confluence with other indicators before making any trades.
Like this? Then you’ll love: